National Oceanic and Atmospheric Administration U.S. Department of Commerce
NOAA
50 Years of Science, Service & Stewardship
1970 -2020
www.noaa.gov
T
his year, NOAA marks 50 years of science, service, and stewardship. Our agency was born out of an idea that the ocean and atmosphere are inextricably linked and that we depend upon it – not only for the quality of our lives, but for life itself. Since then, NOAA has grown to become a world-class science agency with a reach that extends from the surface of the sun to the depths of the ocean floor. NOAA’s achievements are possible because of its dedicated workforce, who will undoubtedly propel us through the next 50 years of innovation and discovery. Through these pages, we invite you to take a look back at our historic accomplishments, and look forward to a future that ushers in leading-edge science and technology, including in exciting areas such as uncrewed systems, artificial intelligence, ‘omics, and cloud computing – where NOAA’s skilled employees deliver on our mission in bold and innovative ways. Whether building new and creative partnerships with the flourishing space and weather enterprises to deliver the world’s best weather forecasts, powering growth in the American Blue Economy, taking decisive steps to more fully explore our ocean, helping expand domestic marine aquaculture production, or maximizing sustainable commercial fishing by streamlining regulations, we recognize our employees and our partners for their contributions to the stewardship of the Earth, and we celebrate those efforts through the pictures, stories and features that celebrate NOAA’s Golden Anniversary.
Sincerely, Neil, Tim, and Ben
Dr. Neil Jacobs
RDML Tim Gallaudet
Assistant Secretary of Commerce Ph.D., USN Ret. for Environmental Observation Assistant Secretary of and Prediction, performing Commerce for Oceans and the duties of Under Secretary Atmosphere and Deputy NOAA of Commerce for Oceans and Administrator Atmosphere
Benjamin Friedman Deputy Under Secretary for Operations
Table of Contents 3 Foreword 8 NOAA Champions
Interviews 10 Interview: Dr. John V. Byrne NOAA Administrator 1981-1984
98 Interview: Dr. D. James Baker NOAA Administrator 1993-2001
112 Interview: Vice Adm. Conrad C. Lautenbacher NOAA Administrator 2001-2008
32 Artificial Intelligence
Developing transformative improvements in NOAA mission performance and cost-effectiveness
36 Saildrones in the Arctic
In extreme circumstances, uncrewed systems help NOAA solve problems and fulfill its mission.
38 Precision Marine Navigation
Smart solutions for mariners, in port and at sea
42 Weather Aloft
NOAA’s Aviation Weather Center
44 The Coral Reef Conservation Program
132 Interview: Dr. Jane Lubchenco NOAA Administrator 2009-2013
An all-hands approach to conserving, protecting, and restoring coral reefs
140 Interview: Dr. Kathryn D. Sullivan
48 The NOAA Diving Program
NOAA Administrator 2014-2017
NOAA Today 14 An Innovative Technology to Save Lives
50 The Other Wild Blue Yonder
NOAA explorers probe the mysterious ocean deep.
54 The Ocean Prediction Center
Using lessons learned from tragedy and collaboration to protect coastal populations from tsunamis
A mariner’s best friend
18 NOAA Fisheries
Reminding you: The Earth is blue.
56 The National Marine Sanctuaries
Saving fish stocks and ensuring a sustainable seafood supply
60 NOAA Satellites Saving Lives
20 Weathering Storms
62 Harmful Algal Blooms
The National Hurricane Center helps the nation ready itself for worsening storm surges.
NOAA tools for protecting people, food, and the environment
24 Taking America to New Highs and Lows
66 In the Line of Fire
The National Geodetic Survey is giving the United States a gravity check.
The National Weather Service’s Incident Meteorologists
26 Protecting Marine Life
NOAA scientists describe the oceans by studying clues at the molecular level.
NOAA partners to protect, conserve, and recover our most vulnerable marine species.
30 Safer PORTS
68 NOAA’s ‘Omics Today
72 NOAA’s Space Weather Prediction Center Not science fiction
74 Coastal Pollution: Response and Restoration
NOAA’s Center of Expertise for coastal environmental threats
76 Cleaner, Safer Beaches and Coasts NOAA’s Marine Debris Program
50 Years of Science, Service & Stewardship
80 Underwater Gliders
They operate for months unattended, survive hurricanes and shark attacks, and are unlocking the secrets of the deep.
82 Marine Aquaculture A blue revolution
86 2020 Coastal Management Photo Contest Winners 104 Floating and Flying Laboratories NOAA ships and aircraft
Published by Faircount Media Group 450 Carillon Parkway, Suite 105 St. Petersburg, FL 33716 www.faircount.com EDITORIAL Editor in Chief: Chuck Oldham Managing Editor: Ana E. Lopez Senior Editor: Rhonda Carpenter Contributing Writers: Craig Collins Eric Tegler, Jan Tegler
116 NOAA’s Orbital Observatories 124 Partnerships 128 NOAA: A Community of Science, Service, and Stewardship Building a diverse and inclusive workforce
130 NOAA Tribal Partnerships 134 International by Nature
NOAA’s Office of International Affairs spearheads global engagement the agency’s work demands.
NOAA Future 146 Powering the Blue Economy
NOAA leadership drives the growth of benefits from healthy ocean and coastal resources.
DESIGN AND PRODUCTION Art Director: Robin K. McDowall ADVERTISING Advertising Sales Manager: Geoffrey Weiss Account Executives: Art Dubuc III Beth Hamm OPERATIONS AND ADMINISTRATION Chief Operating Officer: Lawrence Wayne Roberts VP, Business Development: Robin Jobson Business Development and Marketing: Damion Harte Accounting Manager: Joe Gonzalez FAIRCOUNT MEDIA GROUP Publisher: Ross Jobson
154 Stewards of the Ocean
Leading the way to cleaner, healthier, more sustainable oceans
162 Enriching Life Through Science
New tools and strategies to maximize the quantity, quality, and value of NOAA science
170 Building a Weather Ready Nation Through Lessons Learned, Innovation, and Partnership
Protecting lives and property from extreme weather
©Copyright Faircount LLC. All rights reserved. Faircount LLC does not assume responsibility for the advertisements, nor any representation made therein, nor the quality or deliverability of the products themselves. Reproduction of articles and photographs, in whole or in part, contained herein is prohibited without express written consent of the publisher, with the exception of reprinting for news media use. Permission to use various images and text in this publication was obtained from the National Oceanic and Atmospheric Administration, and in no way is used to imply an endorsement by any U.S. government or U.S. Department of Commerce entity for any claims or representations therein. None of the advertising contained herein implies U.S. government, U.S. Department of Commerce, or NOAA endorsement of any private entity or enterprise. This is not a publication of the U.S. Department of Commerce. Printed in the United States of America.
NOAA Champions Dr. Robert White I First NOAA administrator Dr. Robert White became NOAA’s first administrator in 1972, following visionary leadership as the first Federal Coordinator of Meteorology and chief of the U.S. Weather Bureau. From the outset, Dr. White set a high bar for federal service by pioneering an approach to meteorology that linked it to observing, understanding, and interacting with the natural environment. He advocated for better weather predictions and improving the global weather observing system through satellites, and he is widely recognized as an early proponent of developing a capability to observe and understand global climate change.
Rear Adm. Evelyn Fields I First woman and African American to lead the NOAA Corps Rear Adm. Evelyn Fields was not afraid to take risks – a characteristic that brought her a few “firsts” in her NOAA Corps career, including becoming the first woman and the first African American to hold the position of director of the NOAA Corps and Office of Marine and Aviation Operations. As a new graduate in 1972 with a degree in math, Fields’ first career position was as a cartographer at NOAA’s Atlantic Marine Center in Norfolk, Virginia, where she worked on nautical charting surveys. She was there less than a year when the NOAA Corps began recruiting women as commissioned officers. Fields became the first African American female to join the Corps. By 1989, she was the first woman to command a NOAA ship. In 1999, she reached the rank of rear admiral and took the helm as NOAA Corps Director.
Dr. David Simonds Johnson I Pioneer in satellite technology Weather forecasting took off in a big way in the 1950s thanks in large part to Dr. David Simonds Johnson, a meteorologist who played a key role in creating the nation’s weather satellite program. Dr. Johnson was the founding director of the National Weather Satellite Center and directed its successors, the National Environmental Satellite Service and the NOAA National Environmental Satellite, Data and Information Service (NESDIS). In 1976, he became NOAA’s first assistant administrator for satellites and data. During his tenure, NOAA launched two series of weather satellites that provided observations of the entire earth twice daily to weather services around the world.
Dr. Nancy Foster dedicated 23 years of outstanding service to NOAA, leaving a remarkable imprint on the agency. She is known for her mentorship – particularly of women in science – and as a champion of diversity. A marine biologist, Foster began her NOAA career in 1977 with the Office of Research and Development, followed by nine years leading the National Marine Sanctuary Program and the National Estuarine Research Reserve Program. Much of the success of the sanctuary program is attributable to her tenure in its early years and through her long-term support and advocacy. From 1986 to 1993, she was director of the NOAA Fisheries Office of Protected Resources. She also created the NOAA Habitat Restoration Center and the NOAA Chesapeake Bay Office. She was a key player in developing the Marine Mammal Health and Stranding Act, which established the Marine Mammal Stranding Network. Dr. Foster helped lead NOAA Fisheries until 1997, where she helped to create a more efficient, responsive, and scientifically rigorous agency, before leading the National Ocean Service.
Dr. Elbert W. “Joe” Friday I Catalyst for National Weather Service modernization Dr. Elbert W. “Joe” Friday was appointed the deputy director of the National Weather Service in 1981, and the director in 1988. In his role as deputy, Friday was responsible for developing a plan to modernize the agency, a plan that he later implemented as director. The modernization and associated restructuring, or MAR, vastly modernized the agency’s observational infrastructure, radically changed the NWS field office structure and staffed them with degreed meteorologists and hyrologists with advanced training in the new systems to ensure more rapid detection of storms and deliver timely forecasts and warnings to the public. The modernization Dr. Friday oversaw significantly improved weather forecasts and warnings. Dr. Friday served as director of the NWS until 1997; his work to modernize the agency is among his proudest achievements.
8
NOAA PHOTOS
Dr. Nancy Foster I Leader and mentor
Dr. John Knauss I Co-founded the Sea Grant Program Dr. John Knauss was under secretary for oceans and atmosphere in the Department of Commerce and administrator of NOAA from 1989 to 1993. Through his extensive career in oceanography and marine policy, one of his notable achievements, in collaboration with Senator Claiborne Pell and Dr. Athelstan Spilhaus from Minnesota University, was the development of the Sea Grant program: “The Sea Grant idea was first proposed by Athelstan Spilhaus at a 1963 fisheries conference. It found fertile soil in Rhode Island. where we believed we were already doing much of what Spilhaus was proposing,” said Knauss in a 2000 issue of Maritimes. “The Sea Grant Act was passed in 1966. URI received one of the first grants in 1968 and became one of the first four Sea Grant Colleges in 1972.” And thus was established an academic/industry/government partnership in recognition that marine resources were an untapped asset for energy, development, and food resources.
Rear Adm. Harley Nygren I First and longest-serving NOAA Corps director After enlisting in the U.S. Naval Reserves in 1942, Rear Adm. Harley Nygren attended and graduated from the University of Washington and was commissioned as an ensign in the Naval Reserve. Nygren received a commission as an ensign in the U.S. Coast and Geodetic Survey (USC&GS) in 1948. His ship assignments included the USC&GS Ships Explorer, Hodgson, Pathfinder, Pioneer, Discoverer, and Surveyor, serving as the commanding officer on the Surveyor. He was promoted to rear admiral in 1968 and became the associate administrator of the Environmental Science Services Administration, where he was instrumental in organizing NOAA. He was appointed as the director of the newly formed NOAA Corps in February 1971. Nygren retired from the NOAA Corps in 1981, having served as the NOAA Corps director for a decade.
Dr. Susan Solomon I Solved the mystery of the hole in the ozone layer When a hole appeared in the ozone layer over Antarctica in the 1980s, Dr. Susan Solomon and her colleagues at the former NOAA Aeronomy Laboratory wanted to know why. To solve the mystery, Solomon led two U.S. scientific expeditions to the frozen continent in 1986 and 1987. Her teams’ observations supported her theory that chemical reactions of chlorine and icy clouds in the cold, polar stratosphere could be responsible for ozone losses during the Antarctic springtime. Through her career, Solomon received many distinguished awards for her work, including the 1999 National Medal of Science, the highest scientific award given by the U.S. government. She also shared the Nobel Peace Prize in 2007 as a member of the Intergovernmental Panel on Climate Change.
Dr. Alexander “Sandy” MacDonald I Invented Science on a Sphere® Dr. Alexander “Sandy” MacDonald began working for NOAA in the National Weather Service Western Region Headquarters in Salt Lake City in 1973. When the Program for Regional Observing and Forecasting was established in 1980, MacDonald led its advanced weather prediction development team. He subsequently was the first director of NOAA’s Forecast Systems Laboratory, and also the first director of its Earth System Research Laboratory. From 2006 to the end of 2012, he was the deputy assistant administrator of NOAA Research. He is the inventor of Science On a Sphere®, a display system that is in hundreds of museums and other institutions around the world, educating people of all ages about Earth science.
NOAA PHOTO
Dr. Margaret Davidson I Visionary in coastal management and sustainability Dr. Margaret Davidson joined NOAA as the founding director of NOAA’s Coastal Services Center, where she created a customer-driven organization that accelerated the use of technology, tools and skills required to make informed coastal economic development and ecosystem management decisions at all levels of government. Before joining NOAA, Davidson was executive director of the South Carolina Sea Grant Consortium from 1983 to 1995. She served as acting director of the Office for Ocean and Coastal Resources Management when that office and CSC merged to form the new Office for Coastal Management. Davidson also took on the challenge of establishing a position to lead NOAA’s response to coastal inundation and resilience.
Dr. Usha Varanasi I First female director of a fisheries field office Dr. Usha Varanasi was the science and research director of NOAA’s Northwest Fisheries Science Center from 1994 until 2010. As the first woman to lead a fisheries field office, she dedicated much of her 35 years of service in NOAA to addressing critical biological questions and improving public policy decisions. Her revolutionary research on marine organism contaminants led to a reduction in damage to fisheries resources and improvements in food safety.
9
INTERVIEW
Dr. John V. Byrne NOAA Administrator 1981-1984
Dr. John Vincent Byrne earned his B.S. in marine geology from
Hamilton College, an M.S. in geology from Columbia University, and his Ph.D. in marine geology from the University of Southern California. He was Oregon State University’s first dean of oceanography, and was vice president for research and graduate studies and dean of research. Between 1972 and 1977, he was director of the Hatfield Marine Science Center. Byrne was nominated to serve as the administrator of the National Oceanic and Atmospheric Administration (NOAA) by President Ronald Reagan in 1981. He held the position until 1984, when he returned to Oregon State University to become its president.
How did you come to NOAA and what was the process like? Dr. John V. Byrne: The first thing you need to know is that we started an oceanography program here at Oregon State University. And I was one of the first people hired. Subsequent to that, I became a department chair and then I became dean of the school as it evolved into something larger. During this period, I was asked to participate on a number of national committees. So, when Ronald Reagan was elected, and that was 1980, they were looking for an oceanographer for NOAA. And the reason for that was that Bob White, the first administrator, was an atmospheric scientist, and Dick Frank, the second administrator, was an environmental lawyer. And the ocean interests on the Hill were looking for an oceanographer. My name came up on the list of potential candidates, and through the whole process I ended up being asked to be the administrator. So, it was the result of having been active on a number of national committees and then going through the process.
10
Coming in from the private sector, what was your impression of the scientists, the employees, the different administrators that worked at NOAA as far as their expertise? Well, I think the best example, the easiest example, is the Weather Service. At the time, there were a number of examples where the people in the Weather Service, they had bad weather, and they stayed in the office until they had the accurate forecast out, and in some cases, actually overnighted in the office. And to me, that was a symbol of dedication and taking their job very, very seriously. These people are dedicated. They work hard. They give more than is expected of them. Now on the other side of that, the negative side, is that frequently, scientists become enamored with their own science. If they are biologists, they have a certain affection for the organisms they are working with and so on. And they can bias the reports by the words they use – still stating the facts, but in such a way that it gives a certain tone to their reports. So
Dr. John V. Byrne, during his tenure as NOAA administrator, 1981-1984.
we had to counter that on a couple of occasions. But again, they were dedicated scientists. They cared about the science they were doing. I think the same was true about the support staff, who wanted to do everything they could for the people they worked with and the people they worked for. What did you find to be the most challenging issues you had to work through during your time at NOAA? Well, we had a number. On one occasion, one of the weather satellites failed, so we had to move the GOES West satellite eastward and use Japanese satellites for the weather over the Pacific. That was a challenge. … Frequently we had conflicts in the fisheries area. Crab fishermen got sideways with fin fishermen. So, there were conflicts among the fishing industry.
Probably the most challenging was the folks that oversaw us in the Office of Management and Budget [OMB] took the Reagan policies very seriously, as they should have. And they weren’t knowledgeable in terms of the science, or the environment, or whatever it was we were working on, so they would resist some of the things we tried to do, or they would misinterpret what was involved. There are a couple of examples of that. We had proposed a limited entry halibut fishery around Alaska. We had everybody lined up ready to go with that. And literally, within a day, an employee of the Office of Management and Budget told us, “You can’t do that. That’s not the American way.” That was one example. Another example was in terms of charging the full cost for some of the services and some of the activities that we did. OMB wanted us to full charge the cost of nautical charts. We interpreted that to mean the printing, the distribution, that sort of thing. But their intention was that all of the surveys that went into it should be part of the cost that people purchasing the charts would have to pick up. That certainly wasn’t realistic. Charts that would cost up to less than $10 apiece, it would drive the price up to sometimes several orders of magnitude more than that. So, it was difficult to explain that to the folks who monitored us in the Office of Management and Budget. Anyway, I can keep going with examples. They wanted us to privatize the Fruit Frost Warning Program. It was a program where the guys in the Weather Service in areas that produced citrus fruit would make forecasts as to when the temperatures leading to frost would occur so the farmers could put their smudge pots out and that sort of thing. It didn’t make sense because we didn’t have any person who was totally dedicated to that program. So, we proposed charging for the Fruit Frost Warning Program, and that did not go over
well with the private sector, with the farmers and so on. So, we had those kinds of problems. I suppose if you wanted to simplify it, it was a matter of translating policy to action. And that’s where the problems were in many cases. How did you feel about the sort of push-pull or tug of war between science and political policy? I have a tendency to want to use anecdotes. During my first oversight hearing, Sen. Frank Lautenberg asked me whether we had enough money to do research. And my answer to him was, “No, you never have enough money to do all the research you want to do,” which was interpreted by some people to mean I was opposed to the president’s policy, which was not the case. It was just a matter of making people who were not involved with doing scientific research understand a little bit more than they did about the nature of research and the fact that it really does produce more questions than it does answers. You know, it was that sort of thing. It was a matter of … it wasn’t a controversy so much as a discrepancy between understanding of certain issues, particularly scientific and environmental issues, for NOAA. What do you consider the most important accomplishments for NOAA during your tenure there? Oh, gosh, I don’t know what the most important accomplishments were. It was one of those things where the Weather Service was improving. And that is an extremely important part of NOAA. The other problem I guess was that Tony Calio and I – mostly Tony – reorganized the structure of NOAA somewhat. The Fisheries Service, the Weather Service, the Satellite Service, and so on all thought of themselves as independent units, which they were to a great extent. We constantly referred to the Weather Service as the National Weather Service – not the NOAA Weather Service, but the Na-
tional Weather Service. And that’s the way these organizations thought of themselves. The National Marine Fisheries Service thought of itself as an independent agency devoted to fisheries and so on. So that was a constant challenge. But I always thought the guys worked pretty well together. So, NOAA really was sort of a holding company for a number of scientific units. The Coast and Geodetic Survey had been morphed into the National Ocean Service. And they did the surveys, which was pretty much independent of the rest of NOAA. And I think that was one of the constant annoyances, I suppose, that we really were not as successful as we should have been in terms of integrating all of the different aspects of NOAA. Now, one of the things that I tried to do, at least on my watch, was because of the complexities of the scientific units of NOAA – the Weather Service, the National Marine Fisheries Service, all of these – we tried to create NOAA Service Centers that were offices set up in cities like Seattle and Anchorage and so on where there would be somebody who was knowledgeable about the nature of NOAA. People who came in with a specific problem could express their problem, and the NOAA employee on the spot would know who to contact or how to contact different people within NOAA who could help solve that individual user’s problem. Well, that got off to a reasonable start, I thought. But it cost money. So, when push came to shove – and this was subsequent to my time at NOAA – the NOAA Services Centers were one of the first things to go. So, you always had that problem: You always had the problem of budget and that sort of thing. I think that all the time I was at NOAA, we had a budget once and the rest of the time we were operating on a continuing resolution. So another constant problem was funding. And these are not unique problems. They probably exist the same way today.
11
One of the signature things that happened during your administration had to do with whaling. I wondered if you could just talk about that a little bit. Well, traditionally, at least up until the time I was the administrator, the administrator of NOAA was the United States representative to the International Whaling Commission [IWC]. I don’t know how much that continued after my watch, but on my watch, the Whaling Commission passed a moratorium on commercial whaling. I could go into a lot of chapter and verse on that one. But it was, in a sense, a recognition by the United States government of the importance of serving the environmental community, who didn’t want to see whales killed. So, it was figured out that if we get enough nations that are non-whaling nations, they would have the vote in the Whaling Commission to pass this moratorium. The idea of the moratorium was, “Well, some of these whaling stocks seem to be endangered. Let’s stop whaling them and see if they can recover.” So that was the idea on the holding back on commercial whaling. This is pretty arcane stuff, but the Whaling Commission didn’t really have any power. It had recommendations it could make. It could set quotas for the taking of numbers of whales, but there wasn’t any way of enforcing that. One of the provisions was that you could continue to whale for research purposes. And that’s what the Japanese did. The Japanese were far and away the largest effective whaling nation. There were others, but the Japanese were the No. 1. And we always figured if we could shut off the Japanese market for whale meat, you could pretty much stop whaling. So that was the intent. The moratorium was passed – I think it was 1982 – to go into effect several years later, and it affected commercial whaling. The whalers were basically Iceland, Japan, Norway,
the Soviet Union, and so on. The Russians, the Soviet Union, stopped whaling because their whaling fleet was giving out and they didn’t want to replace the vessels. So, they were not a problem. Norway was taking whales in the North Atlantic and at that time selling about 85 percent of the whale meat to the Japanese. Iceland was in and out – if they didn’t get their way at the Whaling Commission, they would withdraw from the IWC, that sort of thing. So those were the issues we faced. The other thing I should mention to you is if a whaling nation did not like the quota that was set for them, they could file an objection within 90 days of the Whaling Commission meeting. And a number of nations did that. Well, the Japanese did that when we passed the moratorium on commercial whaling. So, the next task was to get the Japanese to withdraw their appeal, to withdraw their refusal to go by the quota that was being set. So that was the next task. And that was about the time I left NOAA. I worked the situation with Secretary Baldrige [Malcolm Baldrige Jr., then serving as the U.S. secretary of commerce] and, I suppose, ultimately with the president, to continue as the whaling commissioner after I left NOAA and came back to Oregon State as its president. And so, for one year I was the whaling commissioner and the president of Oregon State. And we still had to set quotas because the moratorium had not gone into effect [yet]. But we still had those issues. The hardest issue for me was getting whale quotas for the Alaskan Eskimos, which made the United States a whaling nation under that particular provision of the agenda and a nonwhaling nation on all the other issues. So those were all the challenges that we faced. I understand the Japanese have withdrawn and are no longer members of the IWC. The IWC was set up originally to ensure that there was a sustainable number of whales
NOAA TODAY
that could be harvested so that the whaling industry would go on forever. And then, of course, the people who wanted to save the whales influenced the whole situation. And we ended up whaling and nonwhaling. And the environmental nations by and large were nonwhaling nations and wanted to see the cessation of whaling. Is there anything that I should have asked you that I didn’t or that you would like to add or comment on? One of the problems I had personally, and I guess Bob White had had a similar problem, was the nature of appointments to senior positions at NOAA. The White House wanted to play a role – they wanted to use politics to reward people who had helped in the election and so on. That is something that I did not understand then but I fully understand it now. It’s a problem. I wanted certain persons and the politicians said, “No way. You’re not going to have this guy. He was a Democrat. You’re in a Republican administration now. There is no way you’re going to let him in, and here is somebody that I would like to put in that spot.” Bob White had the same problem. Of course, he was the originator of NOAA. So, he managed to have an associate administrator position created. And that was basically his real deputy. I think his name was Jack Townsend. He [Townsend] was … his deputy, whereas the person who signed as the deputy administrator was a politician who was basically ineffective. I had the same thing with Tony Calio and Jim Winchester. These were good people. They just had different orientation on things. They had different opinions. We see this all the time in politics. People that were sincere want to get their way and we don’t quite understand them, whoever they are. They don’t understand us, and why we think the way we do and why they think the way they do. That’s the problem. And that’s what you have in a democracy.
13
NOAA TODAY
An Innovative Technology to Save Lives
Using lessons learned from tragedy and collaboration to protect coastal populations from tsunamis
O
n March 11, 2011 a 9.1 magnitude earthquake erupted 81 miles off the eastern coast of Tohoku, Japan. The Tohoku Earthquake (often referred to as Fukushima) was the fourth largest earthquake ever recorded. In addition to the impacts felt as far south as Tokyo, the earthquake sent tsunami waves speeding into the Japan coast and out across the Pacific Ocean. NOAA’s Pacific Tsunami Warning Center reported a wave with maximum height of 9.15 feet at an observing station at Hanasaki, Hokkaido, 5.7 feet at Kahului, Maui, Hawaii and 6.6 feet at Crescent City, California. This tragic event resulted in many lives lost in Japan, and if not for NOAA’s work in developing a more effective tsunami warning system, then many lives could have been lost in Hawaii as a result of
the tsunami’s impacts. The Deepocean Assessment and Reporting of Tsunamis (DART ) buoys near Japan were used to produce the world’s first forecast of tsunami flooding for Kahului (figure 2) and other locations in Hawaii. Evacuations were issued six hours before the tsunami struck. Lives were saved. The coastal communities in Alaska, Hawaii, and on the U.S. west coast are in seismically active regions that can generate tsunamis, therefore NOAA initiated research in the 1980s to develop direct measurement of tsunamis in the open ocean. The DART deep ocean tsunami detection buoys were established as a real-time reporting network of these measurements, and sent real-time reports to warning centers to improve the assessment of the tsunami hazard.
The DART was conceived as part of the U.S. National Tsunami Hazard Mitigation Program (NTHMP), which was created as a result of congressional direction to NOAA in 1995. The program’s mission was to lead a federal/state working group to develop a plan for reducing tsunami risk to U.S. coastal communities. Within a couple decades, DART was created, tested and validated, and became part of NOAA’s tsunami warning operations. This successful DART tsunami forecast capability was not only useful to U.S. interests. Today, in addition to 39 US operated DART buoys, there are 37 operated by global partners across the Pacific and Indian Oceans. Since the beginning of the 20th century – more than 500 people and $1.9 billion in property have been lost in U.S. states and territories due to tsunami impacts. Studies suggest a large tsunami could affect millions of Americans and cause tens of billions of dollars in damage. Tsunamis cannot be prevented, but their impacts on life, property, and the economy can be greatly reduced. The National Tsunami Hazard Mitigation Program includes not only
Did You Know Hawaii has the greatest risk for tsunamis, averaging one per year.
Evolution of NOAA: 1807-2020 14
NOAA TODAY
Hawaii, Alaska, West coast states, and tribes along these coasts, are most at risk for tsunamis. NOAA, but the Federal Emergency Management Agency, the U.S. Geological Survey, and 28 U.S. states and territories. Their vision is to reduce loss of life and property when a tsunami strikes, and they accomplish this through collaboration, coordination, and financial and technical support to partner states. NTHMP and its partners are committed to mitigating the impact of tsunamis through public education, community response planning, hazard assessment, and warning coordination. Their work in education and outreach increase awareness and encourage preparedness through programs like the National Weather Service’s TsunamiReady program, which improves public safety before, during and after tsunami events. The NTMP works closely with another critical resource, NOAA’s Center for Tsunami Research at
NOAA GRAPHIC
Did You Know
Figure 2. A graphic of the DART system.
The first wave of a tsunami is seldom the most powerful. It is successive waves that have more strength.
1807
President Thomas Jefferson establishes Survey of the Coast, America’s first physical science agency. Ferdinand Hassler’s plan, based on scientific principles, selected by government. Hassler, later selected to be Superintendent of the Coast Survey, imbues the organization with standards of accuracy, precision, and integrity.
15
NOAA TODAY
NOAA GRAPHIC
Tsunamis can travel across entire oceans while retaining most of their energy.
Did You Know
NOAA PHOTO
Today, in addition to 39 US operated DART buoys, 37 are operated by global partners across the Pacific & Indian Oceans. the Pacific Marine Environmental Laboratory, which develops models and inundation maps for faster and
1814
Right: The NOAA Ship Fairweather as seen from a RHIB during tsunami buoy recovery efforts. This buoy had broken loose from its moorings.
more reliable forecasts of tsunamis. Through warning coordination, the NTHMP provides input to the U.S. Tsunami Warning System so that warning system products are effective during a tsunami warning. The NWS’s Tsunami Warning Centers – the National Center, which serves Alaska, Canada, and the continental United States; and the Pacific Center, which serves Hawai’i and U.S. territories in the Pacific and Caribbean – analyze seismic and sea-level data from around the world, and provide information about an earthquake’s location, depth and magnitude utilizing the DART system for
Surgeon General orders surgeons to keep weather diaries; first government collection of weather data.
alerting if an earthquake has the potential to cause a tsunami. We have learned many lessons from past Tsunamis. As a result, the nation’s ability to respond to a tsunami has come a long way since 1995. Much of this progress is because of the NTHMP and its partners, both individually and collectively. Today, thanks in part to the work of the NTHMP, PMEL, TsunamiReady, and the Tsunami Warning Centers, U.S. coastal communities are better prepared to protect people and property from the impacts of future tsunamis. For more information, visit https:// nws.weather.gov/nthmp/.
1816–1817
Survey of the Coast performs first horizontal geodetic surveys (triangulation) in the area of New York Harbor.
17
NOAA TODAY
Saving fish stocks and ensuring a sustainable seafood supply By Craig Collins
B
y 2000, the outlook for some groundfish along the U.S. West Coast – and for the fishers who harvested them with trawl nets for seafood – was grim. Several of the more than 90 types of groundfish inhabiting the waters along the continental shelf off Washington, Oregon, and California were near collapse. The population of one species, the bocaccio, once a staple of California fish markets, had decreased by 95 percent. Two other species, canary rockfish and yelloweye rockfish, had lost 92 percent of their original numbers. “Groundfish” is a name used broadly to describe dozens of species that live on or near the Pacific seafloor and mature slowly – bocaccio don’t begin reproducing until they are 5 years old, and can live to be 50. As several West Coast species began to dwindle in the 1990s, fisheries scientists estimated it would
1832
take decades – for a couple of species, a century or more – to recover, even if commercial fishing were banned outright. Under federal law, NOAA’s National Marine Fisheries Service (NOAA Fisheries) is responsible for scientifically monitoring, regionally managing, and legally enforcing the sustainability of wild U.S. fish stocks. This effort is guided by six fisheries science centers, which advise the decision-making of eight regional fishery management councils.
Did You Know
Combined, U.S. commercial and recreational saltwater fishing generated more than $244 billion in sales and supported more than 1.7 million jobs in 2017.
An Office of Weights and Measures, the forerunner of the National Institute of Standards and Technology, is formed under the U.S. Coast Survey.
18
NOAA FISHERIES IMAGE
NOAA Fisheries
With several species of rockfish in trouble, the Pacific Fishery Management Council, a group of federal, state, tribal, and regional stakeholders that includes representatives from both the commercial and recreational fishing industries and environmental groups – took action and collaborated on the Pacific Coast Groundfish Fishery Management Plan, which would revive the groundfish industry while permanently protecting thousands of square miles of reefs that benefited the overfished species. Under the plan, some sections of the ocean were closed off entirely. In other areas, catch limits were severely reduced. As populations gained in number – in many cases, much more quickly than fisheries scientists had anticipated – the council switched to an innovative new system of managing the fishery in 2011: catch shares, in which each boat, rather than competing with other boats to catch the largest chunk of a species quota, is assigned its own share of the total catch beforehand. The recovery of Pacific groundfish species has been an astonishing success story. By the end of 2019, all but two of the 10 overfished species had completely
NOAA TODAY
NOAA has rebuilt 47 fish stocks since 2000, including multiple species of crab and salmon.
Opposite: Illustration of a boccacio, once severely overfished but now recovered in numbers. Above: A yelloweye rockfish.
example, U.S. fisheries generated $244.1 billion in sales and added another $110.7 billion in added
value (i.e., jobs, license sales, and other associated benefits). It also ensures the stability of our nation’s seafood supply while protecting the health of marine habitats. In the past 20 years, NOAA Fisheries’ collaborative approach to fisheries management – involving input from the industry, environmentalists, and policymakers – has reduced the number of overfished stocks and rebuilt a total of 47 species populations – creating more opportunities for commercial and recreational fishers and more food for American consumers.
NOAA GRAPHIC
rebuilt their populations, decades ahead of schedule, and the council established higher catch limits for bocaccio, canary rockfish (more than double the original allowable catch), and Pacific Ocean perch (more than tenfold) that were expected to boost fishing income in coastal communities by $60 million. In January of 2020, regulators reopened an area the size of Rhode Island off the Oregon and California coasts to groundfish trawling. Eliminating overfishing and rebuilding stocks adds value to the U.S. economy – in 2017, for
1841
The U.S. Lake Survey office is established in the Great Lakes, to undertake a “hydrographic survey of the northern and northwestern lakes.”
19
NOAA TODAY
Weathering Storms
The National Hurricane Center helps the nation ready itself for worsening storm surges. By Craig Collins
I
f you lived in the New York metro area in 2012, you’ll never forget Sandy. The 900-mile-wide storm raked the Atlantic coast from Florida to Massachusetts in October of 2012. When it struck the New York/New Jersey region on October 29, it drove a massive surge of water that obliterated beaches
1842
and boardwalks, filled subway tunnels, and buried some parts of New York City under nine feet of water. 51 square miles of the city, about 17 percent of its land mass, were flooded by Sandy. If you’re a meteorologist, you might remember something else about Sandy: By the time it arrived
James P. Espy appointed first official U.S. government meteorologist.
20
1843
in New York Harbor, it barely qualified as a hurricane. It’s usually referred to as “Superstorm Sandy.” Weather experts have been debating whether the traditional way of classifying hurricanes – a rotating low-pressure tropical weather system, or cyclone, with sustained winds of at least 74 miles per hour
Alexander Dallas Bache, a great-grandson of Benjamin Franklin, is appointed second superintendent of the Coast Survey.
NOAA PHOTO
This image of Hurricane Katrina was taken by the NOAA-16 AVHRR instrument on Aug. 28, 2005. Katrina was a reminder that 21st-century hurricanes tend to be bigger than in the past, bringing with them more rainfall and more powerful storm surges.
NOAA TODAY
Of the 258 U.S. weather disasters since 1980, tropical cyclones have caused the most damage: $945.9 billion total, with an average cost of almost $21.5 billion per event.
NOAA GRAPHIC
– by their maximum sustained wind speed, might be incomplete. The National Weather Service’s National Hurricane Center (NHC) has been among the leading voices arguing that classifying the severity of hurricanes on a scale of Category 1 to Category 5, increasing with wind speed, isn’t enough to communicate a hurricane’s potential for damage, since the category only reflects the wind damage potential. The NHC, one of the National Weather Service’s National Centers for Environmental Prediction, is located on the campus of Florida International University in Miami, and relies on several expert units to meet its mission to save
lives and reduce economic losses with watches, warnings, forecasts and analyses of hazardous tropical weather. The NHC recently released a report clarifying the dangers of hurricanes: over the past 50 years, storm surge has been directly responsible for nearly half the deaths in the U.S. attributable to Atlantic storms, far more than rainfall or winds. During this half-century, aided by higher-resolution satellite imagery and better numerical models, NHC products and services have become increasingly accurate and timely. At the same time, there has been a growing sense that an equally important element of NHC’s mission – to increase public under-
standing of these hazards – needed updating, to match the changing nature of tropical storms. “Going all the way back to storms like Isabel, in 2003 – which had a tremendous storm surge impact in places like Chesapeake Bay,” said Michael Brennan, branch chief of the NHC’s Hurricane Specialist Unit, “there was a push within the Weather Service to focus more on the storm surge hazard itself, because up to that time, that risk was just bundled in with the wind hazard . . . and the thing to remember is that storm surge is the main reason evacuations are done in this country for hurricanes.” The NHC developed and rolled out a separate warning mechanism – the storm surge watch/warning – in time for the 2017 hurricane season. “The watch is issued generally about 48 hours before we expect either the water to start to rise or tropical storm-force winds to start,” said Brennan, “either of which would result in basically the end of your preparation time. You have to be evacuated by then.” A warning means there is the danger of life-threatening surge within the warning area, and is issued within 36 hours of the hazard. 2017 was the costliest year in U.S. history in terms of weather-related damage, with hurricanes Harvey, Irma and Maria contributing to more than $306 billion in losses.
1845
U.S. Coast Survey begins studies of Gulf Stream, first government - sponsored systematic oceanographic project for studying a specific phenomenon. Physical, geological, biological, and chemical oceanography of the Gulf Stream and its environs serves as a model for all subsequent integrated oceanographic cruises.
21
NOAA TODAY
Did You Know
NOAA PHOTO
NOAA IMAGE
Tropical cyclones are responsible for the highest number of deaths of all weather disasters since 1980: 6,502. With the storm surge watch/warning in place, Brennan pointed out, “we’ve seen a relatively low number of storm surge fatalities, going back to 2017, compared to what we might have historically expected from this many substantial hurricanes hitting the United States.” The NHC continues to refine its abilities to predict and communicate tropical weather risks. As it developed its storm surge watch/warning advisories, the center also began issuing watches, warnings and advisories for “potential tropical cyclones.” Before 2017, Brennan explained, the NHC had no mechanism for alerting the public to an offshore storm system that hadn’t yet met the definition of a tropical depression or tropical storm, even if its experts believed the system would strengthen. “On average, this gives us about 17 or 18 hours of additional lead-time on the watches or warnings,” Brennan said. In 2020 the NHC developed an experimental graphic showing the peak storm surge forecast to accompany its tropical cyclone public advisories to allow users to better visualize the areas at risk from dangerous storm surge.
Top: The NHC will begin providing an experimental graphic in 2020 that will depict the expected storm surge inundation values for the United States Gulf and Atlantic coasts, Puerto Rico, and the U.S. Virgin Islands that are provided in the tropical cyclone public advisory (TCP), and will be available on the NHC website. These values represent the peak height the water could reach above normally dry ground within the specified areas. This sample graphic depicts values provided in Hurricane Dorian Tropical Cyclone Public Advisory 46. Above: A mobile home park on the north side of U.S. Highway 98 in Mexico Beach, Florida, washed away by the storm surge and wave impacts of Hurricane Michael, Nov. 2, 2018.
1848
Volunteer Weather Observers recruited through the Smithsonian Institution. The Smithsonian supplies weather instruments to telegraph companies and begins extensive weather observation network the following year.
23
NOAA TODAY
Taking America to New Highs and Lows The National Geodetic Survey is giving the United States a gravity check. By Craig Collins
I
1851
Ferdinand Hassler directs the movement of the great theodolite to the station while working on Fire Island, about 1837. Sketch by John Farley.
More than 1.5 million of these benchmarks eventually formed a network used to position other points of interest. By the late 19th century, geodesists had begun to record and observe other geodetic criteria, such as elevation, gravity and magnetic variation. By the turn of the 20th century, geodesists had developed a sophisticated mathematical model to represent sea level, based on tidal readings. The nation’s height reference, or vertical datum, has been adjusted several times since then – but not since 1988. Over this time, for several reasons, slight errors in calculating heights have accumulated, generally worsening diagonally from the tip of Florida – which requires minimal height adjustments – to the Pacific
U.S. Coast Survey commissions Louis Agassiz to conduct first scientific study of the Florida Reef system.
24
1853
First Tide Prediction Tables published.
NOAA CENTRAL LIBRARY IMAGE
n a couple of years, when Seattle gets shorter, Mount Rainier, the tallest of the Cascade peaks, will shrink also, from 14,411 feet to about 14,407. As unlikely as this may sound, it will actually be the end of a long and complicated process called “height modernization.” It all started in 1807, when President Thomas Jefferson directed the first Superintendent of the Survey of the Coast, Ferdinand Hassler, to chart U.S. shorelines. Hassler, realizing these charts would have to be anchored to reference points on land, laid the foundation for American geodesy: a combination of disciplines that together measure and represent the size and shape of the Earth. The geodesic tools of Hassler’s Coast Survey – the theodolite, a kind of telescope for measuring angles, and bars and tapes for measuring distances – were used to conduct line-of-sight Earth-based surveys that relied on a geometric method known as “triangulation”: using the angles between two lines of sight to establish the distances between two points. These distances were then used to assign longitudinal and latitudinal coordinates to geographic locations, anchored at benchmarks – which are still functional and visible today as cast-metal disks set in stone or concrete, or at the ends of rods sunk into the Earth, displaying a site’s longitude, latitude, and height above sea level. As the nation expanded to the west, benchmark heights used the coast as the reference point for zero elevation. Americans who measured the heights of things, such as buildings or mountains, tied their measurements to benchmarks and, indirectly, to sea level.
NOAA IMAGE
Northwest, where readings are off by as much as five feet. Some parts of Alaska are more than six feet too tall. Today, geodesists with NOAA’s National Geodetic Survey (NGS) use space-based tools, such as the Global Positioning System (GPS), to measure the distance between coordinates and to observe and record other parameters. The NGS’s core responsibility is to define, maintain, and provide access to all of this geodetic information, which is known collectively as the National Spatial Reference System (NSRS). Traditional benchmarks have been supplemented by more sophisticated reference points, known as continuously operating reference stations (CORS), that receive geodetic information broadcast by the Global Navigation Satellite System (GNSS). Today there are about 2,000 CORS online.
Did You Know The NSRS network contains more than 1,500,000 terrestrial reference points. The new effort at height modernization, once completed in 2022 or 2023, will enable NOAA geodesists to more accurately describe how geodetic coordinates, heights, and other criteria change over time. Rather than rely on fixed benchmarks for vertical and horizontal datums, the new NSRS will rely on satellite sensors and a new model for measuring local variations in gravity. A modernized NSRS will offer new, more accurate, time-stamped geodetic coordinates at CORS, with coordinates updated every five years – more accurate,
NOAA TODAY
complete, and timely measurements of positions. The nation was literally built on the NSRS and its predecessors: Surveyors, mappers, engineers, and others have used it to establish property boundaries; construct buildings, roads, bridges, and levees; create accurate maps and charts; and much more. A 2009 study estimated that the NSRS and other NGS services provide more than $2.4 billion in economic value to the nation. The value of such a self-updating system is likely to increase significantly in the future, as the planet continues to undergo rapid change. As glaciers and ice sheets melt, they not only change sea level, the geodesist’s baseline for height measurement; they also make subtle changes to the planet’s shape and configuration. The new National Spatial Reference System will be able to tell us, with confidence, where we are on this changing Earth.
NOAA’s National Geodetic Survey defines and manages the National Spatial Reference System (NSRS) – a consistent coordinate system that defines latitude, longitude, height, scale, gravity, and orientation throughout the United States. In addition to a network of continuously operating reference stations (CORS) supporting three-dimensional positioning activities (shown here), the NSRS includes a network of permanently marked points; a consistent, accurate, and up-to-date national shoreline; and a set of accurate models describing dynamic, geophysical processes that affect spatial measurements.
1854
United States Coast Survey begins using self-recording tide gages. The one installed at San Francisco began the longest continuous series of tide observations in the Western Hemisphere.
25
NOAA TODAY
Protecting Marine Life
I
t’s been a rough century for the white abalone. Sometime in the early 20th century the large sea snail, one of seven species inhabiting California’s coastal waters, was discovered by fishermen to be the most tender. By the 1970s the population had been decimated, and by the beginning of the 21st century only a few hundred remained, living so far from each
1861–1865
other that their natural means of reproducing – releasing clouds of sperm and eggs and letting currents do the rest – couldn’t possibly generate enough offspring for the species to survive. In 2001, the white abalone became the first marine invertebrate to be listed as a federal endangered species. But things may be looking up: In the fall of 2019, the number of white
abalone off the Southern California coast more than doubled. The National Marine Fisheries Service’s (NOAA Fisheries) White Abalone Recovery Plan includes a captive breeding program to enhance wild populations of white abalone in strategic locations along the Pacific coast. In November 2019 the first juvenile abalone were planted by divers in secret locations along the coast: 3,200 juveniles, bred
United States Coast Survey serves in all theaters of the Civil War and with all major commanders. Coast Surveyors served as hydrographers, topographers, and scouts often in advance of front lines. Coast Surveyors given military rank while attached to a specific command.
26
NOAA PHOTO
NOAA partners to protect, conserve, and recover our most vulnerable marine species. By Craig Collins
ADAM OBAZA, PAUA MARINE RESEARCH GROUP
PHOTO BY JAN DELSING
Opposite page: NOAA Fisheries staff surveying a beach nourishment project area for abalone. Above: Divers Tom Ford (The Bay Foundation) and Stephanie Nemeth (NOAA Fisheries’ Southwest Fisheries Science Center) place juvenile white abalone into an outplant module during their release of endangered white abalone back into the wild off of Southern California. Above right: A white abalone.
in captivity and introduced in clusters to their ancestral home. It was the first release of captive-bred white abalone into the wild. Partners such as the California Department of Fish and Wildlife, Paua Marine Research Group, The Bay Foundation and many others made this historic release and continued efforts possible. Getting to that point wasn’t easy, and it took lots of dedicated people. According to Donna Wieting, NOAA Fisheries Office of Protected Resources (OPR) Director, learning how to breed white abalone in captivity took years, and involved a consortium of more than a dozen partners from both the public and private sectors, most notably the University of California Davis Bodega Marine Laboratory. “We’ve been able to work not only with academic institutions, laboratories, and aquaria but also our com-
mercial aquaculture facilities, to help raise these animals in labs,” Wieting said. “We hadn’t been very good at it until the last few years, when there’s really been a concentrated effort. Now we’re able to spawn thousands more than we used to.” The white abalone story is just one of many to tell about the work of the OPR, which is responsible for conserving, protecting and recovering 165 species listed as threatened or endangered under the Endangered Species Act (ESA), and protecting and managing all marine mammals under the Marine Mammal Protection Act (MMPA). The success of white abalone recovery efforts would not have been possible in such a short time without the leadership of OPR. In 2015 OPR launched an initiative, Species in the Spotlight, to focus action and public attention on nine of the most critically endangered
species – some, such as the Hawaiian monk seal or Cook Inlet beluga whale, that have captured more public attention than the white abalone, but are no more important to the marine ecosystem. “The white abalone isn’t necessarily the most charismatic endangered species,” said Wieting, “but their story is a great example of focused efforts and strong partnerships.” OPR works to protect marine species from decline and extinction, and evaluate human activities that might affect them to ensure future generations may enjoy them. Through its regulatory role, OPR works with other federal agencies, such as the U.S. Fish and Wildlife Service, the military and the Department of Energy to minimize the impact of human activities on marine wildlife and their habitat. In addition, OPR promotes the health and conservation of species: the Marine Mammal Health and Stranding Response Program, established in 1992, is an effort to closely monitor the health of marine mammals, who occupy high levels of the marine food web and are important indicators of ocean health. With more than 100 organizational partners, NOAA funds or conducts health assessment studies on wild marine
1870
President Ulysses S. Grant signs legislation to establish a national weather warning service under the Secretary of War. The Weather Service was established within the Army Signal Corps.
27
NOAA TODAY
NOAA NEWS ARCHIVE PHOTO
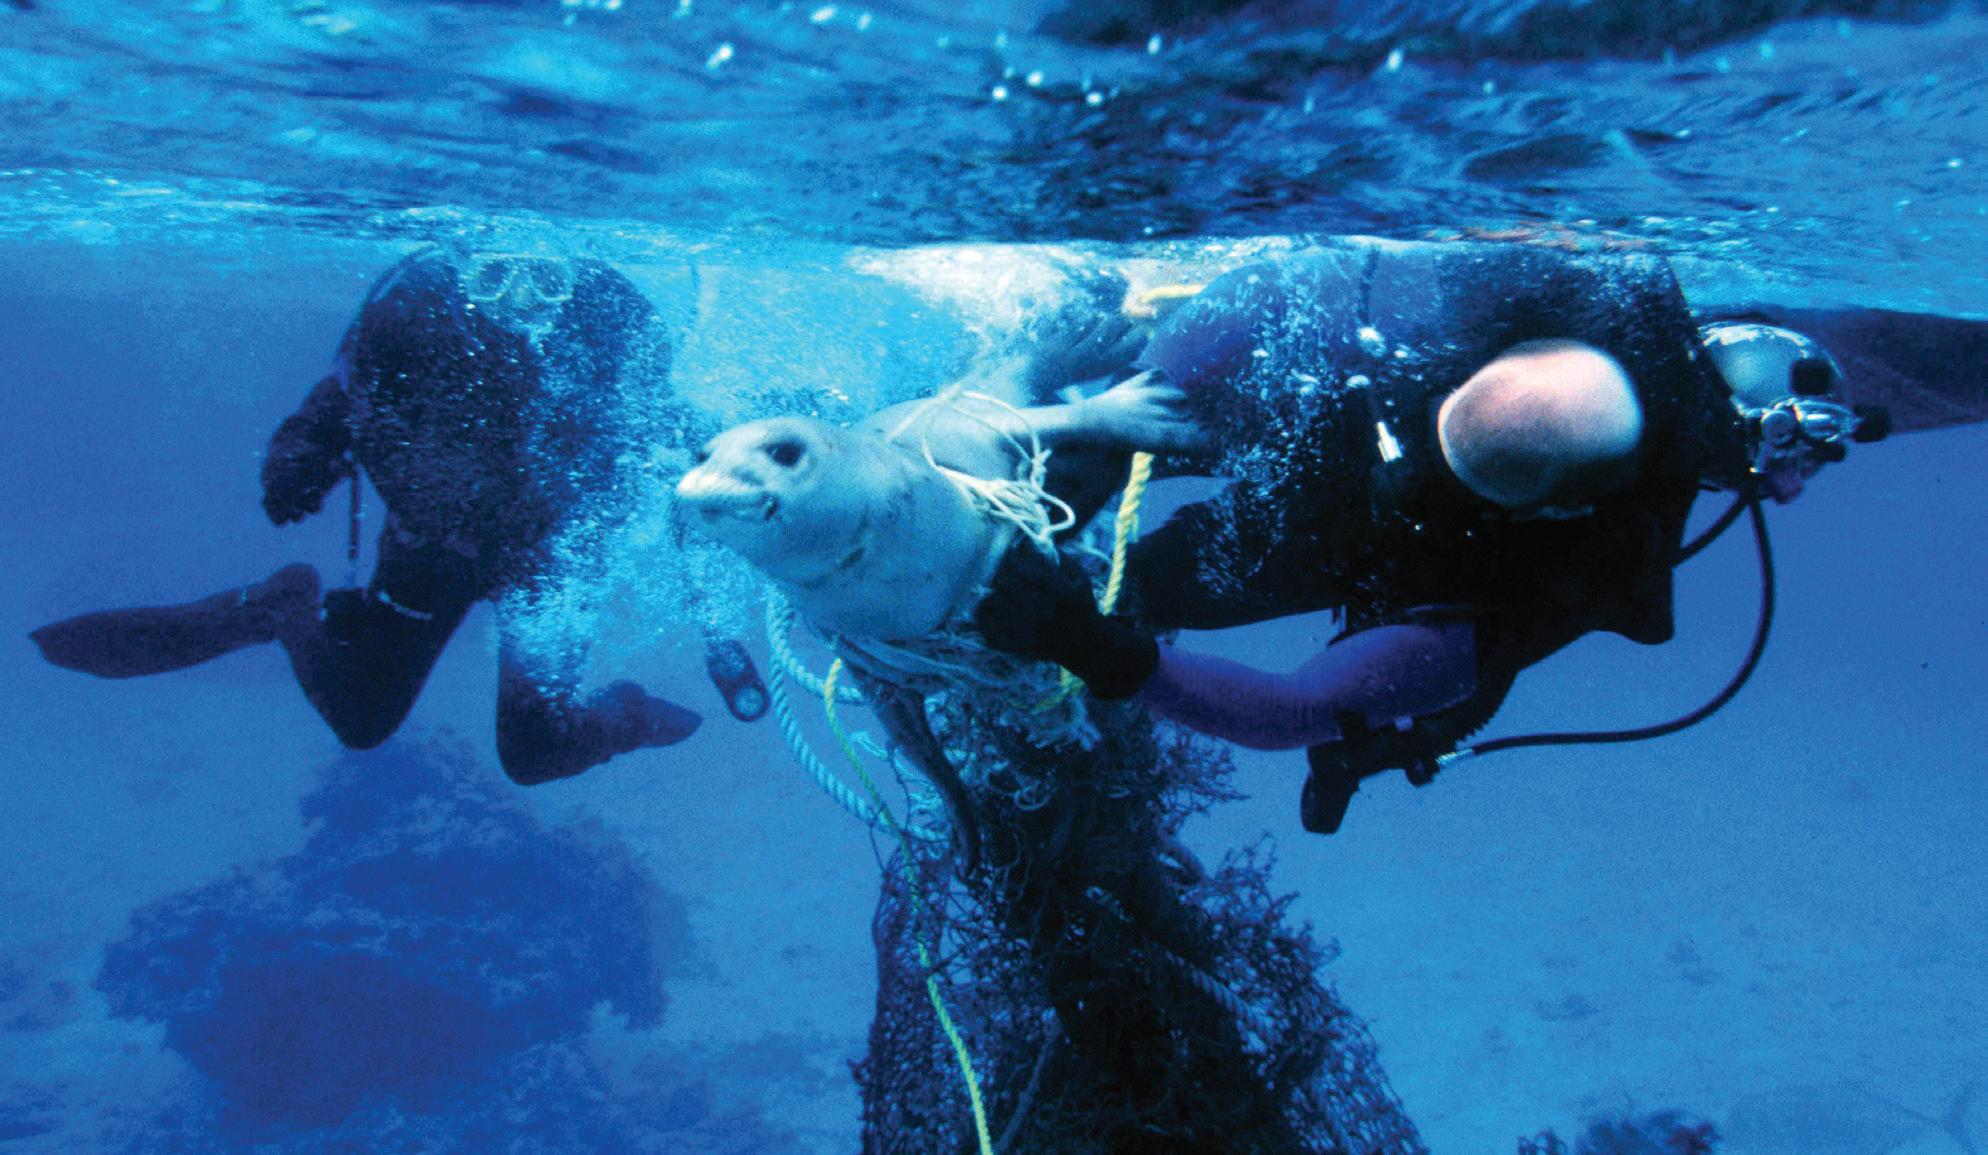
NOAA is responsible for conserving and recovering 165 endangered or threatened species. mammal populations; investigates unusual deaths (such as ship strikes that have killed critically endangered North Atlantic right whales in U.S. and Canadian waters); mounts efforts to disentangle marine mammals caught in fishing gear or marine debris; and responds to reports of live and dead stranded marine mammals to learn more about how to reduce threats to listed species. “We run the program, because it’s a Federal responsibility authorized under the Marine Mammal Protection Act,” said Wieting, “But the program is only as successful as the network of dedicated members who respond day and night to marine mammals in distress, educate the public and raise awareness of how to be good ocean stewards, and collect essential data for conservation and management efforts.” Another important aspect of OPR’s work is to raise awareness about the importance of marine species to the nation’s economy and environment – an outreach and education effort aimed at both current and future generations. For example, the office recently launched a partnership with Girl Scouts of the Nation’s Capital to develop the Endangered Species Patch program. Under the program, Girl Scouts explore the history and importance of the Endangered Species Act, connect with local organizations to learn about species needing
Scientists from NOAA Fisheries Service approaching a young North Atlantic right whale to disentangle it from fishing gear. The Marine Mammal Health and Stranding Response Program closely monitors the health of marine mammals, investigates unusual deaths, conducts entanglement response programs for mammals caught in fishing gear or marine debris, and investigates marine mammal strandings.
protecting, and get involved in local projects focusing on environmental stewardship. By June of 2020, more than 370 Girl Scouts had earned their Endangered Species Patch. It’s a small step toward wider recognition of these protected marine resources – but small steps are what enabled NOAA and its partners to put thou-
sands of new white abalone off the coast of California. “It took a long time for most of these species to get where they are,” said Wieting, “and it takes a really, really long time to get them to a point where they can be taken off the threatened or endangered list. A lot of what we’re about is inching them closer to that point.”
1871
President Grant authorizes America’s first conservation agency, the U.S. Commission of Fish and Fisheries, placed administratively under the Smithsonian Institution. President Grant also authorizes the Coast Survey to conduct geodetic surveys into the interior, beginning the survey of the 39th Parallel. This project, the Transcontinental Arc of Triangulation, tied the east coast and west coast survey networks; the beginning of the national survey network. The Army Signal Service published the first daily weather maps, a series that continues to today. The nation’s first fisheries laboratory is established at Woods Hole.
29
NOAA TODAY
Safer PORTS I
f you live in a coastal area, you’ve probably noticed: Commercial ships are bigger these days. Manufacturers and operators are squeezing as much as they can out of each shipment, and cargo ships – and even passenger cruise liners – are getting longer, wider, deeper, and taller to maximize the volume of each transit. Even small increases have a significant effect: An extra inch of draft (the distance from a vessel’s keel up to the waterline), for example, could allow a cargo ship to carry an additional 31,552 laptop computers, worth more than $21.8 million, in a single shipment. Since the 1960s, when containerized shipping became an industry standard, the capacity of cargo vessels has increased by about 1,500 percent. At the same time, Americans are more dependent on maritime commerce than ever: By far, the most common route for our nation’s trade is by sea. According to the nonprofit Bipartisan Policy Center, 99 percent of America’s overseas trade passes through ports, which are responsible for $4.6 trillion in economic activity – about one-fourth of the U.S. economy, accounting for 23.1 million jobs.
1872
Top: As container ships continue to grow in size and ports grow more congested by the year, NOAA plays an increasingly critical role in U.S. marine transportation. NOAA services and products improve the efficiency of ports and harbors, promote safety, and help to ensure the protection of coastal marine resources. Above: Center for Operational Oceanographic Products and Services staff installs an air gap sensor on the Don Holt Bridge in Charleston, South Carolina. The sensor is part of the Charleston Harbor Physical Oceanographic Real-Time System, or PORTS®. Information from the sensor is critical for under bridge clearance, as ships continue to maximize channel depths and widths while, at the same time, pushing the bounds of bridge heights.
Maritime commerce has tripled over the last 50 years, and freight traffic is expected to increase another 45 percent by 2045. A growing number of huge vessels vying for berths can create risks for navigation safety. These bigger vessels can, if they encounter obstacles (i.e., a harbor bridge that does not allow a large vessel to pass underneath at high tide), bog down and back up traffic, an inefficiency that can cost them and other operators millions of dollars. Because most ports are located at the mouths of river estuaries, which provide critical habitat for important biological resources – including nurseries and spawning grounds for 70 percent of U.S. fisheries – an accidental spill could have disastrous consequences. To reduce these risks to safety, efficiency, and ecology, NOAA’s Center for Operational Oceanographic Products and Services (CO-OPS), part of the National Ocean Service, began in 1991 to package all the relevant data about weather and oceanographic conditions in port environments and deliver it to mariners. PORTS (Physical
Publication of Monthly Weather Review begun by Army Signal Service. The first federally sponsored fish culture begins at Baird Station on McCloud River near Mt. Shasta, California.
30
NOAA PHOTOS
By Craig Collins
NOAA TODAY
Did You Know
PHOTO BY STEVE O’MALLEY, OCEAN TECH SERVICES LLC
The 34th and 35th PORTS systems were installed near Kings Bay, Georgia, and Portsmouth, New Hampshire, in 2020. Oceanographic Real-Time System), in conjunction with up-to-date nautical charts and accurate positioning, delivers mariners all the information they need about local conditions. It works like this: NOAA forms a partnership with a local community or port authority, who agrees to install an array of sensing equipment. These sensor suites are tailored to the needs of a particular port, and can collect data on things such as tides and water level, atmospheric pressure, currents, wind speed and direction, air and water temperature, waves, visibility (fog), and air gap – the height between the bottom of a bridge and the surface of water. NOAA then collects and processes this data, and develops products to provide to the general public – online, in a graphical interface available to anyone with internet access, or via a voice system that users can dial into. PORTS has become a key element of the informational infrastructure that has improved the safety and efficiency of maritime commerce – but it’s proven valuable for other users as well, including recreational boaters and fishers. PORTS data
Top: PORTS data charts for Old Port Tampa, Florida. Above: The air gap sensor installed on the Dames Point Bridge in Jacksonville, Florida.
can be used to help monitor and contain accidental spills, or to help plan and execute search and rescue operations. Since its 1991 rollout in Tampa, Florida, the system has expanded to serve about a third of the major U.S. seaports on the Pacific, Atlantic, Gulf of Mexico, and
Great Lakes coasts and waterways. NOAA has estimated that safety and efficiency improvements alone, if PORTS were expanded to serve all of the major U.S. seaports, would result in a savings of $300 million annually – within a decade saving the maritime industry more than $2.5 billion.
1873
The Commission of Fish and Fisheries utilizes the Coast Survey steamer Bache for first deep water sampling and dredging cruises. This cooperative relationship continued until the Fisheries Service obtained its own deep water steamers.
31
NOAA TODAY
Developing transformative improvements in NOAA mission performance and cost-effectiveness By Craig Collins
I
n February 2020, NOAA announced the agency’s Artificial Intelligence (AI) strategy, the culmination of years of effort, to dramatically expand the application of AI in every NOAA mission area by improving the efficiency, effectiveness, and coordination of AI development and usage. By strengthening coordination, operational capabilities, workforce proficiency, and multisector partnerships, NOAA’s national and global leadership in AI supports science, public safety, and security. AI – essentially, the replication or simulation of human intelligence in machines – is one priority in the agency’s strategy to dramatically expand the agency’s application of emerging science and technology focus areas. The other’s are: NOAA Unmanned Systems, Cloud Computing, Big Data, Citizen Science and ‘Omics. “These strategies will accelerate the implementation of the most effective science and technology applications to advance NOAA’s mission to protect life and property and grow the
1874–1878
American Blue Economy,” said retired Navy Rear Adm. Tim Gallaudet, Ph.D., assistant secretary of commerce for oceans and atmosphere and deputy NOAA administrator. “They will also guide transformative advancements in the quality and timeliness of NOAA
A mother humpback and calf.
U.S. Coast and Geodetic Survey Steamer Blake implements major innovations including the Sigsbee sounding machine and the use of steel cable for oceanographic operations; pioneers deep ocean anchoring during Gulf Stream studies.
32
NOAA PHOTO
Artificial Intelligence
science, products, and services to advance the agency’s science and technology strategies.” In 2003, when Dr. Jamese Sims joined the National Weather Service as a student intern, she was given an assignment: improve the performance of the Gulf Stream Finder, a model used to predict the location of the warm-water current that flows northward off the Atlantic Coast. “Understanding the Gulf Stream is important to our mission,” Sims said, “because we have partnerships with the Navy, and they need to know the precise locations of ocean currents. But better mapping of the current could also support some of our other line offices, as well as the work of our Ocean Prediction Center and the National Ocean Survey.”
NOAA PHOTO
HARPs are long-term acoustic recorders, deployed at a specific location, then recovered after months to years to obtain recorded data and identify the species detected by the HARP. AI allowed NOAA researchers to comb through this data and develop a model for identifying humpback whale songs that could be used to determine where the whales are in the Pacific, and how that has changed over time.
Dr. Sims – now Senior Physical Scientist and assigned to coordinate NOAA’s overall AI strategy – applied artificial intelligence (AI) to the problem: she wrote a computer algorithm that would improve the accuracy of the Gulf Stream Finder by feeding it better satellite data. Known by programmers as “genetic optimization” algorithms, these pro-
grams select data in a way that mimics natural selection: only the fittest data, producing the most accurate predictions, survive to be selected for NOAA models. Genetic optimization algorithms have been used to “tune” other models, including the WAVEWATCH model developed by NOAA’s Dr. Hendrik Tolman in the 1990s to predict sea states. WAVE-
NOAA TODAY
WATCH can now incorporate nearshore wave activity, and helps to predict dangerous rip currents. Artificial intelligence isn’t new to NOAA’s work. Teaching computers to recognize signs and patterns in data, and to make real-time decisions based on these patterns, has helped increase the impact of NOAA science for more than two decades. The National Weather Service’s first operational use of AI, in the mid1990s, was an algorithm, developed in-house, that would recognize combinations of five distinct types of satellite data (i.e., wind speed and temperature) that would produce more accurate modeling. Technical innovations in NOAA’s remote sensing capabilities – on land, in the ocean, in the air, and in space – have yielded a wealth of data that long ago surpassed the ability of human analysts to absorb and process. In recent years, NOAA scientists and their research partners – often in collaboration with academic or private-sector experts in algorithms and computing – have discovered ways to put computers to work sorting, analyzing and acting on insights derived from these data. In 2018, a research ecologist at NOAA’s Pacific Island Fisheries Science Center teamed up with Google to develop a neural network that would comb through 15 years’ worth of underwater recordings of humpback whale calls, in locations throughout the Pacific; distinguish those calls from other noises (i.e., ship engines or dolphin calls); and locate whales in time and space. Within about nine months NOAA researchers had a model that could be used to determine where
1879
Coast and Geodetic Survey creates the first official datum of the United States, the New England Datum. Congress creates the seven-member Mississippi River Commission, including a member from the USC&GS, to address navigation improvements and flood control on the Mississippi River, so essential to the nation’s commerce.
33
NOAA TODAY
NOAA PHOTO BY JAMES MURNAN
Researchers Burkely Gallo and Alex Anderson-Frey present on their research, which uses machine learning techniques to help determine which forecast models are most accurate for specific weather events, at an Office of Oceanic and Atmospheric Research/National Weather Service “Shark Tank” event in February 2018. Artificial intelligence isn’t new to NOAA’s work, but the agency is aiming to expand its application of AI in all its mission areas.
humpbacks are in the Pacific, and how their locations have changed over time. In the last year, biologists with NOAA Fisheries have joined with Microsoft to develop and train in artificial intelligence that could study millions of still images and identify individual organisms – underwater images of fish species, for example, which could be used to supplement acoustic and trawl surveys; and aerial images of sea ice, to monitor threatened ice seal and polar bear populations in Alaska. The months it normally took for humans to examine these photographs was shortened to a few hours. Another Alaska team applied an algorithm to acous-
tic data collected from equipment scattered across the bottom of Cook Inlet, in order to identify the calls of endangered beluga whales and monitor how the dwindling population was using its winter habitat. Each of these examples represents a fairly basic machine learning task: using visual or auditory cues to identify objects. But in each case, the task was completed in a tiny fraction of the time it would have taken human intelligence. According to Dr. Sims, this has proved true for the thousands of images created by underwater cameras during fisheries-independent stock assessments. “In the data processing of imagery from a fishery survey,
we’ve seen a reduction in time of 98 percent,” she said. “Whereas before it would take a month or more to analyze the imagery, we’re able to do that now using artificial intelligence, and it can take only a day or so.” Such applications have enormous potential for freeing up talent and expertise within NOAA to solve big problems – and as the agency builds its own AI expertise and expands its ability to collect and process even more complex and varied data, Sims said, this impact will grow. “I believe with the use of AI we will be able to provide even better products and services than we have right now,” she said. “And we’re doing great right now.”
1882
USS Albatross – the first government research vessel built exclusively for fisheries and oceanographic research – is launched. The Bulletin of the United States Fish Commission begins, a publication which continues as The Fishery Bulletin.
35
NOAA TODAY
Saildrones in the Arctic In extreme circumstances, uncrewed systems help NOAA solve problems and fulfill its missions. By Craig Collins
1890 36
A saildrone rendezvous with the Coast Guard Cutter Healy (out of frame) in the Chukchi Sea in 2017.
same name in Alameda, California, to perform long-range data collection missions in the ocean environment. De Robertis and colleagues from NOAA’s Pacific Marine Environmental Laboratory (PMEL), Kongsberg Maritime, and Saildrone installed a newly developed low-power acoustic sensor to the saildrone’s keel, and validated that it could provide accurate estimates in the Bering Sea by comparing saildrone measurements to those of research vessels.
Acoustic surveys work by sending sonar signals into water and measuring differences in density – essentially sensing the gas-filled swim bladders of fish. In another ocean environment, De Robertis explained, this method alone would not enable scientists to differentiate individual species – but in the Arctic, where species diversity is relatively low, that’s less of a problem. For 40 years, NOAA Fisheries scientists have been sampling midwater fishes via
Cooperative Weather Observer Network established, a system that now has more than 11,000 observers nationwide.
U.S. COAST GUARD PHOTO BY PETTY OFFICER 3RD CLASS AMANDA NORCROSS
T
he writing had been on the wall for weeks, but it became official in May of 2020: Given the dangers and uncertainties posed by the global COVID-19 pandemic, NOAA Fisheries would have to cancel five of six planned research surveys in Alaska waters. In a typical year, NOAA survey vessels collect detailed information about fish stocks through a combination of acoustic and trawl surveys: identifying schools of fish in the water column with sonar, and studying the biology and growth of fish scooped up in nets. These surveys are key data sources for managing critical fish stocks and establishing fishing quotas for species – including the Alaska pollock, the world’s largest sustainable fishery, accounting for about 5 percent of the entire global fish catch and valued at more than a billion dollars a year. NOAA’s reluctance to send dozens of crew members into the Bering Sea for a ship-based survey was understandable, given the risks, and Alex De Robertis, a fisheries biologist at NOAA’s Alaska Fisheries Science Center, developed a contingency plan for gathering at least some useful data on Alaska pollock. For several years he’d been experimenting with an uncrewed surface vehicle, the Saildrone, built by a company of the
NOAA FISHERIES
IMAGE COURTESY OF SAILDRONE INC.
Top: Map of saildrone survey area. Above: Planned saildrone survey transects. The colors indicate the tracks of different saildrones.
acoustic-trawl surveys of the Bering Sea, “And we know that our catches are more than 98 percent pollock by weight,” said De Robertis. “Alaska is a great playground for this technology because it is dominated by a single species. The measurements we are making would be very difficult to interpret in a useful way in high-diversity areas like a coral reef, where you would encounter many species.” The saildrone is a remotely operated surface vehicle, about 23 feet
long, propelled by wind acting on a 15-foot-tall rigid sail. Its sensors and other equipment are powered by solar cells. It can take weather, temperature, current, and biochemical readings from air and water. “Once they’re launched, it does not take much to keep them going,” De Robertis said. “They don’t run out of fuel – they run on sunlight and wind – so they can last for a really long time. And they are very efficient.” Saildrones, like all oceangoing
NOAA TODAY
vessels, need an occasional cleanup, after parts are fouled by debris and living organisms, but they can operate for months, traveling a programmed route that can be adjusted or changed by remote operators. De Robertis, anticipating the cancellation of the Alaska fisheries surveys, began discussions with colleagues at NOAA Fisheries and Saildrone in March to see if the systems could help gather data on the pollock fishery. PMEL joined the project, to make oceanographic and meteorological data available for weather prediction in the Bering Sea region. A little more than a week after signing a contract with NOAA, Saildrone launched three vehicles from its headquarters on Alameda Island in mid-May. About six weeks later, in early July, the saildrones completed their 2,000-mile transit to the Bering Sea and began sounding for pollock. While the unmanned survey will offer useful data to fisheries managers in 2020, De Robertis cautions that this does not replace the capabilities of a shipboard crew of fisheries scientists. Trawl samples allow for a fuller picture of a fish population. “We can definitively tell their species, size, and age from trawl samples,” said De Robertis. “And we can make physiological measurements, much like the tests you get at a doctor’s office, to understand how the fish are doing.” No sensors can replace that capability, but De Robertis sees a future in which uncrewed surface vessels can complement these seasonal surveys – particularly in the high Arctic, where accessibility is limited and there are, as yet, no ports deep enough to accommodate NOAA survey vessels.
1891
Congress transfers Weather Service from Army Signal Corps to Department of Agriculture; the United States Weather Bureau, a civilian weather service, begins.
37
NOAA TODAY
Precision Marine Navigation Smart solutions for mariners, in port and at sea By Craig Collins
W
hen NOAA’s Office of Coast Survey announced it would phase out production of paper nautical charts in De-
1893
cember 2019, it was a bittersweet announcement. Established by President Thomas Jefferson in 1807 and known variously over the years as the Survey of the Coast, U.S. Coast
U.S. Fish Commission becomes responsible for northern fur seal research.
38
1898
Survey, U.S. Coast and Geodetic Survey, and, since 1970, as NOAA’s Office of Coast Survey, it has been providing nautical charts to the nation for 212 years. The charts were icons of coastal America and NOAA’s oldest mission: to survey and map the nation’s coasts for mariners. Paper charts are no longer particularly useful, despite their handcrafted beauty: the U.S. Coast Survey was only a few decades old when its hydrographic surveyors realized the seafloor was not a static environment. Underwater topography – bathymetry – changes constantly in response to natural and human-related activity; with the movement or deposition of shoals, rocks, wrecks and other objects.
Weather Bureau begins regular kite observations for studying upper-air; last kite observations made in 1933. Weather Bureau begins hurricane warning network.
NOAA PHOTO
NOAA nautical charts, such as this chart of Tampa Bay, Florida, have been important tools to help mariners navigate safely at sea. A nautical chart is a graphical portrayal of the marine environment, showing the nature and form of the coast, the depths of the water, character and configuration of the sea bottom, locations of hazards and dangers, the rise and fall of the tides, ocean currents, magnetic variation, regulatory boundaries, and the locations of aids to navigation (e.g., lights, buoys, beacons and other important landmarks). But they are being superseded by more accurate and efficient Electronic Nautical Charts (ENC).
NOAA PHOTO
NOAA PHOTO
Top: Cartographer Julio Castillo reviews controlling depths in the Canaveral Barge Canal in Florida on ENC US5FL82M. Above: NOAA’s Precision Navigation Data Gateway for users to discover, visualize, and disseminate NOAA marine products and services.
NOAA TODAY
Paper charts (or “raster charts” as they’re called when displayed on a monitor) can’t account for these changes – and yet the Coast Survey’s nautical charts support the transit of 1.3 billion metric tons of cargo, valued at $1.8 trillion, that enters and leaves U.S. ports every year. The Office of Coast Survey maintains charts covering 95,000 miles of shoreline and 3.6 million square nautical miles within U.S. coastal waters and its Exclusive Economic Zone. In the 1990s, NOAA hydrographers began to introduce a new chart platform, the electronic navigational chart (ENC), that integrated important information into the bathymetric display: a ship’s position, speed and draft (the distance from the waterline to a vessel’s keel), for example, along with GPS and weather data. ENCs are rapidly becoming the worldwide standard for navigation – “smart” charts with the ability to detect hazards, estimate how long it would take to encounter them, and automatically sound an alarm. But according to Rear Admiral Shepard Smith, Director of the Coast Survey, ENCs have room to improve: They’re still limited by the amount of hydrographic information contained in paper charts. “About five years ago we broke that linkage,” Smith said, “and started to develop ENCs that contained richer information, and became the primary version of the chart in that area.” Many coastal areas, he said, required a greater level of detail: “The Intracoastal Waterway needed more information in order to be able to show the shoals within those narrow waterways. We needed larger scale coverage in Western Alaska, in order to support the
1900
Although local Weather Bureau alerts as many persons as possible, the Galveston Hurricane, the greatest single natural disaster to affect the United States or its territories, kills over 6,000.
39
DON RAMEY LOGSN VIA WIKIMEDIA COMMONS
NOAA GRAPHIC
community resupply requirements.” The ENC transformation initiative will deliver high-resolution gridded bathymetric maps that will overlap and display seamlessly, scrolling along at scale as mariners traverse the coasts. The ability to provide highresolution bathymetry has significant implications for the capacities of cargo and tanker vehicles, Smith said: an extra foot of draft allows an oil tanker to carry up to 40,000 additional barrels into port. In the Port of Long Beach, California – where tankers often require some offshore offloading, or lightering, before safely berthing – this has been a crucial hindrance. The Office of Coast Survey piloted a new initiative, the Precision Marine Navigation program, that became operational in Long Beach in 2017. “We can show the slumping on the side of the channel, or the shoaling in some particular areas, at a level of detail that allows for precise navigation of shipping to be able to maximize their draft while not incurring any additional risk,” Smith said. “This has billions of dollars of importance for the capacity of our ports.” The Precision Marine Navigation program repackages NOAA’s marine navigation data into formats usable by navigation systems. These data include high-resolution bathymetry and environmental data with positioning, shoreline and weather forecast data, and will include real-time oceanographic and meteorological datasets. This more complete data package enables deep-draft vessels to navigate from the outer reaches of the harbor to the pier where they
NOAA TODAY
Above: The Port of Long Beach. The Precision Marine Navigation Program at Long Beach has allowed ships to maximize their drafts without incurring additional risk entering the port.
will tie up more safely and efficiently. After implementing the program in Long Beach, vessels expanded their usable draft from 65 to 69 feet – enabling tankers, for example, to stop offshore lightering and bring in up to 160,000 more barrels of product into port per ship. The Long Beach case study demonstrated the benefits
of integrating NOAA’s datasets and provided the catalyst for more widespread implementation of the Precision Marine Navigation program. “Other projects are in active development,” said Smith. “The potential for these next-generation navigation services is really enormous.”
1901
National Bureau of Standards (now the National Institute of Standards and Technology) established from U.S. Coast and Geodetic Survey Office of Weights and Measures.
41
NOAA TODAY
Weather Aloft NOAA’s Aviation Weather Center By Craig Collins
Y
ou take your seat, buckle up, listen to the cabin crew, and sit back as your flight prepares for liftoff. If you are like many of us, you leave your hopes for a smooth, enjoyable flight to the capable hands of the pilot and co-pilot and hope they can avoid turbulence and storms on your way to paradise. Airlines work very hard to avoid weather-related hazards before and during flights, and it’s a team effort to get passengers to their
1903
destinations as weather-problemfree as possible. Many deserve credit for this: The Federal Aviation Administration (FAA) developed and deployed the Terminal Doppler Weather Radar network, which can help detect hazards such as wind shear (sudden shifts in wind speed or direction), precipitation, and winds and temperatures at certain altitudes (“winds aloft”). The National Center for Atmospheric Research and NOAA’s Earth System
Commission of Fish & Fisheries transferred to Bureau of Fisheries in Commerce and Labor Depts. Coast and Geodetic Survey transferred from Treasury Dept. to Commerce and Labor Depts.
42
Research Laboratory developed better models to monitor and predict adverse weather conditions at different elevations. New generations of NOAA’s Geostationary Operational Environmental Satellites (GOES) yielded increasingly detailed images of emerging conditions that might present aviation hazards: icing, turbulence, or thunderstorms. According to a U.S. government study, weather-related aviation accidents decreased by 70 percent from 1982 through 2013. At the center of all this activity has been the Aviation Weather Center (AWC), one of the National Weather Service’s (NWS) National Centers for
1909
Weather Bureau begins balloon observations.
NOAA IMAGE
In 2016, the Aviation Weather Center (AWC) combined many of its weather information products and services into Graphical Forecasts for Aviation (GFA), available online at aviationweather.gov/gfa.
NOAA IMAGE
Environmental Prediction. Located in Kansas City, Missouri, the AWC provides global weather forecasts and warnings for the NWS, the FAA, industry, and aviators around the world. AWC forecasts are tailored for both commercial and private aviators operating anywhere in the continental United States and in areas that extend out from its coasts: over the Gulf of Mexico and the Caribbean Sea, and to the middle of the Atlantic and Pacific Oceans. In collaboration with international partners and commercial and private aviators, the AWC develops a worldwide database of basic weather data, such as current weather conditions; observations, watches, and warnings; wind direction and speed for multiple layers aloft; and potential aviation hazards such as icing, turbulence, thunderstorm activity, wind shear, and fog or low clouds that could obscure terrain. In 2016, after a collaborative effort to capitalize on technological improvements and new data fusion algorithms, the AWC combined many of its weather information products and services – some of which were still published as text – into Graphical Forecasts for Aviation (GFA). This information is available at AviationWeather.gov/gfa. GFA provides all data critical for aviation safety in a digital graphical format: a map that users can scale and customize as needed, providing a three-dimensional forecast divided into horizontal and vertical segments. In 2019, GFA coverage expanded to include the Gulf of Mexico and the Caribbean Sea, and an expansion over the entire Pacific Ocean became operational on July 30, 2020.
NOAA TODAY
A Graphical Forecast for Aviation image shows blocks of turbulent or dangerous airspace shaded in red, such as tropical storms (TS).
The AWC offers several complementary tools to help aviators visualize and integrate this information: The Flight Path Tool, for example, is a comprehensive geographic display that runs as a desktop application, overlaying multiple fields of interest and allowing users to slice threedimensional data horizontally and vertically along a flight path. The tool offers an animated look at how conditions may change over the course of a flight. The Helicopter Emergency Medical Services tool is designed specifically to show weather conditions for shortdistance and low-altitude flights common to the emergency medical services.
At the Center’s Aviation Weather Testbed, a collaborative team of developers continues to refine, streamline, and update these tools – validating new and better models, implementing data, and improving not only forecasting methods but also data visualization techniques that can communicate its multi-layered aviation weather data as simply and effectively as possible. As commercial aviation continues to grow (4.5 billion people took to the skies in 2019, nearly double the number of passengers a decade earlier), AWC and its partners work to further decrease weather-related aviation hazards – to ensure that more so than ever, the most dangerous part of any flight is the drive to the airport.
1911
North Pacific Fur Seal Convention, the first international treaty to protect wildlife, places a five-year moratorium on harvesting Alaskan fur seals. This legislation was a model for protecting marine and terrestrial species.
43
NOAA TODAY
The Coral Reef Conservation Program An all-hands approach to conserving, protecting, and restoring coral reefs By Craig Collins
1912
Two divers work together to replant staghorn coral to a reef.
outplant coral nurseries throughout the sanctuary’s 255 continuous miles. According to Jennifer Koss, who directs NOAA’s Coral Reef Conservation Program (CRCP), the historic restoration effort is “very much meant to be a public-private partnership initiative, with NOAA having created the blueprint of what is to happen, sketching out the number and diversity of species in each place,
First Fire Weather Forecast issued; fire weather service formally inaugurated in 1926.
44
1915
how they are to be planted, and how it’s phased out over a few years. It’s really meant to be a first pilot of largescale ecosystem restoration.” Corals are marine invertebrates that live in symbiosis with a species of algae. The reefs, which form over time when their larvae attach to submerged rocks or other hard surfaces, are among the most beautiful ecosystems on earth. They are treasured for their
First radio broadcast of a weather forecast from Illiopolis, Illinois.
PHOTO BY A. NEUFELD/CORAL RESTORATION FOUNDATION
I
t’s North America’s only barrier reef: Florida’s Coral Reef, about six miles off the coast. In waters from 15 to 30 feet deep, it traces the outline of south Florida in an arc from the St. Lucie Inlet in Martin County, through the Florida Keys to the Dry Tortugas, more than 60 miles past Key West. The Florida Keys National Marine Sanctuary comprises 255 continuous miles of this reef, and is the number one dive destination in the world, hosting millions of divers and snorkelers annually. But the corals in the Keys are suffering. “If you’d been diving in the Florida Keys in the 1980s, and were to go back and dive there today,” said John Armor, director of NOAA’s Office of National Marine Sanctuaries, “you’d probably cry. Some parts of the Keys have been devastated by coral disease or ship groundings. But because we have a sanctuary there, we have an opportunity to turn that around. We’re working hard on a project we call Mission: Iconic Reefs.” Mission: Iconic Reefs is an effort to use everything NOAA and its partners know about coral restoration to
NOAA TODAY
Did You Know
NOAA PHOTO BY NOAA CCMA BIOGEOGRAPHY TEAM
A reef off of St. Croix, U.S. Virgin Islands.
rich color and unusual shapes. They’re also nurseries for incredibly valuable marine species and resources. The European Commission’s Economics of Ecosystems and Biodiversity (TEEB) study estimated in 2009 that the world’s coral reefs have an average annual value – in food, raw materials, storm protection, waste treatment, recreation, and maintaining the genetic diversity of marine life – of $172 billion. Like the Florida Keys, many coral reef ecosystems have been weakened or damaged over the past few decades by unsustainable fishing, climate change, pollution, and other stresses. The CRCP was created by Congress in 2000 to study and address these threats in collaboration with academic, state, territorial, federal, and international partners. The CRCP combines the expertise of several NOAA line offices. “We have incredible expertise in NOAA,” said Koss, “for both science and the development of management tools to aid our state and territorial partners.”
The first element of CRCP’s approach to conservation is to study and monitor corals: conducting observational surveys; collecting data at nearly 1,600 sites; and making that data available to partners through its Coral Reef Information System. The program also works directly to conserve coral reef ecosystems: first, by building the capacities of coastal managers to be stewards of their own corals; and second, by seeking to reduce, if not eliminate, the sources of local threats. “We focus a lot on landbased activities,” Koss said – such as agriculture, which can dump harmful runoff into shallow-water ecosystems. “We partnered with the USDA to work with coffee growers in Puerto Rico, for example, to transition from sungrown to shade-grown, which retains more soil and actually improves the quality of the coffee beans. That was one of our big successes.” Restoration is the final key focus of the CRCP’s conservation strategy. Corals grow slowly and, Koss said, the
The CRCP funds and equips conservation activities in American Samoa, Florida, Guam, Hawaii, the Northern Mariana Islands, Puerto Rico, and the U.S. Virgin Islands, and internationally, in areas including the Coral Triangle, Micronesia, the South Pacific, and the wider Caribbean. reduction of local threats sometimes isn’t enough. “Some coral reefs have really been beaten up, past the point of natural recovery,” she said. “So we help coordinate targeted restoration interventions to put structure back out on the reefs, and corals back out on the reef. We think that’s a quicker way to get to coral recovery, which allows us to buy coral some time to adapt to the new norm of ocean conditions.” Coral restoration is a relatively new field, and program partners are learning as they go, with input from
1917
U.S. enters WWI. Commissioned Officers Corps, now known as NOAA Corps, created from field corps of the Coast and Geodetic Survey; half of commissioned officers transferred to armed services; ships Surveyor, Bache and Albatross transferred to Navy. Personnel from Weather Service serve as meteorologists.
45
NOAA IMAGE
scientists at NOAA’s Experimental Reef Laboratory in Miami, Florida, and other research institutions. Many of the slower-growing corals can be grown in these laboratories and then outplanted and tended by “gardeners” – which is part of the historic effort now under way in Florida Keys National Marine Sanctuary. One of the things NOAA and its many partners hope to learn is how to rear and outplant corals in a way that increases the genetic diversity of species. Currently, the simplest
way to propagate corals is to use fragments of existing corals – which Koss said is a risky strategy, because it assigns a single genotype the burden of propagating the entire species. A more genetically diverse ecosystem is likely to be much more resilient to ocean stressors. Fortunately there’s an international non-profit focused on solving this very problem: SECORE International, Inc. (SExual COral REstoration), which is developing methods of captive sexual reproduction to recreate reef
NOAA TODAY
spawning events and facilitate natural recovery. It will be a while before the results in the Florida Keys are known – but there are more people involved in this effort than ever before. “I think NOAA was very instrumental, in the early days, of understanding how to physically restore corals, and now that expertise is everywhere,” Koss said. “It’s state agencies. It’s nonprofits. It’s academia. It’s zoos and aquariums. Everybody is pulling their expertise together to make a difference.”
In the United States, 22 species of coral are now listed as threatened under the Endangered Species Act.
1918
Weather Bureau begins issuing bulletins and forecasts for domestic military flights and new air mail routes.
47
NOAA TODAY
The NOAA Diving Program
1923–24
for either the National Marine Fisheries Service (NOAA Fisheries) or the National Ocean Service (NOS). Mostly NOAA divers help to conserve and manage coastal and marine ecosystems and resources, though they do much more, from installing mooring sites in National Marine Sanctuaries to maintaining ships, sensors or buoys. “NOAA diver” isn’t a job title; it’s a designation for anyone certified, through NOAA’s Diving Program (NDP), to perform these and other underwater tasks in the course of fulfilling the NOAA mission. Some NOAA divers are civilian employees; some are commissioned NOAA Corps officers; and some are private contractors. The NDP is administered by NOAA’s Office of Marine and Aviation Operations (OMAO). The NDP provides guidelines, standardized equipment, training and certification for 330 NOAA divers – the largest diving corps of any civilian federal agency. The NDP currently consists of 51 units, located primarily at Fisheries Science Centers, National Marine Sanctuaries, NOS research installations,
Top: NOAA Diver students and a NOAA Diving Center (NDC) instructor prepare to descend into the NDC training tank to complete a check out dive. Above: Curious dolphins enter the area within a diver’s reef visual census survey in St. Croix, U.S. Virgin Islands.
Coast and Geodetic Survey begins use of acoustic sounding systems; develops radio acoustic ranging, the first marine navigation system not relying on visual means for position determination. This system led to discovery of the deep sound channel, the SOFAR channel, invention of telemetering radio sonobuoys, and development of marine seismic techniques. Creation of the Pacific Halibut Commission to conserve that species.
48
NOAA PHOTO BY GREG MCFALL
O
n the website of NOAA’s Marine Debris Program, a video from 2014 shows two NOAA divers, somewhere in the Papahānaumokuākea Marine National Monument in Hawaii, patiently free a young green sea turtle hopelessly tangled in an abandoned fishing net. The one-minute clip has a happy ending: the liberated turtle swims away into the turquoise waters. The divers belonged to a team of 17, sent to remove marine debris from the World Heritage Site. The dive team, in the course of removing 57 tons of derelict nets and plastic litter from the World Heritage Site, found and freed three turtles. When you work in the ocean, as many NOAA people do, sometimes you need to dive. You may need to dive a lot, actually – over the past five years, NOAA divers have averaged about 12,000 dives a year. The vast majority of these are scientific dives in support of NOAA’s mission of science, service and stewardship; while NOAA dives are conducted for each of the agency’s six line offices, most are performed
NOAA PHOTO BY GREG MCFALL
By Craig Collins
NOAA TODAY
NOAA IMAGE
NOAA PHOTO
Left: Cmdr. Eric Johnson conducting a dive in Hawaii during his time aboard NOAA Ship Hi’ialakai. Above: NOAA Diver Shay Viehman (left) and her National Park Service (NPS) colleague Lee Richter aboard an NPS vessel during National Coral Reef Monitoring Program surveys in the U.S. Virgin Islands.
OMAO facilities and aboard NOAA research vessels. The program’s training hub and administrative headquarters are at the NOAA Diving Center (NDC) in Seattle, Washington, where instructors train and certify scientists, NOAA Corps officers, engineers and technicians to carry out NOAA diving operations. NDC provides year-round training opportunities to these and other federal, state and local government employees whose jobs require them to dive. These instructors also travel to NOAA diving units around the country to offer individualized training. In the winter, when Seattle weather and temperatures aren’t diver-friendly, NDC offers various courses in Florida.
The program has a diving medicine component dedicated to training and preparing divers, dive masters, and field medical personnel to become first responders in case of barotrauma events or other emergencies. Courses for diving medical technicians and physicians are also offered at the Diving Center. To increase the scope and impact of their work, NOAA divers often work with partners from other agencies, research institutions or private foundations (i.e., the University of Hawaii, the American Academy of Underwater Sciences; the Alaska Department of Fish and Game). Only partners who have “reciprocity” agreements in place can send “reciprocity divers” to work with NOAA divers. These reciprocity agreements, managed by the
Diving Program, assure all divers are following NOAA diving safety standards and procedures and are properly equipped. From the pristine waters of a protected marine area to murky, congested coastal harbors, NOAA divers work in a variety of conditions to meet a variety of missions: keeping coastal communities safe, keeping shipping lines navigable, maintaining the health of fisheries; monitoring and restoring coral reefs; and installing buoys that help recreational divers find their way within our National Marine Sanctuaries. Any underwater effort that requires NOAA expertise is likely performed by NOAA divers, working under the guidance and supervision of the NOAA Diving Program.
1926
Air Commerce Act directs Coast and Geodetic Survey to begin charting the nation’s airways and directs the Weather Bureau to provide weather support to civilian aviation.
49
NOAA TODAY
The Other Wild Blue Yonder NOAA explorers probe the mysterious ocean deep. By Craig Collins
W
e know more about the surfaces of Mars and the moon than we do about the deep ocean: NOAA estimates that more than 80 percent of the world’s ocean is unmapped, unobserved and unexplored. The NOAA Office of Ocean Exploration and Research (OER) seeks to reveal the secrets of this unfathomed undersea world. In July of 2017, a team of explorers from NOAA and the Smithsonian National Museum of Natural History sent a remotely operated vehicle from NOAA Ship Okeanos Explorer into a seascape so bizarre they called it the “Forest of the Weird”: colorful, odd-looking sponges, all protruding on stalks from the seamount and facing the current to catch the ocean’s microscopic food particles. One of these was a species never seen before: a bulbous sponge on a long, slender stalk that resembled the alien from the film E.T the ExtraTerrestrial.
1928 50
Three years later, the “E.T. sponge,” a new genus and species, received its scientific name: Advhena magnifica, Latin for “magnificent alien.” The discovery of a new genus of organisms doesn’t happen very often, but it was just one of the extraordinary discoveries recently made by NOAA explorers and their partners. In the past few years alone, OER conducted, participated in, or supported deep-sea expeditions that explored the mysterious deep “blue holes” off the Florida coast; found the wooden remnants of a prehistoric civilization off the Texas coast; explored in detail for the first time a hydrothermal vent system in Arctic waters; used ROVs and uncrewed underwater vehicles (UUVs) to explore sunken World War II wrecks around Alaska’s Kiska Island; collected environmental DNA samples from deepwater ecosystems in the northwestern Gulf of Mexico, unlocked the secrets of a 60,000-year-old submerged forest
which may yield new compounds for medicines – and much, much more. “We are the only organization across all of government who has the mission to explore the ocean,” said Dr. Alan Leonardi, OER’s director, “to go to places in our world’s ocean that nobody has ever been to, and document what we see for the benefit of humanity.” At NOAA’s founding in 1970, ocean exploration was envisioned as one of its core missions, but it remained a small part of its activities until a formal program was established in 2001. This program was mostly a funding mechanism for other expeditions until 2008, when NOAA acquired Okeanos Explorer; its first dedicated exploration vessel, a repurposed U.S. Navy ship. Today OER conducts its own at-sea operations aboard the Okeanos Explorer and supports similar expeditions – either directly or through a competitive grant program – by partners in the public and private sector. OER’s mission
Teletype replaces telegraph and telephone as the primary method for communicating weather information.
IMAGE COURTESY OF NOAA OKEANOS EXPLORER PROGRAM, INDEX-SATAL 2010.
NOAA TODAY
Did You Know
NOAA PHOTO
Okeanos Explorer mapped 1.9 million square kilometers of ocean floor.
Opposite page: A beautiful jellyfish of the order limnomedusae captured in a photo taken by Okeanos Explorer. Top: A spectacular photo of the NOAA Ship Okeanos Explorer control room while ROV operations are underway. Above: A unique down-looking view of an ROV deployment at night from NOAA Ship Okeanos Explorer. The underwater glow is created by the powerful lights on the Seirios camera sled.
1930
First federal fisheries law enforcement unit established under Bureau of Fisheries.
is to gather data and information about unknown or lesser-known areas of the ocean deep and to make this knowledge available to anyone who might want to conduct a more detailed documentation of these areas – oceanographers, marine biologists, policymakers or private entities, such as energy or resource companies. For example, NOAA often works with the U.S. Geological Survey (USGS) and Bureau of Ocean Energy Management (BOEM) to create high-resolution maps and biological profiles of the Atlantic continental shelf. “We do it for exploratory reasons,” said Leonardi. “BOEM does it because they need to know what habitats exist in these areas that might be suitable for offshore energy leasing and siting decisions, which they have a mission responsibility to handle. And USGS is involved because they have labor and talented staff who know how to make sense of some of the information, in particular the geology.” OER often partners with philanthropic organizations that sponsor ocean exploration, such as the Ocean Exploration Trust, the Schmidt Ocean Institute, and OceanX. In the spring of 2020, NOAA partnered with Caladan Oceanic, a private exploration company founded by financier Victor
1931
International Whaling Commission created to conserve and regulate whale harvests.
51
NOAA TODAY
NOAA OFFICE OF EXPLORATION AND RESEARCH PHOTO
NOAA PHOTO
Vescovo, in an expedition to explore, characterize and map unknown areas of the deepest, darkest and coldest regions of the ocean, below depths of 3.7 miles. NOAA’s general mode of operating involves first-order reconnaissance of the ocean bottom and the water column with multibeam sonar. This initial scan yields environmental information that informs where a team should deploy a robotic vehicle to visually survey an area and collect data on temperature, salinity, chemosynthesis, dissolved oxygen, and other information that can be gathered without sampling. If biological or geological sampling is called for, it’s done with special remotely operated instruments. The live video feed of these expeditions is often collected and archived or streamed, live, to the public via onboard satellite relays. This ability to stream live, via satellite, is incredibly useful, Leonardi
1934
Top: The NOAA ship Okeanos Explorer. Above: “E.T.” sponges, a previously unknown species discovered by the crewmembers of Okeanos Explorer.
said, because the regions NOAA explores are often so unfamiliar that teams don’t know what kind of expertise might be necessary. Scientists from all over the world, gathered in their own labs or sitting alone at their own desks at home, can see what’s happening in real time. “We also have the ability for people to participate by calling in to the ship
directly,” he said. “Scientists can call in and actively guide dives in real time.” It’s a unique mission, said Leonardi – less like that of most government agencies; more like that of NASA: The NOAA Office of Ocean Exploration and Research exists to explore and expand our knowledge of an uncharted frontier, for the benefit of all humanity.
Weather Bureau establishes Air Mass Analysis Section, leading to objective scientific forecasting methods as opposed to empirical methods.
53
NOAA TODAY
A mariner’s best friend By Craig Collins
A
t any given moment there are thousands of American ships and recreational vessels in offshore waters or on the high seas: In a normal year, 11 million Americans travel on cruise ships, and maritime shipping accounts for $1.6
Coast Guard, New York State Department of Environmental Conservation, and Resolve Marine Group personnel work to assess the condition of the Coimbra wreck on April 30, 2019, supported by NOAA-generated automated decision support services.
1934–1937
“Dust Bowl” drought in southern plains causes severe nationwide economic damage; Coast and Geodetic Survey employs over 10,000 for surveys and field offices.
54
U.S. COAST GUARD PHOTO COURTESY OF SECTOR LONG ISLAND SOUND
The Ocean Prediction Center
trillion in economic activity. Given the number of severe storms in the past several years, it might seem surprising that weather-related accidents at sea are increasingly rare. The National Weather Service’s Ocean Prediction Center (OPC) sometimes uses the map at the top of the next page to demonstrate the effect of its work: as Florence, a Category 4 hurricane, began to bear down on the Carolina coast in September of 2018, its path toward landfall – an area of 165,000 square nautical miles, shaded in red – was completely devoid of vessel traffic. The ability of mariners to clear the area and travel to safer waters was due in part to the OPC’s ability to communicate up-to-date and trending weather and sea-state information to users at sea. One of the National Centers for Environmental Prediction, the OPC was established in 1995 – but its origins can be traced to the 1912 sinking of the cruise liner RMS Titanic in the North Atlantic Ocean, after which an international commission was formed to determine how to ensure safer ocean voyages. The NWS’s predecessor, the Weather Bureau, assumed the U.S. obligation to issue warnings and forecasts for parts of the North Pacific and Atlantic oceans. By the mid-20th century, the bureau was publishing bimonthly weather logs to help mariners make their own predictions based on past conditions in Northern Hemisphere oceans, and
NOAA IMAGE
NOAA IMAGE
Top: As Hurricane Florence was set to make landfall, OPC ensured the safety of ships at sea well in advance. Here, with hurricane warnings in effect offshore and along much of the Carolina coast on Sept. 12, 2018, the figure shows where ships have moved out to avoid hazardous conditions (red shading) and areas where vessels are anchored or at very slow speed (yellow shading). U.S. Navy ships are farther south along the Florida coast (red box). Above: A graphical forecast image of wind speeds generated by Hurricane Marco as it headed into the Gulf of Mexico.
within a couple of decades, the NWS was faxing North Atlantic forecasts to users. Today’s OPC has greatly improved on both the methods used to forecast ocean weather and the technologies used to deliver these forecasts to users. Every day, OPC’s expert weather forecasters deliver more than 150 different products – current and forecast conditions related to wind, sea state, temperature, and navigational hazards
1937
such as sea ice, freezing spray, fog, thunderstorms, large waves, and high winds – to mariners across the Atlantic and Pacific ocean basins, including Alaskan waters. In 2006, the center took its first step toward a digital marine weather service when it produced experimental significant wave-height forecasts in the form of gridded maps that include wind analyses – colorized areas displaying where an area will have winds of 15, 25, or over
First Weather Bureau balloon carries radiometeorograph, or Radiosonde, ending the era of manned aircraft soundings.
NOAA TODAY
30 knots – and wave forecasts that, with some of the stronger storms, can be higher than a three-story building. These and other products are issued by the OPC’s Ocean Forecast Branch. The OPC’s other branch, the Ocean Applications Branch, helps to enhance the effectiveness of services by developing and implementing new technologies, software, and techniques. When NASA launched its QuikScat satellite in 1999, for example, experts at the Ocean Applications Branch adapted the satellite’s radar images to help develop a tool for forecasting hurricane-force wind conditions associated with strong winter storms. More recently, in 2019, branch experts quickly created automated decision support services multiple times daily for NOAA’s Office of Response and Restoration (OR&R), supporting efforts to salvage oil from the British oil tanker Coimbra, sunk by a German U-boat in 1942 off of Shinnecock Inlet, New York. The OPC currently offers surface analyses and graphical forecasts of upper air, wind, and wave conditions looking ahead 24, 48, 72 and 96 hours; the surface analyses and forecasts with hazards can be offered out to 120 hours in advance. The center is working to expand this five-day lead time to a forecast horizon of up to 14 days, giving mariners a wider window in which to track the trending intensity of conditions and make routing decisions, avoiding maritime hazards well in advance – and perhaps finally realizing the OPC’s vision of eliminating all weather-related losses of life and property at sea.
1939
Coast and Geodetic Survey begins war mapping efforts. Bureau of Fisheries transferred from Commerce Dept. to Dept. of the Interior Fish and Wildlife Service, forerunner of NOAA Bureau of Commercial Fisheries.
55
NOAA TODAY
Reminding you: The Earth is blue. By Craig Collins
T
o many Americans, the words National Marine Sanctuary evoke images of vibrant coral reefs and teeming kelp forests – and these ecosystems feature prominently in America’s
inventory of protected undersea areas. But the National Marine Sanctuary system began with the discovery of a wreck. When the ironclad warship USS Monitor, a long-lost icon of the Civil
A diver inspects the wreck of the New Orleans at the Thunder Bay National Marine Sanctuary.
1940
Weather Bureau transferred from Agriculture Dept. to Commerce Dept.; Army and Navy establish weather centers; President Roosevelt orders Coast Guard to support ocean weather stations.
56
1942–1945
More than 1,000 civilians and over half of the commissioned officers from the Coast and Geodetic Survey enter military service, serving
NOAA PHOTO
The National Marine Sanctuaries
War, was discovered off the coast of Cape Hatteras, North Carolina, in 1973, there was no legal mechanism to ensure its protection. Congress had to invent one: the National Marine Sanctuaries Act. The system of underwater national parks that has since evolved includes 14 sanctuaries and two marine national monuments: Papahānaumokuākea, in Hawaii, and Rose Atoll in American Samoa. Altogether, these areas protect more than 600,000 square miles of ecological, historical, and cultural treasures. The latest addition to the system, designated in 2019, is the Mallows Bay-Potomac River National Marine Sanctuary, which protects and interprets more than 100 World War I-era wooden steamships. By welcoming visitors, said John Armor, director of NOAA’s Office of National Marine Sanctuaries (ONMS), the national marine sanctuaries help to stimulate ideas and discussion about conserving the nation’s submerged resources – and
NOAA TODAY
Did You Know
NOAA IMAGE
NOAA PHOTO BY MATT MACINTOSH
NOAA’s smallest sanctuary is less than one square mile; the largest is 139,797 square miles. these discussions are, since 2000, no longer limited to the saltwater realm. When the Thunder Bay National Marine Sanctuary and Underwater Preserve (TBNMS) was designated off the Lake Huron coast of Michigan, it injected new life into the port city of Alpena, on the Lower Peninsula’s northeast shore. By the 1990s, as much of Alpena’s economic base – mining, fishing, and manufacturing – had begun to erode, people started moving away.
Top: Students learn about local species and history at the Mallows Bay-Potomac River National Marine Sanctuary. Above: NOAA oversees 14 national marine sanctuaries and two marine national monuments.
as hydrographers, artillery surveyors, cartographers, Army engineers, intelligence officers, and geophysicists. Civilians produce more than 100 million maps and charts for the Allied forces. Weather Bureau is declared a war agency. More than 700 Weather Bureau members join the armed forces. Women are recruited to backfill positions, marking the first widespread professional opportunities for women in meteorology.
57
FLORIDA KEYS NATIONAL MARINE SANCTUARY PHOTO
A spotted cleaner shrimp on pink-tipped anemones at the Florida Keys National Marine Sanctuary.
But Alpena has something unique: Shipwreck Alley, a graveyard of more than 70 shipwrecks within the vicinity of Thunder Bay alone. The state of Michigan had always worked to protect and preserve these historic wrecks, but as Alpena’s economy faltered, the governor, in partnership with NOAA, redoubled efforts to designate the area a national marine sanctuary. Now more than 4,300 square miles in size, the Thunder Bay sanctuary protects one of the nation’s best-preserved and nationally significant collections of shipwrecks. Alpena, as the host city to visitors eager to learn about and explore these wrecks, has transformed into a more diverse, dynamic economy. It’s still unmistakably a manufacturing and mining town, but many downtown businesses, including tour operators who offer interpretive glass-bottom boat trips above the wrecks, directly target visitors to the sanctuary and the Great Lakes Maritime Heritage Center. In 2018, TBNMS’s visitor center, the Great Lakes Maritime Heritage Center
(GLMHC), had more than 80,000 visitors. Out-of-town visitors to the GLMHC and Alpena’s Shipwreck Tour spent more than $28 million, supporting more than 400 jobs. Nearly half of the visitors reported that either the visitor center or the shipwreck tour had a lot of influence on their decision to visit the region. Armor credits this economic turnaround to the people of Alpena, who realized the need to welcome new businesses. The sanctuary, he said, “was definitely a catalyst that helped give that community the confidence to turn around.” In addition to the often staggering economic gains associated with these protected areas (a 2019 study of the Florida Keys National Marine Sanctuary found that it contributed $4.4 billion to the state’s economy), Armor said the sanctuary system’s community partnerships yield less tangible benefits. “I really believe national marine sanctuaries bring people together to tackle the most pressing issues facing the ocean,” he said. “They have become local community venues for
NOAA TODAY
people to sit around a table, many of them stakeholders who wouldn’t otherwise talk to each other, to think about creative solutions.” Much of the ONMS’s work is devoted to conservation and monitoring efforts, and in promoting scientific inquiry – from NOAA scientists and other investigators – that will help NOAA and its partners make smart decisions about how to protect these places. Armor describes resource protection as an effort that brings together federal, state, and local officials: “To make sure we’re not focused on a single resource or a single human activity, but instead we’re looking at the place as a whole – helping to coordinate fishery conservation with oil and gas regulation, for example.” To Armor, the word “sanctuary” may be a bit of a misnomer: NOAA isn’t building invisible fences around these areas to keep people out. The more people visit the sanctuaries, he said, the more likely they’ll want to advocate for and contribute to their management and protection. The program partners with zoos, aquaria, and schools to promote the values of the national marine sanctuaries, and it actively encourages Americans to have a look for themselves with its “Get Into Your Sanctuary” campaign. “These are places where sensitive resources deserve additional protection,” Armor said, “but they’re also areas where people are living and recreating, fishing, conducting science. All kinds of things are happening. We want people to experience and to enjoy them, and our job is to make sure they enjoy them sustainably, and that they understand the responsibility they have for these national treasures in their backyards.”
1942
Joint Chiefs of Staff establish a Joint Meteorological Committee to coordinate civilian and military weather activities. Central Analysis Center, forerunner of the National Centers for Environmental Prediction, is created to prepare and distribute analyses of the upper atmosphere.
59
NOAA TODAY
Left: Civilian satellite operators work in the National Oceanic and Atmospheric Administration’s satellite operations facility Sept. 25, 2014, in Suitland, Maryland.
By Craig Collins
OAA satellites are, famously, weather satellites – but they also play a critical role in search and rescue operations throughout the world. NOAA’s geostationary (GOES) and polar orbiting satellites, along with satellites in the Global Positioning System (GPS), are integral
components of NOAA’s Search and Rescue Satellite-Aided Tracking (SARSAT) system. These satellites are on constant alert for radiobeacon distress signals sent by aviators, mariners, and users on land. When a NOAA satellite detects and gets a fix on a distress signal in the United States, it’s relayed to
Storms, Floods and Fire The remote sensing capabilities of NOAA satellites contribute to saving lives in other ways. From orbit, they provide better data for weather prediction and also enable timely and targeted preparation, planning, response, and recovery – before, during and after severe weather events. Its newest geostationary satellites, GOES East and West, scan five times faster and have four times
The United States, Canada, France, and the Soviet Union banded together in 1979 to form CospasSarsat, which now also includes 42 other nations.
1942
Navy provides 25 modified aircraft radars to Weather Bureau for ground meteorological use, marking the beginning of a weather radar system in the U.S. Navy aerologists play key support role for U.S. carrier-based Navy planes in midPacific Battle of Midway Island in June 1942, marking a turning point in the Pacific front.
60
U.S. AIR FORCE PHOTO/SENIOR AIRMAN ALEXANDER W. RIEDEL
NOAA Satellites Saving Lives N
NOAA’s Satellite Operations Facility in Suitland, Maryland, where it’s then relayed to rescue coordination centers operated either by the U.S. Air Force or the Coast Guard. NOAA also supports rescues worldwide by relaying distress signals to international SARSAT partners. Since this international network began in 1982, Cospas-Sarsat has supported more than 48,000 rescues, including more than 9,000 in the United States. NOAA’s Sarsat helped rescue 421 people in the U.S. in 2019 alone – a new record in lives saved.
NOAA IMAGES
the image resolution, and triple the number of channels, of their predecessors, enabling better storm tracking and smoke detection. Forecasts from NOAA’s National Hurricane Center are supported by imagery from GOES East, which also enables better research and emergency response. NOAA satellite data also inform the agency’s increasingly accurate flood predictions. During record spring floods over the northern Great Plains in 2019, for example, this data, along with NOAA’s decision support tools, helped local officials make lifeand property-saving decisions well
1942
Above: The Kincade fire seen from space.
in advance of the floods. Officials in Grand Forks, North Dakota, one of the hardest-hit communities, were able to close levees and begin essential flood-fighting efforts a full two weeks before flooding began. In recent years, the ability of NOAA satellites to detect and track smoke with greater accuracy than ever before has been key to firefighting efforts throughout the nation; when Northern California’s Kincade Fire threatened the towns of Healdsburg and Windsor in October and November of 2019, sophisticated
A cooperative thunderstorm research effort is begun by the Weather Bureau, military services, and the University of Chicago.
NOAA TODAY
sensors on NOAA satellites provided fine detail on fire intensity that helped support firefighters and the Federal Emergency Management Agency to more quickly respond and contain the fire in a heroic all-night firefight that prevented extensive damage to Windsor. Satellites were no less important during the 2018 fire season, when huge wildfires burned in both Northern (the Camp Fire) and Southern (the Woolsey Fire) California. Emergency responders, with accurate smoke movement forecasts fed by powerful satellite sensors and weather models, were able to move people away from danger. NOAA’s GOES satellites often detect fires before they are spotted on the ground, particularly in remote areas. In March 2018, for example, GOES East detected new hotspots in Oklahoma, part of a cluster of wildfires across the Southern plains. High temperatures and drought made these new flare-ups extremely dangerous, prone to intensifying rapidly, and NOAA notified emergency responders in Creek County, Oklahoma, of a new hot spot before they had received any 911 calls. Fire crews were dispatched to the area and found a grass fire approaching the home and farm of a woman with limited mobility. The Creek County emergency manager later noted that if the crew had not arrived when they did, the woman likely would have lost her life in the fire. While not officially adding to the “lives saved” tally for NOAA satellites, events such as this demonstrate the importance of the agency’s satellites: In helping planners to save property and lives, they make a big difference.
1944
Accurate weather forecasts of tides and winds support decision to invade Normandy on June 6th.
61
NOAA TODAY
Harmful Algal Blooms NASA EARTH OBSERVATORY IMAGE BY JOSHUA STEVENS
NOAA tools for protecting people, food, and the environment By Craig Collins
An algal bloom in Lake Erie.
I
f you’re an outsider visiting one of Washington state’s intertidal beaches on a fine spring day, you might not know what you’re looking at: dozens or even hundreds of people clad in waders, tramping about in the surf, bent in intense study of the shallows – and occasionally plunging shovels or long steel tubes into the sand. These are clam diggers. The Pacific razor clam is a delicacy so prized by Washingtonians that in normal times up to a thousand
1945
people may crowd onto a single mile of beach, each seeking their daily bag limit of 15 clams. The clam stocks for recreational digging are managed carefully by the Washington Department of Fish and Wildlife (WDFW) – and one of the biggest challenges in managing them is the frequency of harmful algal blooms (HABs) along the Washington and Oregon coasts that produce the neurotoxin domoic acid, which can build up in filter-feeding shellfish to poisonous levels. Since the toxin was
first detected on the Pacific coast in the 1990s, the state’s razor clam seasons often have been disrupted by closures. In April of 2017, WDFW decided, for the first time ever, to increase the bag limit on razor clams. Over 11 days in April and May, the state’s largest managed beach, Long Beach, was visited 77,800 times. The unprecedented decision was informed by science: the NOAAfunded Pacific Northwest HAB Forecast and Monitoring System,
Coast and Geodetic Survey seismologists provide first fallout forecast for the Trinity nuclear explosion at Alamagordo, New Mexico, by monitoring air and ground vibrations. Coast Survey adapts “Gee” aerial bombardment electronic navigation system to hydrographic surveying, beginning the era of marine electronic navigation.
62
NOAA TODAY
NOAA IMAGE
Harmful algal blooms cause about $82 million in economic losses to seafood, restaurant, and tourism industries each year. which monitors offshore and beachside ocean conditions, helped the agency to predict a future spike in algal toxins that would probably force the closing of the fishery for the remainder of the season. The diggers who flocked to the beach to take advantage of the shortened season generated $7 million in local revenue. Harmful algal blooms happen when colonies of algae, often fed by warm temperatures and nutrient runoff from land, grow out of control and produce toxins. Not all algal blooms are toxic, but even nontoxic species of algae can be harmful if they grow unchecked, consuming all the oxygen in the water and smothering fish, invertebrates, corals, or aquatic vegetation. For a number of reasons, including higher temperatures in our atmosphere, oceans, and lakes, HABs are a growing problem in every U.S. coastal and Great Lakes state. In the fall of 2019, on Florida’s Gulf Coast, a highly concentrated “red tide,” a bloom of the species Karenia brevis, produced toxins that killed millions of fish and eels, hundreds of dolphins and sea turtles, and countless birds. In fresh water – such as Florida’s Lake Okeechobee or the Great Lakes, where harmful algal blooms are frequent – different species of blue-green algae, or cyanobacteria, produce toxins that can contaminate drinking water supplies or food species. Sometimes the level of toxins
in the water is high enough that it can make people sick with respiratory or gastrointestinal symptoms when they drink or swim in it Red tides and cyanobacteria blooms are also costly. By September of 2019, the Gulf Coast red tide had already cost business owners an estimated $90 million. When Washington state was forced to shut down its razor clam harvest in 2015,
it cost the state $40 million in tourism dollars. Cyanobacterial blooms are estimated to have caused economic losses of more than $1 billion over the last several decades to coastal economies that rely on recreation, tourism, and seafood harvesting. There’s no proven way to prevent a HAB event, but NOAA works on several fronts to mitigate the threats they pose to the nation’s health, ecology, and economy. Federal law charges NOAA with advancing science and our nation’s ability to detect, assess, and predict HAB events, and it does this mostly through the programs of its National Centers for Coastal Ocean Science (NCCOS), which had developed the Algal Bloom Monitoring System to deliver real-time products for locating, monitoring, and measuring algal blooms in coastal and lake regions. The agency’s HAB forecasts help members of the public make informed decisions, such as closing fisheries or recreational areas, or closing off drinking water intakes. A community-based network of volunteers, the National Phytoplankton Monitoring Network, collects important data about species composition and distribution that enhances the nation’s ability to manage and respond to the growing threat posed by HABs. NCCOS also maintains two rapid response capabilities, the Analytical Response Team and the HAB
1946
The U.S. Weather Bureau selects Cincinnati, Ohio, and Kansas City, Missouri, for the nation’s first hydrologist-staffed River Forecast Centers (RFC). Eventually, 13 RFCs are established nationwide. Central Radio Propagation Lab in Boulder, Colorado, is established to focus on wartime experiences with radio communications.
63
NOAA TODAY
NOAA GREAT LAKES ENVIRONMENTAL RESEARCH LABORATORY
CHASE FOUNTAIN, TEXAS PARKS & WILDLIFE
NOAA IMAGE
Event Response Program, aimed at helping state and local officials make informed decisions for mitigating the impacts of HABs to wildlife, human health, and commerce. The federal law that authorizes these responsibilities also establishes a comprehensive research program: competitive grants, administered by NCCOS, supporting investigations that promise to increase our ability to understand, mitigate, and perhaps prevent HAB events – including investigations of new technologies. Some emerging technologies are already being explored by NOAA experts. In the summer of 2019, scientists at NOAA’s Great Lakes Environmental Research Laboratory (GLERL) experimented with uncrewed underwater vehicles, or gliders – torpedoshaped robots that collect water samples for analysis – in western
Top left: Public warning signs appear in areas that have been closed due to high levels of toxin in shellfish. Top: NOAA currently uses a combination of satellite imagery and water samples of the algae species Karenia brevis collected from the field by local partners to forecast the location and intensity of red tide events. The conditions reports for red tide in Florida and Texas are available to the public and give respiratory irritation forecasts by coastal region. Above: NOAA GLERL researchers Danna Palladino and Duane Gossiaux and vessel operator Kent Baker deploy an environmental sample processor (ESP) to measure water toxins in Lake Erie’s harmful algal bloom, July 17, 2019.
Lake Erie, where three gliders circulated near municipal water intake pipes throughout the season. These unmanned systems likely will become another tool in NOAA’s
arsenal for tracking and detecting HABs, giving the public fair warning of their hazards and helping to protect people, food, and water resources.
1948
USAF Air Weather Service meteorologists issue first tornado warnings. Princeton’s Institute for Advanced Studies begins use of a computer for weather forecasting, now the National Geophysical Fluid Dynamics Laboratory. Coast and Geodetic Survey establishes Pacific Tsunami Warning System.
65
NOAA TODAY
Incident Meteorologist Joel Curtis (second from left) watches the Derby Fire with some local firefighters monitoring the fire in Big Timber, Montana, September 2006.
In the Line of Fire
I
n November and December of 2019 – the height of summer in Australia, with high temperatures and dry conditions fueling more than a hundred wildfires that had already burned millions of acres and destroyed 2,000 homes – the U.S. government sent experts to help Australia in its historic firefight. Among those sent were nine skilled Incident Meteorologists (IMETs) from NOAA’s National Weather Service (NWS). These deployable specialists are
1949 66
trained to travel to the front lines of wildfires to provide critical data about the weather so decision makers can map out the safest possible tactics for firefighters. Weather is one of the most important determinants of how easily a wildfire starts, how dangerous it is, how fast it spreads, and where it goes. Though most Americans aren’t aware that the NWS plays a role in fighting wildfires, IMETs can trace their heritage back more than a century. In 1916, the U.S.
Weather Bureau established a Fire Weather Service and set up a central fire forecast center in Medford, Oregon. Today, around 80 IMETs are stationed at NWS offices throughout the country, and their operations are managed by NWS staff based at the National Interagency Fire Center in Boise, Idaho. IMETs have supported responses to a variety of incidents, including shipwrecks, hurricanes, oil spills, tornadoes, and recovery of debris from the 2003 space shuttle Columbia
Creation of Inter-American Tropical Tuna Convention to conserve transboundary stocks of tunas and other highly migratory pelagic fishes.
PHOTO BY DAN BORSUM, NOAA/NWS/WR/WFO/BILLINGS MONTANA
The National Weather Service’s Incident Meteorologists By Craig Collins
PHOTO BY J. BRENT WACHTER, NOAA/NWS/WFO/ALBUQUERQUE, NEW MEXICO NOAA PHOTO
Did You Know 90 percent of all wildfires are caused by humans. accident – but they are used primarily in responding to wildfires, and have figured significantly in the nation’s most important firefighting efforts. When lightning strikes sparked 42 fires throughout Yellowstone National Park in 1988, IMETs staffed several remote forecast operations centers in the park to support and help direct the fight. Throughout the 2017-2019 fire seasons, when some of the most destructive wildfires in Western U.S. history burned through California and other states, more than 85 IMETs served on more than 500 deployments. Typically, it’s the IMETs who live closest to an incident who are called in, though they often require backup from colleagues nationwide. They usually arrive at the scene of a wildfire within 12 to 24 hours of being requested, and are stationed with the incident command team at a base camp at or near the fire. Here they work with their federal and
1950
Top: National Weather Service IMET Brent Wachter positions a Direcway satellite dish in April 2006. Once positioned correctly, the IMET can then download much needed weather data. Smoke from the Ojo Felix Fire burning in the Sangre de Cristo Mountains of New Mexico can be seen in the background. Above: IMET Carl Cerniglia (NWS Tucson, Arizona) develops spot weather forecasts requested by firefighters for the day in January 2020. He was working alongside meteorologists at the Australian Bureau of Meteorology regional office in Sydney.
local partners to help interpret how weather may affect the fire’s behavior. IMETs provide briefings and answer questions at planning meetings, and give fire crews weather briefings that describe expected conditions and any potential hazards. Forecasting for a wildfire is distinctly different from general weather forecasting, and requires a unique set of knowledge and skills. For one
NOAA TODAY
thing, large fires can create their own weather, such as firestorms that produce dry lightning or send embers far from the site. At the scene, IMETs monitor conditions with weather balloon soundings, wireless access to NWS data, and the Bureau of Land Management’s Remote Automated Weather System (RAWS), a tool that provides crucial information such as temperature, precipitation, humidity, and wind speed and direction. At base camps, IMETs are outfitted with the same emergency equipment carried by fire crews: fire-resistant clothes, a portable fire shelter, personal protective equipment, and first aid kits. IMETs typically begin their careers as NWS meteorologists, but then undertake an intensive training regimen involving several fireweather-specific courses and onsite training experiences. By the time an IMET is certified, they will have completed at least 225 hours of training. The IMETs who deployed to Australia in late 2019 and 2020 were part of an established tradition of cooperation; the United States and Australia signed an agreement for mutual wildfire assistance in 2006, and have lent each other aid in almost every year since. A total of nine IMETs were ultimately deployed to Australia, in six-week rotations, through March of 2020. It’s a practice that’s sure to continue, and likely to expand: In the United States, the area burned each year in summertime forest fires is eight times larger than it was in the 1970s. As these hazards increase, it’s likely that the demand for IMET expertise in all-hazards response will continue to grow.
Creation of the International Commission for the Northwest Atlantic Fisheries to conserve New England fisheries.
67
NOAA TODAY
NOAA’s ‘Omics Today NOAA scientists describe the oceans by studying clues at the molecular level. By Craig Collins to: “knowing who is there, and what they’re doing, and how they’re adapting to changes or to stress.” But the ocean ecosystem is vast, complex, poorly understood, and currently under considerable stress and change – and marine biology is
quickly transforming. “In the old days,” Goodwin said, “to look at biology, you caught things and you counted them. Now, you look at their genetic code using ‘omics methods.” Biological analyses of marine ecosystems at the molecular level,
Yuan Liu (left) collects water samples for eDNA analysis in the summer of 2019, assisted by Mark Dixon (middle) and Gillian Phillips (right) at one of the aquaculture cage sites in Long Island Sound.
1952
Weather Bureau organizes Severe Local Storms Forecasting Unit in Washington, D.C., and begins issuing tornado forecasts.
68
NOAA FISHERIES PHOTO
K
elly Goodwin, a microbiologist and molecular biologist at NOAA’s Atlantic Oceanographic and Meteorological Laboratory (AOML), has a simple description for the field of marine biology. She boils it down
NOAA TODAY
Sequencing the human genome for the first time took 10 years and $3 billion. Today it can be done in days for around $1,000.00.
NOAA FISHERIES PHOTO
Yuan Liu filters water samples on the NOAA Ship Gordon Gunter during the fall Ecosystem Monitoring Survey.
particularly molecules such as DNA, RNA, proteins and metabolites, can help to describe and characterize the way genes are programmed and expressed. These kinds of studies – i.e., genomics, proteomics and others – are known collectively by their suffixes, the ‘omics sciences. These new methods offer a snapshot of organisms in a particular place, at
a particular time. When investigators want the bigger picture, ‘omics can be used to understand biological changes not only at individual scales, but also at population and ecosystem scales. To Goodwin and her AOML colleagues, the real potential for ‘omics lies not just in studying the genes of individual organisms, but in analyzing the heart of marine ecosystems: the
microbiome, where organisms such as bacteria and phytoplankton form the base of the food web and cycle oxygen and nutrients throughout. In 2016, the laboratory launched an ‘omics program to study the health of marine organisms and ecosystems through the study of their genes and proteins. ‘Omics methods are employed for many different tasks. For example, AOML scientists are studying genes in corals that might help explain why some corals are more susceptible to bleaching or disease than others. Many coral communities are in decline, and the hope is that studying all aspects – the coral animal and its associated microbes – will give the full context needed to understand why some corals get sick and others don’t. Studies use DNA, RNA, and protein analysis of samples before, during, and after coral bleaching or disease events, and researchers hope to identify the genetic traits of the most resilient corals and their microbiomes. This knowledge could help inform future coral restoration efforts. At NOAA, fisheries scientists have used genomics for decades to inform management of fish populations, and recently, scientists at the Southeast Fisheries Science Center and AOML have been working together to use DNA from the larvae of Atlantic bluefin tuna to distinguish between the eastern and western bluefin stocks
1954
Joint Numerical Weather Prediction Unit established from Weather Bureau, Navy, and Air Force; precursor to today’s National Centers for Environmental Prediction. First radar designed for meteorological use, the AN/CPS-9, is unveiled by the Air Weather Service, USAF.
69
NOAA TODAY
Did You Know
NOAA FISHERIES PHOTO
Sequencing techniques allow many types of organisms to be characterized from a single sample of seawater or sediment. and inform management decisions for one of the nation’s most valuable fisheries. In addition, NOAA investigators are using a relatively new technique to detect fish and other marine species: analyses of DNA found in a sample of water or sediment. The sampling of environmental DNA, or eDNA, is a “tissue-free” method of analysis. Goodwin says eDNA sampling allows scientists “to explore ocean habitats that are otherwise off-limits because they are too deep, too icy, too fragile, or too costly for traditional collection methods.” For example, in San Diego Bay, Goodwin and scientists from NOAA’s Southwest Fisheries Science Center found that they could use eDNA to detect the presence of endangered green sea turtles. In Southeast Alaska waters, scientists from the Alaska Fisheries Science Center’s Marine Mammal Laboratory have been able to detect genetic variation among populations of harbor porpoises, which have proved elusive to researchers looking for genetic samples.
Researchers Kyle Turner, Virginie Sonnet and Yuan Liu gather around the Niskin bottle rosette to get their portions of the seawater collected at a water sampling station during the fall 2019 Ecosystem Monitoring Survey cruise on the NOAA Ship Gordon Gunter. Tissue-free eDNA sampling allows researchers to explore ocean habitats unreachable by other means.
In many cases, uncrewed systems are being used to push past sampling limitations. Water samples collected by uncrewed underwater vehicles can be collected and analyzed on-site by environmental sample processors (ESPs), developed by the Monterey Bay Aquarium Research Institute, which can filter out genetic material and investigate biology on the molecular level in real time. ESPs can be used to identify the type and number of microorganisms and animals present in the water; monitor toxins and other biological compounds; and examine how microbes respond to climate change and seasonal variation. For example, autonomous ‘omics sampling is being used in the Great Lakes to monitor for genes of harmful algae. ‘Omics techniques such as eDNA analysis for fisheries and protected
species is a new breakthrough whose potential is still being explored. “It really is relatively recently that we’ve been able to understand and interrogate genetic sequences,” Goodwin said. Goodwin estimates that these types of studies generate huge amounts – terabytes – of genetic data, and scientists are still learning how to best apply analyses at this level. Each study requires its own set of algorithms and powerful computing capabilities, to process and make sense of terabytes of genetic data. And even then, Goodwin said, eDNA currently is best at answering the question: Who’s here? It doesn’t yet answer the equally important: How many? “When we talk about eDNA,” said Goodwin, “I think the most exciting things to talk about are the things that are on the horizon – those we can’t quite yet do right now.”
1955
Coast and Geodetic Survey Ship Pioneer conducts surveys off United States West Coast; tows magnetometer invented by Scripps Institution of Oceanography; discovers magnetic striping on the seafloor, a key element in the theory of plate tectonics.
71
NOAA’s Space Weather Prediction Center Not science fiction By Craig Collins
M
ost of the definitions for the term space buoy read as follows: a common element in science fiction that refers to a stationary object in outer space that provides navigation data or warnings. This, while true, leaves out an important fact: space buoys are real. Since 2016, NOAA’s Space Weather Prediction Center (SWPC), one of the National Weather Service’s (NWS) National Centers for Environmental Prediction, has been receiving data from its own space buoy – the Deep Space Climate Observatory, or DSCOVR – to help the agency monitor space weather. The sun cycles through periods of intense solar storm activity, periodic explosions that emit huge amounts of electromagnetic energy, sometimes forcefully enough to
1956
Dept. of Interior divides fisheries duties of Fish and Wildlife Service into Bureau of Commercial Fisheries and Bureau of Sport Fisheries and Wildlife.
72
Top: A coronal mass ejection bursting from the edge of the Sun on May 1, 2013. Above: Dave Marshall monitors space weather in NOAA’s Space Weather Forecast Office.
propel a huge cloud of ionized plasma, called a coronal mass ejection (CME). CMEs can reach Earth and disrupt the magnetic balance of our planet. Scary as it sounds, these geomagnetic disruptions rarely pose a hazard to people or other organic life, but they can do serious damage to systems on Earth and in space that rely on electronics. The largest known solar event to impact human affairs, the Carrington Event, occurred in 1859, knocking out telegraph systems from North America to Europe. In 1972, a CME
In a worst-case solar storm, $100 billion in space assets could be lost.
1956
Weather Bureau initiates a National Hurricane Research Project.
NOAA PHOTOS
NOAA TODAY
NASA GRAPHIC
disrupted telephone service across the state of Illinois. A huge solar storm in March of 1989 disrupted the polar orbits of several satellites, interrupted the communications of NOAA’s Geostationary Operational Environmental (GOES) weather satellites, caused sensor glitches in the orbiting Space Shuttle Discovery, disrupted radio and communications signals, and knocked the entire city of Montreal off its electrical grid for a nine-hour blackout. A series of solar flares in October of 2003 caused a 30hour outage in the Federal Aviation Administration’s GPS navigation support system. Our power, communications and navigation systems play a more important role in our lives than ever before, and these technologies are exceptionally vulnerable to space weather. The National Research Council estimated that if the U.S. were left unprepared, a disturbance the size of the Carrington Event would cause an immediate $1 trillion to $2 trillion in damages, and take four to 10 years to recover from. Advance warning of such an event could provide enough lead
Did You Know A 1989 solar storm knocked out power in portions of the northeast United States as well as the entire Canadian province of Quebec for up to 9 hours. time to avoid such damages – grid operators, for example, could either implement protective measures, or time a temporary shutdown to coincide with a geomagnetic storm. The Space Weather Prediction Center (SWPC), located in Boulder, Colorado, relies on several platforms, including ground-based solar and magnetic observatories and NOAA’s satellites to monitor the sun for signs of space weather: solar flares, particle events, and CMEs. GOES in particular is useful for space weather forecasting: it can detect solar flares with its onboard ultraviolet telescope, the
NOAA TODAY
Solar Ultraviolet Imager (SUVI), and measure their strength with an onboard X-ray spectrometer. SWPC issues watches, warnings and alerts – just as other NWS centers do with earthly storms – but to notify the public of space weather risks. It utilizes three categories of space weather scales to help communicate the severity of each event. The center recognizes many types of space weather disturbances, each of which carries its own set of hazards. Its space weather scales are focused on geomagnetic storms caused by CMEs and high-speed solar winds; solar radiation storms that can endanger astronauts and high altitude/high-latitude flyers; and radio blackouts caused by disturbances in the ionosphere. Within each of these categories, the severity of the event is graded on a scale from 1 to 5. SWPC utilizes GOES to determine where a solar flare occurred on the sun and how big it was, the center’s space weather experts next determine whether a CME may be headed toward Earth, and whether it may cause a radiation or geomagnetic storm at the planet. This is where the DSCOVR, the space buoy, comes in: locked in the gravitational pull of the sun and Earth, at a place scientists call Lagrange Point 1 (L1), the observatory is a million miles from the planet – a small fraction of the 93 million-mile distance, but close enough to provide a 15- to 60-minute warning before a CME, and its accompanying surge of particles and magnetic field changes, reach Earth. (Learn more about space weather and the SWPC at https://www. noaa.gov/explainers/space-weatherstorms-from-sun)
1957
International Geophysical Year provides first concerted worldwide sharing of meteorological research data. Weather Bureau supports first study to modify Navy Doppler radars for severe storm observations; the beginnings of modern Doppler weather radar.
73
NOAA TODAY
Coastal Pollution: Response and Restoration NOAA’s Center of Expertise for coastal environmental threats By Craig Collins
T
1958
Platform supply vessels battle the blazing remnants of the offshore oil rig Deepwater Horizon. NOAA experts assessed the damage, rescued wildlife, and led restoration efforts.
was led by the Coast Guard and New York State Department of Environmental Conservation, with guidance and support from NOAA’s ocean scientists at the OR&R – who provided, for example, analyses of potential spill trajectories in case any oil was released during
the operation. By July, more than 450,000 gallons, as much as 99 percent of the recoverable oil, had been removed without a major leak. NOAA, with the nation’s leading ocean scientists, is a natural leader for this kind of work. OR&R became a center of expertise in the 1970s, when
Coast and Geodetic Survey creates the first official datum of the United States, the New England Datum. Congress creates the seven-member Mississippi River Commission, including a member from the USC&GS, to address navigation improvements and flood control on the Mississippi River, so essential to the nation’s commerce.
74
U.S. COAST GUARD PHOTO
he sheen of oil was first noticed by a NOAA satellite, just off the coast of New York’s Long Island, in 2015, and seen sporadically for the next four years. NOAA had been monitoring a few dozen shipwreck sites in U.S. waters for years, and this one – where the Coimbra, a British tanker filled with 2.7 million gallons of oil, had been sunk by a German U-boat on January 15, 1942 – had increased, and was now visibly leaking onto the ocean surface. Scientists from NOAA’s Office or Response and Restoration (OR&R), after collecting and analyzing samples from this sheen, confirmed that it was bunker and lubrication oil. In May of 2019 a dive team was dispatched to assess the wreck, and the Coast Guard’s Atlantic Strike Team determined that the amount of oil remaining in eight of the Coimbra’s tanks – one of which was leaking – posed a risk to natural resources, and needed to be removed. The removal project involved more than 100 government, industry and environmental specialists. It
NOAA TODAY
U.S. COAST GUARD PHOTO COURTESY OF SECTOR LONG ISLAND SOUND
NOAA IMAGE
Did You Know 12 percent of the oil spilled by humans into the sea comes from accidental spills while oil is being transported. an oil tanker grounded off the coast of Massachusetts. Now the lead science agency for coastal spills, OR&R provides scientific and technical support to federal, state, and local authorities through all stages of a hazardous event: preparing for and responding to oil and chemical releases; assessing damage; and restoring polluted marine and coastal ecosystems. These responsibilities cover the entire spectrum of NOAA’s mission of science, service, and stewardship – and the event that probably best illustrates the fullest range of NOAA’s response and restoration capabilities is the ongoing response to the largest oil spill in U.S. history, when the Deepwater Horizon oil rig exploded in the Gulf of Mexico, killing 11 workers and, over the next 87 days, discharging 134 million gallons of oil from its damaged wellhead into the Gulf. From the earliest moments of the crisis, NOAA experts were on the scene, providing critical information to guide the emergency response. One of their first actions was to close fisheries in contaminated or threatened areas. Within a few weeks, NOAA scientists helped to build a web portal (https://response.restoration. noaa.gov/maps-and-spatial-data/
1959
Top: Graphic representation of the Coimbra wreck on April 30, 2019. The Coimbra was a supply ship owned by Great Britain when the ship was sunk off the coast of Long Island during World War II by a German U-boat. Above: Divers securely drill into and access the oil tanks of the wreck of the British-flagged tanker Coimbra, May 8, 2019.
environmental-response-management-application-erma) to provide the public with the latest information on these closures, as well as about the extent and movement of the spill, shipping lane closures, the status of wildlife, and the positions of research and response vessels. Over the next several years, OR&R scientists helped to assess damages
Weather Bureau’s first weather surveillance radar is commissioned at Miami hurricane forecast center.
to coastal ecosystems in quantifiable terms: how much oil was in the environment; where it was going; what resources, including mammals, birds, fish, and turtles, would be harmed by the oil; how long it would take those resources to recover; and which types of restoration would be needed – and how much those restoration projects would cost. The Deepwater Horizon restoration effort, with many projects still under way, remains the largest environmental restoration project in history. This battery of assessments from samples of soil, sediment, water, and living organisms revealed effects to more than 1,300 miles of shoreline – the driving distance from New Orleans to New York. The restoration projects launched from these assessments, led by NOAA scientists, include the restoration of coastal dune, beach, and marsh habitats; oyster reefs; and deep-sea coral habitats. In December of 2019 the trustees overseeing the Deepwater Horizon restoration authorized another 18 projects – enough to keep NOAA’s restoration experts busy for the foreseeable future, but a fraction of the work yet to begin, which will keep them busy through 2030 and beyond.
1960
World’s first weather satellite, TIROS I, successfully launched. Weather Bureau meteorologists issue first advisories on air pollution for the Eastern United States.
75
NOAA TODAY
Cleaner, Safer Beaches and Coasts
Lt. Cmdr. Marc Pickett and Lt. Mark Sarmek wrestle to free an entangled Hawaiian monk seal at French Frigate Shoals, Northwestern Hawaiian Islands, during a marine debris survey and removal cruise. The seal survived.
I
n January of 2017, the Ellen MacArthur Foundation, in partnership with the World Economic Forum, released a report with a jarring prediction: By 2050, plastic in the oceans will outweigh fish. Every year, 8 mil-
1961
lion tons of plastic enter the ocean, a rate equivalent to dumping the contents of one garbage truck every minute. Garbage patches of varying sizes are now circulating in each of the five rotating ocean currents, or gyres.
NOAA scientists and others are still studying how these garbage patches may impact human and animal health. In the meantime, because about 80 percent of pollution to the marine environment comes from land, NOAA’s Marine Debris
World-Wide Standardized Seismograph Network is established by the Coast and Geodetic Survey to monitor earthquakes and nuclear testing. The network played a central role in supplying data about continental drift and plate tectonics.
76
NOAA PHOTO
NOAA’s Marine Debris Program By Craig Collins
NOAA IMAGE
Program – since 2006, the federal lead for addressing the problem of marine debris – focuses on prevention and removal of plastics and other debris from shorelines and coastal areas. While the effects of marine debris on public health aren’t yet fully understood, the Marine Debris Program has begun to calculate the economic impact of the trash, lost and damaged fishing gear, and other solid and human-made materials found in our ocean and Great Lakes. In 2016, a study in the Chesapeake Bay determined that the estimated 145,000 derelict crab pots lying at the bottom of the bay were cutting into the blue crab harvest, killing approximately 3.3 million blue
1962
crabs every year. Models estimated that removing derelict crab traps could increase harvests by more than 38 million pounds over a sixyear period. A 2019 study aimed to understand impacts to the largest employer in coastal and Great Lakes economies – the tourism and recreation sector, which accounts for $124 billion of the nation’s gross domestic product. The study found that coastal communities could benefit substantially from the removal of marine debris. For example, the study found that if marine debris were eliminated on beaches in Orange County, California, the number of visits by tourists and recreational users would increase, boosting tourism spending by $187 million over the three-month summer season.
National Severe Storms Laboratory established in Norman, Oklahoma. Great Lakes Research Center established in Ann Arbor, Michigan.
NOAA TODAY
Marine debris can degrade the coastal environment, interfere with the safety of navigable waters, and injure or kill marine and coastal wildlife. Given these ecological and economic impacts, NOAA’s Marine Debris Program has adopted a multi-pronged approach to attacking the problem. According to Nancy Wallace, director of the Marine Debris Program, the program’s prevention efforts are nonregulatory, focusing on local and regional outreach and education. For example, she said, “We’ve supported partners in Virginia to encourage people to stop releasing balloons.” The program, the Joyful Send-off campaign, focuses on positive alternatives to the custom, during weddings or other celebratory events, of releasing balloons into the
1963
Weather Bureau obtains two DC-6 aircraft, forming the nucleus for the Research Flight Facility.
77
LCDR ERIC JOHNSON, NOAA CORPS
NOAA IMAGE
Above: Plastic debris littering the Hawaiian shoreline. Hawaii is located near the center of the North Pacific gyre, where debris tends to concentrate.
air. Balloons eventually come back down to Earth, often in water, where animals such as turtles, whales, seabirds, and dolphins can confuse them with prey, swallow them, become sick, and even die. Another prevention program, conducted in partnership with the University of North Carolina Wilmington, is Turtle Trash Collectors, an elementary school program in which students are able to visualize what ingesting debris does to turtles using stuffed toys. “It’s about learning that our behaviors can really impact wildlife,” said Wallace. The Marine Debris Program also works on a macro-scale, with federal and international partners, to raise awareness about the impacts of marine debris and how to prevent it, through events such as the International Marine Debris Conference. The Marine Debris Program helps to lead and support removal efforts around the country. The program has supported more than 165 removal projects that have cleared more than 17,400 metric tons of debris from U.S. coasts and waters. With its Marine Debris Monitoring and Assessment Project, the program attempts to characterize the scope of the nation’s marine debris problem and how it changes over time. The program enlists the efforts of citizen scientists around the country, who increase the reach of the program’s resources and provide a persistent presence in coastal communities, monitoring more than 400 sites in 20 states and internationally. Marine Debris Program activities are informed by a vigorous research
NOAA TODAY
Did You Know Since 2006, the NOAA Marine Debris Program has supported more than 100 marine debris removal projects across the country, removing more than 22,593 metric tons of debris from our oceans and coasts. program. “We have a few different aspects of our research program,” said Wallace. “The first is really trying to understand what the impacts of marine debris are.” The program is supporting investigations into the effects of microplastics on the growth and physiology of commercially valuable seafood species, such as black sea bass, blue crab larvae, and steelhead trout. Another research focus is on pathways – how debris ends up on beaches and in the water. “We are interested in learning more about how marine debris travels to our oceans so that we can work upstream to stop it,” Wallace said. “The information we learn from the research we support helps us identify ways to prevent marine debris, and helps to improve the environment and the economy in these areas.”
1965
Environmental Science Services Administration created, consolidating Coast and Geodetic Survey and Weather Bureau, a major precursor to today’s NOAA.
79
NOAA TODAY
Underwater Gliders
They operate for months unattended, survive hurricanes and shark attacks, and are unlocking the secrets of the deep. By Craig Collins
T
Five members of NOAA’s Ocean Glider project stand with gliders ready to be deployed into waters around Puerto Rico.
NOAA’s mission of science, service and stewardship. Gliders have been deployed throughout the last several hurricane seasons, gathering data on warm water masses that can feed and intensify passing tropical storms, as well as cooler upwellings of saltier water than can draw energy from and weaken storms. AOML research has shown that data gathered from these gliders and other platforms
are key to improving the accuracy of hurricane intensity forecasts. The gliders offer clear advantages over other data-collection platforms in terms of flexibility, safety and cost. They can traverse the open ocean for months while consuming very little energy – they are called “gliders” because, like aerial gliders, they don’t have their own propulsion systems; they are outfitted with fins that act
Ocean gliders use pumps to alter their buoyancy, allowing them to slowly move up and down through the water. As they move up or down, the gliders’ wings create lift to propel them forward.
1966
National Sea Grant Colleges and Programs Act provides for uses of marine resources, economic opportunities and for coastal and marine research. Five years later the first Sea Grant Colleges were designated – Texas A&M University, University of Rhode Island, Oregon State University, and the University of Washington.
80
NOAA PHOTO
hey headed out to sea in July 2020, in the early part of hurricane season, into the Gulf of Mexico and off the coasts of Puerto Rico and the eastern United States: 30 underwater gliders, equipped with sensors to measure temperature and salinity throughout the water column, from the surface to depths a half-mile undersea. The 2020 hurricane season deployment was a collaboration between NOAA’s Atlantic Oceanographic and Meteorological Laboratory (AOML), the U.S. Navy, and the U.S. Integrated Ocean Observing System (IOOS®), a national-regional partnership for observing and collecting data from the oceans and Great Lakes. Navy researchers were among the first to experiment with underwater gliders – unmanned torpedo-shaped robots that can operate for months, monitored and controlled from terminals on land – in tracking submarines. In just a few years, uncrewed gliders have proved indispensable to
UNIVERSITY OF SOUTH FLORIDA CENTER FOR OCEAN TECHNOLOGY
NOAA PHOTO
like wings, responding to slight changes in buoyancy to convert vertical motion into horizontal motion. The gliders navigate with the help of periodic fixes from the Global Positioning System, pressure and tilt sensors, and magnetic compasses. Their original navigation and mission parameters can be altered remotely, via satellite, and they can transmit data from their sensors – including measurements of temperature, salinity, dissolved oxygen, chlorophyll concentration, and dissolved organic matter – in real time, along with video and sound. And they’ve proven capable of withstanding serious beatings, from hurricane-force winds to attacks from sharks that mistake them for prey. The Navy estimates that the gliders gather data at about only 1% the cost of manned surface ships. While they are still a relatively new technology, these capabilities have enabled gliders to support a range of operations in support of NOAA’s mission. Recent and near-future projects involving gliders include deployments to: • the Northeast, where NOAA and the Woods Hole Oceanographic Institution have teamed up on
Top: Ubaldo Lopez of the University of Puerto Rico prepares to launch NOAA ocean gliders off Puerto Rico in 2017. Above: A Slocum glider that is being used to map a red tide bloom.
a project to monitor shipping lanes using gliders equipped with acoustic sensors, which can detect endangered right whales, alert mariners and fishermen, and help mariners avoid ship strikes; • the Great Lakes – western Lake Erie, specifically – where gliders have been deployed to monitor and measure the toxicity of harmful algal blooms, in order to help predict and protect the safety of drinking water supplies; • the California coast, to monitor ocean conditions, including
NOAA TODAY
harmful algal blooms, that could endanger crab fisheries; • Alaska waters, including the Cook Inlet and Chukchi and Bering Seas, to monitor the locations of marine mammals such as bowhead whales, belugas, walrus and ice seals, and help federal and state managers monitor ecosystem and habitat changes; • the Gulf of Mexico, where data on currents can help to ensure safe offshore energy operations, and chemical data can detect and characterize oil in the water column; • the Northwest, where data on currents, upwelling and water temperature can help ensure safe navigation, fishing and aquaculture; and • the Hawaiian Islands, where glider data improves forecast models used by the U.S. Coast Guard for search and rescue operations, and supports public health advisories about toxic warm-water bacteria. On their 2020 voyages, NOAA’s “hurricane gliders” set off to collect data in the upper ocean to sample from areas – such as the Gulf Stream of the Atlantic coast, and the Loop Current of the Gulf of Mexico, and areas where fresh water sits on top of the ocean – that are linked to strengthening or weakening hurricanes. The 2020 fleet was expected to collect up to 50% more observations than the previous year’s – moving NOAA and its partners closer than ever to improving our understanding and prediction of the ocean’s role in tropical storms.
1966
NASA transfers control of ESSA 2 satellite to the National Environmental Satellite Center, beginning a national operational weather satellite system.
81
Marine Aquaculture
A blue revolution By Craig Collins
S
eafood provides key beneficial nutrients that no other foods have. Seafood is also a good source of low-fat protein and essential minerals and vitamins. About 1.5 billion people worldwide rely on seafood to supply
A net pen aquaculture habitat off of Hawaii.
1967
at least a fifth of their animal protein, and American consumption continues to increase: in 2018, the average American ate 16.1 pounds of seafood, maintaining the nation’s status as the world’s second largest consumer of seafood.
These growing demands have not been met – and cannot be met – by the world’s wild-capture fisheries alone. Across the globe, wild fish harvests are not increasing while our global population continues to increase each year. NOAA and its partners have made good progress in ending overfishing in the United States through sound, science-based management practices, but wild fish harvests cannot meet current or future seafood demand. To meet the growing demand for healthy protein and omega-3 fatty-acids, many nations are turning to farmed seafood as a critical part for a sustainable seafood portfolio. Much like wild-capture fisheries, a vibrant domestic aquaculture industry is critical for more than just increased food security. Seafood farming, if done responsibly – as it is in the U.S. – is increasingly recognized as an environmentally sustainable way to support American seafood production, year-round jobs, rebuilding protected species and habitats, and enhancing coastal resilience. Recognizing the increasing importance of diversifying the U.S. seafood supply, NOAA has numerous mandates and priorities that charge the agency with fostering the growth of a sustainable domestic marine aquaculture industry. These include the National Aquaculture Act, Department of Commerce priorities, and the May 2020 Executive Order on Promoting American Seafood Competitiveness and Economic Growth According to Danielle Blacklock, director of NOAA’s Office of Aquaculture, NOAA has been instrumental in laying the policy and science foundation for a growing
Research centers Atlantic Oceanographic Laboratory, Pacific Oceanographic Laboratory, National Severe Storms Laboratory, and National Hurricane Research Laboratory established; forerunners for NOAA’s present laboratory system.
82
BLUE OCEAN MARICULTURE PHOTO
NOAA TODAY
NOAA IMAGE
U.S. aquaculture industry that today accounts for 21 percent of U.S. seafood production by value. In recent decades, Blacklock said, the U.S. aquaculture industry has implemented several innovations “geared toward increasing sustainability and production, increasing the nutritional value of farmed species, and promoting husbandry best management practices that can decrease or eliminate the use of antibiotics,” said Blacklock. “And a lot of these advancements have been based on research conducted or funded by
NOAA.” The agency’s commitment to this aquaculture science and cuttingedge research draws on expertise throughout NOAA: • The National Ocean Service’s National Centers for Coastal Ocean Science (NCCOS) supports coastal managers and the aquaculture industry by developing coastal planning and management tools and services, including assessing potential environmental impacts of aquaculture. These efforts provide the scientific intelligence required for proper
NOAA TODAY
siting of marine aquaculture while maintaining healthy and resilient marine ecosystems. • NOAA Research’s Sea Grant Program integrates aquaculture research, extension, and education through the national office and 34 university-based Sea Grant programs across the U.S. coasts and Great Lakes. Sea Grant manages NOAA’s primary extramural grant competition for aquaculture industry development. These grants support research and extension activities within universities, industry, and environmental organizations. Sea Grant extension agents live and work in coastal communities, providing science-based information to local governments, citizen groups, and other stakeholders, transferring technologies to industry to increase sustainable aquaculture production. • NOAA Fisheries focuses on addressing the regulatory, technical, and scientific barriers to domestic marine aquaculture development. The headquarters office and regional aquaculture coordinators address regulatory bottlenecks by increasing permitting efficiency around the nation. NOAA Fisheries also comprises much of NOAA’s inhouse aquaculture research, with activities at Regional Fisheries Science Centers. Research and development efforts focus on providing science information for management by addressing a number of issues including the culture of specific species, alternative feeds, animal health, and habitat benefits and impacts.
National Council for Marine Research, Resources and Engineering Development endorses the formation of the National Data Buoy Development Program within the U.S. Coast Guard; forerunner of NOAA’s National Data Buoy Center.
1968
World Weather Watch implemented.
83
NOAA TODAY
NOAA PHOTO
An open water fish farm pen in the ocean off the coast of Maine.
The regulatory environment for aquaculture in the United States is complex, with authorities divided among agencies based on several parameters – whether the seafood is produced in tanks on land, or in an inland waterway, or at sea, for example. Among these agencies, Blacklock said, NOAA is a leader: “We liaise with applicants and help them through the federal permit process,” she said. “And we also set the table for other agencies to come together to discuss increasing efficiencies in the permit process.” Making the process work better – and more efficient – for seafood farmers and agencies is a major objective of the May 2020 Executive Order. The order directs NOAA to
1969
identify Aquaculture Opportunity Areas and complete an Environmental Impact Statement for each area, to evaluate the impact of prospective facilities. “That process is meant to frontload a lot of what individual farms currently have to go through,” Blacklock said. “We’re doing the science and the analysis up front, to find places appropriate for aquaculture, before an individual applicant applies to get a permit. It does not change what the permitting system looks like, but because we will have focused our spatial analyses and other science tools on a specific body of water, we anticipate that the permitting process will move faster.”
In the years to come, U.S. marine aquaculture, guided by NOAA science, is sure to improve the nation’s food security while also diversifying seafood production that can expand and stabilize U.S. seafood supply in the face of environmental change and economic uncertainty. Blacklock envisions a future in which American farmed seafood leads the world in quality, and sustainability. “We are seeing a growing sense of urgency and optimism around aquaculture and it’s potential to sustainably meet a growing seafood demand while also supplying economic opportunities,” she said. “It’s going to be a keystone of our seafood future.”
Stratton Commission report Our Nation and the Sea recommends a new oceanic and atmospheric agency.
85
2020 Coastal Management Photo Contest Winners Areas We Protect
PHOTO BY TOM MUEHLEISEN
N
ational Estuaries Week is a time set aside to commemorate the remarkably productive estuaries found throughout the nation. Each year NOAA’s Office for Coastal Management hosts a photo contest to showcase and honor the 29 national estuarine research reserves – in which NOAA partners with state programs, academic institutions, and non-profit organizations – around the country. The photos offer unique perspectives of the research, education, and recreational aspects within these magnificent ecosystems.
Fog hanging over the Lower Spring Branch at Rush Ranch, San Francisco Bay National Estuarine Research Reserve.
1969
Geophysical Fluid Dynamics Laboratory develops its general circulation model, the first for projecting future climate change and still a significant development for climate science and weather forecasting.
86
PHOTO BY GRANT TWILLEY
PHOTO BY STEPHANIE BENNETT
Above: Fairweather Glacier to the north of Lituya Bay, Alaska. Left: The serenity of the sea and all its underwater denizens, Hawaii.
1969
Barbados Oceanographic and Meteorological Experiment, the first project of the Global Atmospheric Research Program, is conducted. Environmental Science Services Administration ship and aircraft support this experiment to investigate the ocean-atmosphere interface. Category 5 Hurricane Camille strikes Mississippi Coast, causing widespread damage.
87
PHOTO BY SARAH BEGGERLY
PHOTO BY JAN OSBURG
Recreation
PHOTO BY TODD MARSEE
Above left: Cliff divers at sunset, Hawaii. Above right: Sunrise fishing along channel, Florida. Left: Sleeping Bear National Lakeshore hike, Michigan.
1969
International Commission for the Conservation of Atlantic Tunas established, providing regulatory measures and intensive scientific research on tunas, billfish, and other tuna-like resources.
88
NOAA TODAY
PHOTO BY JACE TUNNELL
Coastal Hazards
PHOTO BY MIKE MOLNAR
Above: Storm coming in, MissionAransas National Estuarine Research Reserve. Left: Late spring on Lake Ontario during the high water event, New York.
1969
National Environmental Policy Act requires federal agencies to integrate environmental values into decision-making processes by means of Environmental Impact Statements.
89
PHOTO BY STEPHANIE BENNETT
PHOTO BY JACE TUNNELL
Marine Debris
PHOTO BY SARAH BEGGERLY
Above left: One man’s trash is another man’s treasure – glass floats, Hawaii. Above right: Monkey’s knuckle, Mission-Aransas National Estuarine Research Reserve. Right: Buoy washed up in high tide with Sargassum, Florida.
1970
October 3, NOAA created within Dept. of Commerce, combining Bureau of Commercial Fisheries, Weather Bureau, Coast and Geodetic Survey, Environmental Data Service, National Oceanographic Data Center, National Satellite Center, research libraries, and other components. Four fisheries research centers are established.
90
PHOTO BY STEVEN J. HOLLAND
Public Access
PHOTO BY TOM MUEHLEISEN
Above: Through the dunes and into the sea! New Jersey. Right: Sunrise and newly constructed bridge in the Lower Spring Branch at Rush Ranch, San Francisco Bay National Estuarine Research Reserve.
1972
Major marine conservation laws passed, including the Marine Mammal Protection Act and the Coastal Zone Management Act. Marine Protection, Research and Sanctuaries Act establishes NOAA’s National Marine Sanctuary Program.
91
PHOTO BY JUAN SĂ NCHEZ
Ocean Planning
Coral restoration post-Hurricane Maria in Culebra, Puerto Rico.
PHOTO BY TODD MARSEE
Economics
Irish Boat Shop, a Michigan clean marina, Michigan.
1973
Endangered Species Act enacted; National Marine Fisheries Service designated responsible agency for marine species.
93
Left: California state fish photographed in Channel Islands, California. Below: Morning light and fog in the Lower Spring Branch at Rush Ranch, San Francisco Bay National Estuarine Research Reserve.
PHOTO BY TOM MUEHLEISEN
PHOTO BY RICK MISKIV
Honorary Mentions
1974
Historic judicial ruling affirms rights of Indian tribes (Washington State) to fish in accustomed places with specific allocations of annual catches.
95
PHOTO BY TOM MUEHLEISEN
Honorary Mentions
PHOTO BY CYNTHIA ANDREOZZI
Above: Morning frost at Lower Spring Branch at Rush Ranch, San Francisco Bay National Estuarine Research Reserve. Left: Egret on dock with baby terrapin on its beak, Maryland.
1974
Great Lakes Environmental Research Laboratory established following a joint U.S.-Canada effort that focused scientific research on Lake Ontario in 1973; combines the U.S. Lake Survey and the International Field Years in the Great Lakes Office.
96
PHOTO BY LAKE SIMS
Honorary Mentions
PHOTO BY ANDY LANIER
Above: Looking north to Estero Bay Aquatic Preserve, Florida. Right: A nudibranch found in the rocky intertidal habitat of Seal Rock, Oregon.
1975
GOES-1, NOAA’s first owned and operated geostationary satellite launched. USS Monitor designated as NOAA’s first National Marine Sanctuary. P-3 Orion “Hurricane Hunter” aircraft acquired.
97
INTERVIEW
Dr. D. James Baker NOAA Administrator 1993-2001 Dr. Donald James Baker
earned his B.S. in physics from Stanford University and a Ph.D. in experimental physics from Cornell University. He was a post-doctoral fellow in oceanography at the University of Rhode Island under John Knauss, who later preceded Baker as Under Secretary of Commerce and administrator of NOAA. He was awarded a post-doctoral fellowship to work with Nobel Laureate Melvin Calvin at the Lawrence Berkeley Laboratory of the University of California on photosynthesis. In 1964, he moved to Harvard University, where he served as assistant and associate professor of oceanography. From Harvard, he joined the University of Washington in 1973, where he held a faculty position and co-founded and served as the first dean of the College of Ocean and Fishery Sciences. During that period, he also served as a group leader for Deep-Sea Physics at NOAA’s Pacific Marine Environmental Laboratory. He was appointed as Under Secretary of Commerce and administrator of the National Oceanic and Atmospheric Administration (NOAA) by President William J. Clinton in 1993 and served until 2001. What does NOAA provide to Americans that they might not necessarily be aware of in their everyday lives? Dr. D. James Baker: Well, NOAA provides the weather forecasts. And everybody is aware of that. That is something that I think is a big part of NOAA that people are aware of. But what they’re not aware of is really the oceans and fisheries environmental monitoring that goes on. NOAA incorporates the National Ocean Service. It does all the coastal measurements. They manage the Coastal Zone Management Program that interpolates between
1975–1993
states about what should be done. And NOAA is heavily involved in all commercial fisheries management. People don’t think about that. But all the ocean fisheries and the salmon fisheries that have to be managed are handled by NOAA. NOAA is also the representative, internationally, to the Whaling Commission. So, NOAA is engaged in managing whales. And then I guess the largest thing one thinks about is that NOAA is heavily involved in climate issues, all the way from research to monitoring, and then trying to make the case for the fact that this is an important problem.
So, it’s a good question, because when people think about NOAA they think about weather forecasts. And obviously that is more than half of the NOAA budget, and it’s a big, joint, private-sector TV stations enterprise. But the other part of NOAA, and one of the reasons NOAA was formed, was to have this emphasis on the ocean issues, and that’s something I think people are not so aware of. Do you think NOAA has become more important as time has passed? Is it more important now, in the 21st century, than maybe it was decades ago? NOAA was put together from existing agencies in 1970. But the biggest piece of NOAA, the Weather Service, is one that had existed ever since the 1860s, roughly. The oldest part of NOAA is the National Ocean Service and the Coast Survey that was established by Thomas Jefferson in 1807. So it has a heck of a long history. But I think there is no question that NOAA has become more important, because we are finally recognizing the importance of the environment to society and the importance of trying to be sustainable. And you can see that. When I first got involved in politics, I tried to do some environmental work
NOAA’s National Geodetic Survey creates the North American Datums of 1983 (horizontal) and 1988 (vertical), computerizing, redefining and readjusting the agency’s surveying networks. 1989 – North American Datum of 1983 (NAD83) approved for federal surveying and mapping activities. This is followed by 1993 – North American Vertical Datum of 1988 (NAVD88) approved for usage.
98
NOAA PHOTO
with the Dukakis campaign and they told me that no, environmental issues were not going to be important to the public. And even during the midterm Clinton elections, when I volunteered to do some politicking related to the environment, I was told the public was not really engaged. But you take a look today and you look at the Democratic debates – everyone on the stage has a plan for climate change. This is simply amazing to see that. And NOAA is right at the centerpiece of measuring, monitoring, and understanding, and then providing solutions to climate change issues. So, I think there is no question that NOAA has become more important as time has gone on. What sort of changes did you see at NOAA during your time there? You’re, I believe, the longest serving administrator at this point. Yeah, I was really interested in being the head of NOAA. So, I was on the transition team for the Clinton/ Gore administration. When they came in, I was able to help make political appointments there at NOAA, which was a big help. And then I stayed until the very end. So, I served the full eight years. It’s only Bob White, who was the original administrator at NOAA and had served in some previous leadership capacity for the previous organizations, that has served longer than I did. But I think what we could see there was a growing interest and attention from the Congress on both atmosphere and ocean issues. Al Gore was a big help in that, because he promoted those things. But what we saw, I think externally, was the fact that the world went from not
Dr. D. James Baker, during his tenure as NOAA administrator, 1993-2001.
having much more than telephone communication to being fully on the internet. That was the big change over that period of 1990 to 2000, roughly 1993 to 2001. I think in 1997 only 2 percent of the world was on the internet when I arrived at the Department of Commerce. We had all these old bakelite telephones on the desks. There were no computers anywhere. And we started with beepers. Cell phones started to appear in the mid-nineties. The whole idea of using the internet and transforming information and doing this electronically was something that a few smaller research groups had been involved with, but that really transformed over the period. We even went to the point of having to sequester, as it were, the NOAA.gov website, because somebody had tried to steal it and use it toward the end
of my term. So, the whole internet question was the big change. I think the other thing that we saw was a slowly growing recognition of the importance of environmental issues and the impact of trying to become sustainable. President [Bill] Clinton had established during his term the Clinton Council on Sustainable Development. That was the first time, I think, that you really had the environmentalists, and you had people from industry, you had the president of Exxon Mobil, and you had the NGOs [non-governmental organizations] and other groups, the state and local representatives, all coming together to really look at these issues of how do you make cities, states, and the nation sustainable. That was a really important impact there. During your time as NOAA administrator, what do you think your greatest challenges were? I would say we had two challenges. One thing I really wanted to work on during my time at NOAA was to try to reconcile and rationalize the satellite observing systems for weather forecasting, because we basically had three groups doing this. You had the Department of Defense – the Air Force was flying defense meteorological satellites. You had NOAA flying civilian meteorological satellites, and you had NASA flying experimental satellites. And my goal – since I had just written a book on satellites and I was really interested and had spent a lot of time on this topic – was to see if we couldn’t have some kind of convergence of the military, civilian, and NASA satellites. We thought if we could do that, we would bring along the Europeans at the same time.
1976
Magnuson Fisheries Conservation and Management Act provides for NOAA’s National Marine Fisheries Service to study and protect commercially fished species and the environmental factors affecting their numbers and health; establishes eight citizen-member Regional Fishery Management Councils. Pacific Marine Environmental Laboratory deploys the first successful moored equatorial current meter; forerunner of the Tropical Atmosphere/Ocean buoy array.
99
There already had been some cooperation there, but not full convergence. So we spent a lot of time working on trying to get that convergence, and we started a program that included the military. After I left, it turned out not to work well. We couldn’t get the two cultures to work that well together. But today there is a joint polar operational system which is joint between NASA and NOAA which did not exist before, and that came out of that discussion. So I’m really pleased that we were able to get that convergence. It’s difficult to get these different cultures that have different technical backgrounds to work together. And I think they made an important step there. That was one step. Another thing that we did at NOAA was to complete the modernization of the Weather Service – that is, to put in modern weather radars all around the country. And we went from something like 360 radars to something like 180, which meant there were a lot of communities who lost their local weather, area weather station, and they lost their local radar. So they were concerned about not having the same kind of weather coverage. So before me, a lot of work had been done on this. We had the final few places that were the most difficult ones to finally finish up. And I remember a long discussion in the White House with Larry Hagman, of Dallas fame, who was fighting having a weather station because he was worried about cancer effects. So, there were a number of impacts like that. We finally got it through and finished it at the end of like a ten-year process. The other thing I was really pleased that we could do was to start the whole system of ocean monitoring
1977
with floats, called the Argo floats. These are floats that float along the surface and then they descend into the ocean, and they drift along for awhile, and then they come back up again. They monitor ocean circulation and ocean temperature, and today there are 3,000 of these continually monitoring exactly what is happening in the ocean, watching the climate change, watching the ocean currents, adding this to weather forecasts. We started that. It was a bootstrap operation. I got a little bit of money from the White House. And then I went to the UK and I got the science advisor who I knew there to agree to buy one, since I said, “We’re buying some, we want you to buy some.” He agreed he would buy a couple of floats. Then we went to France and we got the science advisor there. I had known these people from previous interactions. We got them to buy a few. We came back to the U.S. and we said, “Look, we have this great international cooperation and we need even more money.” So, we were able to bootstrap it and get this start on this large forecasting problem. And another thing that we did that had not been done before was put in place an institute for forecasting El Niño. With El Niño, every five to seven years you get this big warming in the tropics and lots of storms in California. It’s a big weather event, and there is a lot more information about how it can be forecast and how it can evolve. We took that community interest in doing that and turned it into a formal institute, which we established at both Columbia University and with a foreign office in Brazil. But it was that recognition of the importance of trying to go just beyond the short-term weather forecast to somewhat longer
things like El Niño, and then getting more recognition with climate issues was another important topic. You set the stage for the first National Oceans Conference. Could you tell us what came out of that? Well, that was a really important event. You know, one of the things that has been true about NOAA for a long time, although it was established as an agency to focus on oceans – the National Oceanic and Atmospheric Administration – and it brought in the ocean parts to the weather service to form NOAA, there never was that much attention [to oceanography]. One of my hopes – knowing Al Gore and meeting President Clinton – was that I could get them really involved with the oceans. This is a true story. I went to the White House, and I said, “I’m trying to get more attention to the oceans. How can I get the president to show up at an event?” The people in the White House said to me, “Well, you’ve got to have a photo op. You know, think of a good place for a photo op.” And I said, “What do you think about having an event in Monterey, where you’ve got the setting sun?” President Clinton’s daughter, Chelsea, was going to Stanford [at the time]. And then if you did it towards the end of the year, they might be willing to go out and meet her there and so on. They thought that was great – having an event in Monterey. So, we said OK, we’ll have an oceanography conference in Monterey, and we’ll get the president and the vice president, and other leaders out there and the senators from California, and so on. Sam Farr, who was the congressman from Monterey, was really interested, so we started
NOAA’s Manned Undersea Science and Technology Office establishes the first regional underwater habitat: HYDROLAB.
101
to build this up. It was the year of the ocean that year, 1998, and I talked to the Office of Management and Budget, and they said, “If you’re going to have this conference, the president will want to announce a major budget initiative, so what would you like to see in terms of budget initiatives?” We actually ended up with 60 million new dollars and a new research ship because of the National Oceans Conference. These things all came together in the right way. I think the administration was looking for a good way to promote basically noncontroversial issues. Clinton was very interested, Gore came, we had all of the senators, we had all of the local people, Leon Panetta was out there, and it was an important step in terms of getting NOAA even more involved. And the research program – the new ocean exploration program that came out of that ocean conference – is a major part of the ocean budget today. One of the things the research community always complained about was that NOAA was not playing their role. [National Science Foundation] was a stronger player. But with the National Oceans Conference, we were able to make a strong step towards increasing that NOAA role. I think you may have already touched on some of these things, but what achievements are you most proud of that came about during your term as administrator? Well, I think one of the things is we literally laid the groundwork for understanding the basis of climate change and what should be done. I think that was a key element. We were also a major player on the President’s Council on Sustainable Development
in trying to look at these issues as fisheries catch declined and as invasive species came into the Great Lakes – zebra mussels, for example, that grow really, really fast and are bad for fouling ship bottoms. They come in on the ships there and grow rapidly. Trying to mitigate that and to deal with that in general, I think, was a critical thing. We also expanded and really worked well with the Coastal Zone Management Act, getting states to
“I think the biggest problem that we face is how to make the world sustainable.” work together. And in fact, at the beginning of the time that I came into NOAA, the state of Texas – at that point George W. Bush was the governor – had written to me and said, “We do not want to be part of the Coastal Zone Management Program. We don’t need federal help in managing our coast.” But in fact, by the time I left, Texas had changed their mind. And I have another letter that says, “We would like to join the Coastal Management Program because we would like to be fully part of the federal program helping protect our beaches.” Interestingly enough, the Texas Coastal Zone Management Program is now managed by a nephew of George W. Bush. But that change, that recognition of the importance of managing, and managing in a larger context, is something that we pushed hard. And it’s something that has, I think, developed well over the years.
What do you consider the greatest environmental challenges facing the nation in the 21st century? I think the biggest problem that we face is how to make the world sustainable. In almost every area that we look, we’ve seen our natural resources decline. And we have not been able to find a good way to keep those stable. We see this in fisheries as most fisheries’ catches decline. We’re seeing this in air pollution and water pollution. We’re seeing that now with climate change in the rise of CO2. We recognize the problem, but we haven’t been able to come up with good solutions. And it’s because these are gradual changes that people don’t see an immediate impact from. Each generation sees a small change from the previous generation, but they are not excited enough to try and do something. It’s not like a river catching on fire, and then we go establish EPA [the Environmental Protection Agency]. So, trying to make a sustainable world from gradual changes. Another way to think about it is shifting baselines. Each generation sees a new baseline that’s a little bit below the one before, and it doesn’t think of it so much. That’s one thing. The other thing I think that we really need to do is to have a full observing system. We need to look and monitor completely all the time what is happening with our atmosphere, our ocean, and our Arctic and Antarctic ice and the ice around the world, and the ecosystems – how they are changing. We’re only scratching the surface of what we can do, but trying to really observe and see that it’s really critical. So those two things I think are the critical challenges for the future.
1978
Ocean Pollution Planning Act recognizes need to investigate effects of pollutants on marine environment; beginning of NOAA’s Hazardous Materials Response and Assessment.
103
Floating and Flying Laboratories NOAA ships and aircraft
By Jan Tegler
NOAA Ship Bell Shimada during the 2010 Pacific Hake Inter-Vessel Calibration.
1980
National Undersea Research Program (NURP) established.
104
ments, conservation efforts and data gathering. These are augmented by more than 400 small boats that carry out a range of complimentary data collection missions, primarily in nearshore environments. A growing cadre of uncrewed aircraft systems also fly globally to collect data in new ways. NOAA’s aircraft, in particular, are frequently seen by the public in news coverage during hurricane season, flying into the storms on behalf of NOAA’s National Hurricane Center and the Atlantic Oceanographic and Meteorological Laboratory. NOAA ships get noticed, too, as they come
1982
Bell M. Shimada Fairweather Ferdinand R. Hassler Gordon Gunter Henry B. Bigelow Nancy Foster Okeanos Explorer Oregon II Oscar Dyson Oscar Elton Sette Pisces Rainier Reuben Lasker Ronald H. Brown Thomas Jefferson
National Snow and Ice Data Center (NSIDC) established in Boulder, Colorado.
NOAA PHOTO
N
OAA’s ships and aircraft are among the most striking representatives of the organization’s many missions, serving as floating and flying laboratories for scientific research on a multitude of earth systems, as real-time sensors for short and long term weather forecasting, and as emergency response platforms. Fifteen active crewed research and service ships and nine crewed aircraft sail and fly around the continental U.S., U.S. territories, and across the globe to carry out an impressive array of studies, experi-
NOAA Research Vessel Fleet
NOAA Ship Ferdinand Hassler.
and go from their homeports, from the East Coast to Hawaii. But it’s the people who sail, fly, operate sensors, and maintain the organization’s ships and aircraft who are the enablers of NOAA’s missions above the earth, on the seas and below them. A highly skilled combination of NOAA Corps aircraft pilots and ships’ bridge officers as well as civilian professional mariners and aviation technicians staff the vehicles that scientists and researchers from academia, research institutions around the world, and NOAA line offices embark on. Their work provides the foundation for NOAA’s floating and flying laboratories.
NOAA PHOTO
Multipurpose Mariners Capt. Daniel Simon, director of marine operations for NOAA’s Office of Marine and Aviation Operations, is one of NOAA’s most experienced mariners, having plied the world’s oceans on the organization’s vessels since his first posting 19 years ago aboard the now-retired fisheries survey ship Miller Freeman. These days he’s in charge of making sure NOAA’s fleet of large
vessels is prepared to sail to execute NOAA’s missions, a steep challenge due to the current COVID-19 pandemic. But before rising to his current position in NOAA’s Office of Marine and Aviation Operations (OMAO), Simon commanded two of its largest vessels, the 224-foot the Hi’ialakai based in Pearl Harbor, Hawaii and the 274-foot, Charleston, South Carolina-based Ronald H. Brown, NOAA’s biggest ship. NOAA’s 15 active ships undertake a range of tasks that fall under five main mission categories, Simon explained. “We work in all of the world’s oceans, doing fisheries work, hydrographic surveys [measuring the physical features of water bodies, including the shape and features of shorelines, tide, current, and wave characteristics, and the physical and chemical properties of water], bathymetry work [studying the beds or floors of water bodies, bathymetric maps illustrate the land that lies underwater], basic oceanography and basic ocean research.” The now-retired Hi’ialakai specialized in coral reef ecosystem
mapping, coral reef health and fish stock studies, and maritime heritage surveys. Ronald H. Brown supports a variety of scientific studies to increase understanding of the relationship between the world’s oceans and its climate. But both “have the ability to cross over into other realms and do other projects as needed,” Simon noted. He took command of Brown in the summer of 2018 as it was in the latter stages of a 243-day aroundthe-world expedition conducting scientific research and servicing buoys that inform global weather, climate and ocean forecasting. “I actually picked the ship up in the Seychelles and took command in Goa, India,” he said, recalling that the ship was “servicing buoys and putting the finishing touches” on the Research Moored Array for African-Asian-Australian Monsoon Analysis and Prediction – or Rama Array. The array is “a tropical, equatorial array of buoys tasked with measuring subsurface temperature and other information we can’t get any other way,” Simon said. “It goes into the forecast for monsoons for the entire Asian continent and has ramifications worldwide.” Initiated in 2004, part of the array is in a comparatively low-trafficked area of the world’s oceans. “There were buoys in the northwest quadrant of the array in the Arabian Ocean that, due to piracy issues, hadn’t been finalized over the years,” Simon said. “We put in the final three moorings on that array, and the Indian government promised that if we put the initial buoys in they would service them yearly.”
1983
President Ronald Reagan declares a United States Exclusive Economic Zone (EEZ) extends out 200 nautical miles from shore. NOAA begins multi-beam surveying of the EEZ, leading to many discoveries including economically important salt domes in the Gulf of Mexico.
105
The highest wind speed measured by a NOAA hurricane hunter aircraft was 197 knots.
NOAA PHOTO
NOAA Ship Ronald H. Brown.
Simon and the crew of the Brown exercised caution on another mission the voyage undertook: measuring ocean chemistry. “The line that we were doing, from Mauritius to the Arabian Sea, hadn’t been done since 1994 due to piracy concerns,” Simon explained. “When water samples come onboard a group of scientists rapidly analyzes the water, as quickly as possible before it changes from interacting with the surface atmosphere. They measure the dissolved oxygen content and the physical, biological and chemical constituents of the water.” Commissioned in 1997, Ronald H. Brown typically deploys for just over a month, exercising its impressive capabilities as NOAA’s largest floating laboratory. Operated by a crew of 29, including six
NOAA Corps officers who primarily serve as the ship’s bridge team, the vessel also carries engineering and operations personnel and technicians who look after its electronics and liaise with the scientists who embark on Brown for a variety of research. “It’s a fantastic vessel and I felt honored to be the commanding officer,” Simon said. “Brown has about 4,000 square feet of laboratory space, significantly more than our typical NOAA research vessels. It holds up to 60 people, 30 of them scientists, and can easily go worldwide with incredible capability. When it came out in 1997 it must have been absolutely state of the art. I still felt like it was state of the art when I took command in 2018.”
Simon’s tenure as Brown’s commander fell slightly short of the two-year tour that’s typical for large NOAA ships when he was assigned to his present position. But when his successor fell ill on a subsequent mission that took the ship to South Africa, Simon was sent to take command and bring Brown home. “I was taken a little early from command of the ship,” he said. “So for me it was nice to go back and finish on a good note.” Like NOAA’s other ships, Brown is tasked through NOAA’s Fleet Council, Simon explained, noting that each of line offices in NOAA have priorities. “Some of those priorities are made with a definite vessel in mind, but all are made with NOAA’s requirements in mind to complete its mission, its responsibilities to Congress and the public.” But in early spring 2020, NOAA’s fleet was called home, curtailing the missions they were in the midst of due to COVID-19. Simon has been among those instrumental in trying to keep ship crews safe while balancing NOAA’s operational posture. “Our priority is keeping our mariners safe and the virus as far away from them as we possibly can,” he said. “We’ve had one ship sail in this period and that ship left again in mid-July. Our other ships are preparing to sail as well, but it’s a new paradigm to work in.”
1984
Tropical Ocean-Global Atmosphere program begins in response to 1982 El Niño. Moored buoy arrays with ocean temperature sensors monitor changes in temperature of the tropical Pacific Ocean. Honolulu Laboratory, Southwest Fisheries Science Center develops marine ecosystem model, ECOPATH, to describe the ecosystem and energy budget for a coral reef ecosystem in the Northwestern Hawaiian Islands; used by ecosystem modelers throughout the marine community.
107
Low, Slow, and Good to Go – The Twin Otters
1985
NOAA pilots Lt. Conor Maginn and Lt. j.g. Mason Carroll with Twin Otter NOAA46 after a Snow Survey Mission in Minneapolis, Minnesota, February 2020.
from the Atlantic to Alaska to down in the mountains.” Most people visualize NOAA aircraft flying over bodies of water, but some unique missions take Twin Otter crews to parts of the United States where you wouldn’t expect to find them. The snow survey mission is a good example. In autumn and again mid-to-late winter, NOAA dispatches Twin Otters to the upper Midwest, New England, Alaska and Canada to gather information about the water content found in the snowpack that accumulates in these areas. The data collected helps the National Weather Service determine the extent of the flooding that might result when snow melts in the spring. “We fly over a series of survey lines in the fall and gather the background amount of gamma radiation that’s emitted from the soil,” Maginn explained. “Then we fly over the same lines in the winter, and what happens is that the snowpack blocks or attenuates that gamma radiation
signal. We can compare numbers from the fall and winter and figure out effectively the amount of water content in the snow.” In 2019, Twin Otter crews were also deployed for a project called Firex-AQ – Fire Influence on Regional to Global Environments and Air Quality. Maginn said two of NOAA’s turbine-powered Otters were fitted with instruments to measure the chemical composition of smoke emitted from wildfires. Over the course of two months, working jointly with NASA, Maginn and other pilots flew through wildfire smoke in Idaho, Oregon, Arizona and Utah. “We actually had two Otters flying on that,” Maginn recalled. “One flew over the top of the smoke trying to identify where the best, safest area to sample the smoke was and the other Otter was down in the smoke itself. I flew the low altitude one and it was quite challenging. We had masks on in the plane and we rinsed the aircraft’s compressors after almost every flight.”
Researchers at National Geodetic Survey expand Global Positioning System for surveying and kinematic positioning, revolutionizing surveying and the national transportation infrastructure. National Acid Precipitation Research Office established to coordinate the study of acid rain.
108
PHOTO BY NICK STEWART
Lt. Conor Maginn was “on the road” flying one of NOAA’s four de Havilland Canada DHC-6 Twin Otters for 210 days – or approximately seven months – in 2019. Known as the workhorse of the NOAA aircraft fleet, the Twin Otter is the most versatile airplane in the agency’s nine-aircraft fleet, operated from Lakeland, Florida by the Aircraft Operations Center. A patch worn by Twin Otter pilots and copilots on their flight suits features a motto that said a lot about the missions they perform. “We need to fly the airplane slow and low to the ground to tackle the missions we do,” Maginn said. “Our motto is ‘Low, Slow and Good to Go – The Twin Otters’.” The twin-engine Otters are crewed by two pilots, acting as aircraft commander and copilot, and carry two to six researchers depending on the mission. Maginn said the pilots “switch seats” every day so that copilots can gain enough experience to become aircraft commanders, usually over a two-year period. Maginn and his fellow Twin Otter pilots take pride in their skills, often flying missions at 500 feet or below at 100 to 120 knots (115-138 mph) for long periods of time. “Our Twin Otter crews are really good pilots across the board,” Maginn said. “We fly close to the ground with few options for getting out of bad situations. “Generally our pilots don’t specialize in just one mission. That means being able to fly missions low and slow
More customary missions, including marine mammal research such as surveys of North Atlantic right whales (one of the world’s most endangered large whale species, with only about 400 whales remaining) call on Twin Otter pilots to fly in circles – all hand flying – as low as 600 feet above the Atlantic to allow scientists aboard the aircraft to photograph the whales they find for identification and to track migration patterns. Twin Otter crews are also dispatched to the Arctic Circle and Alaska to survey marine mammal populations and gather data on sea ice for climate research. “I don’t know of any other job that is as rewarding as the job I have right now,” Maginn said. “But in a few years I think I’d like to fly the P-3.”
Orions – Hunters and Gatherers
NOAA PHOTO
NOAA’s two Lockheed WP-3D Orion long-range hurricane hunter aircraft, known affectionately as “Miss Piggy” and “Kermit,” are among the most visible equipment NOAA oper-
Head-on view of a NOAA Lockheed WP-3D Orion “hurricane hunter” aircraft in flight.
1986
ates. They’re often featured in news coverage of hurricanes, flying into and around the storms to gather a wide range of data for the National Hurricane Center, the National Weather Service, and others. Lt. Cmdr. Kevin Doremus has been flying NOAA’s Lockheed WP-3Ds for three years. A “homegrown” NOAA aviator, Doremus progressed through the ranks, flying other planes from the Aircraft Operations Center fleet before earning a coveted spot as an Orion pilot. Many of NOAA’s WP-3D pilots are “inter-service transfers,” having made the switch from flying the U.S. Navy’s now-retired P-3C Orions to NOAA’s Orions. Doremus went through the Navy’s challenging P-3 syllabus without having prior Navy experience, and loves his job. “We do some really dynamic flying,” he said. “It’s challenging, but we have crews with a ton of experience and we learn from each other every day.” During hurricane season the two WP-3Ds are almost always in mo-
NOAA Aircraft Fleet Lockheed WP-3D Orion (2) Beechcraft King Air 350CER (1, and 1 on order) De Havilland Canada DHC-6-300 Twin Otter (4) Gulfstream IV-SP (1) Gulfstream Turbo Commander 695A (1) Gulfstream G550 (1, on order) tion when storms are present, with one aircraft taking off when another lands so “that we have a continuous presence around the storm to deliver the most up-to-date information possible,” Doremus explained. Up to 22 people can be aboard a WP-3D during a hurricane mission, Doremus said. They include three pilots who rotate through the cockpit to allow one to be on break, two flight engineers, one or two flight directors/meteorologists, a navigator, aircraft technicians, including airframe and data specialists, a dropsonde (a tubeshaped instrument with a variety of weather sensors inside) operator, visiting scientists from universities and institutions as well as NOAA personnel from the NOAA Atlantic Oceanographic and Meteorological Laboratory’s Hurricane Research Division, and even media.
NOAA’s Aeronomy Laboratory begins investigation of the Antarctic ozone hole at McMurdo Base, Antarctica.
109
NOAA ships sailed 279,863 miles on research and survey missions in 2019. “We do hurricane reconnaissance, where we identify the center of a storm, determine where it is and what it’s doing, and relay that information to the Hurricane Center,” Doremus explained. “The other missions are for hurricane research, and we can do both missions simultaneously.” WP-3D crews use a variety of sensors to characterize a hurricane, including the aircraft’s tail-mounted Dual Doppler radar. This very high resolution radar captures a three-dimensional picture of hurricanes, revealing a vertical picture of their structure that is a gold mine of information for researchers to improve forecasts of hurricane intensity – a vital measure of a hurricane’s potential for destruction and information critical for public safety. But as “sporty” as flying through the eye-wall of hurricanes is, Doremus said it’s not the most demanding flying WP-3D crews do. “Our tornado research mission – from a pilot’s perspective, that’s the most challenging, high risk flying we do because the environment we fly in is dynamic.” Prior to hurricane season NOAA Orion crews can be found flying from Kansas and Alabama along the precarious front edge of the super cell storms that spawn tornadoes. Climbing to 7,000 feet, the WP-3D crews fly directly toward weather all other pilots avoid like the plague.
1989–1990
“Flying though these storms could rip the airplane to pieces,” Doremus said. But careful flight planning and pre-flight briefs with scientists who are aboard for the tornado research flights allow the researchers to get as close as safely possible to the deadly supercells,” he said. “Every storm is a little different, and you never know exactly what you’ll get, but we’re very risk cautious on these missions,” Doremus explained. “We fly with our Aircraft Operations Center meteorologists aboard. They sit right behind us in the flight station with computers that display all of our radars – our nose radar, lower fuselage radar which scans 360 degrees around the aircraft, and our tail Doppler radar. They’re looking at the big picture in real time, and help us steer the safest path.” All WP-3D pilots fly other NOAA aircraft. Doremus also flies the Aircraft Operations Center’s Gulfstream Turbo Commander on snow survey and soil moisture missions as well as gravity measuring surveys, known as “GRAV-D” on behalf of NOAA’s National Geodetic Survey. GRAV-D missions are underway nationwide and across U.S. territories to measure the earth’s gravity field to model and monitor Earth’s geoid (a surface of the gravity field, very closely related to global mean sea level). Measurements serve as a zero reference surface for all heights in the nation. Accurate heights are critical to many scientific endeavors, but particularly to
understanding and protecting lowlying coastal ecosystems.
Discovering the Big Picture “I joined the NOAA Corps to be a ship driver, a mariner,” said Cmdr. Rebecca Waddington. A meteorologist with a degree from San Jose State University, Waddington had a father with an aerospace engineering background, but never had an ambition to become a pilot – that is, until the NOAA Corps notified personnel throughout the agency that it was in need of pilots. “I had interned at the National Weather Forecast Office in Monterey, California, and then went and did oceanography on several NOAA ships and had a ball,” Waddington said. Thereafter, she joined the NOAA Corps, earned a commission, and was assigned to one of the agency’s oceanographic vessels. It was while she was serving as a meteorologist at the National Hurricane Center that an internal NOAA email alerted her to the possibility of flying. “I went for an interview and told them I had no experience in aviation,” Waddington remembered. “I told them I did have a different kind of experience, running scientific missions. They must have liked what I said, because they sent me to flight school, and before I knew it I was flying the King Air.” Waddington continues to fly NOAA’s Beechcraft King Air 350CER
Climate and Global Change Program office established to conduct research on global climate change phenomena; becomes the Office of Global Programs to provide scientific research on climate variability, predictions, and assessments.
110
PHOTO BY CMDR. BRAD FRITZLER
Capt. Kristie Twining (right) and Lt. Cmdr. Rebecca Waddington in the cockpit of NOAA’s Gulfstream IV hurricane hunter jet “Gonzo.”
and will likely fly the new King Air the Aircraft Operations Center has acquired as a replacement for the Turbo Commander. But these days her primary duty is as aircraft commander of the agency’s high altitude, long range, high-speed research platform – a modified Gulfstream IV-SP (G-IV). Waddington also flies the G-IV, nicknamed “Gonzo,” as part of a crew that typically includes three pilots (one for relief), two meteorologists, and one technician. While the WP3D crews are flying at lower altitude through hurricanes, Waddington and the G-IV crews fly around and above the storms, monitoring them with a Doppler radar but also deploying dropsondes from high altitude. “The purpose of the dropsondes is to fill the numerical forecast models with actual data,” said the meteorologist-turned pilot. “They send information back to the plane via a VHF radio frequency. In the ocean we don’t have the weather stations we have on land. There are
a lot of assumptions for weather data from the oceans, and over time errors with the assumptions propagate. We gather actual data to replace those assumptions to improve forecasts. It’s also getting data at the surface, where it’s unsafe to fly in a hurricane.” The G-IV is looking at “the bigger picture of hurricanes,” Waddington explained, flying patterns hundreds of miles away from a storm as well as over the top of it. “We’re figuring out how the environment outside of the storm is going to affect the storm’s development and motion,” she said. Waddington said the G-IV also flies the GRAV-D mission and NOAA’s atmospheric rivers mission. Atmospheric rivers are relatively long, narrow regions in the atmosphere that transport most of the water vapor outside of the tropics. These columns of vapor move with the weather, carrying an amount of water vapor roughly equivalent to the average flow of water at the mouth of the Mississippi River. When the
atmospheric rivers make landfall, they often release this water vapor in the form of rain or snow. The most extreme examples can cause flooding and induce mudslides. “We can climb to 45,000 in the G-IV,” Waddington explained. “And we look at storm systems coming across the Pacific Ocean in the winter impacting the west coast. The higher we go, the more data we can sample. We can get into the stratosphere much earlier during these winter missions, at higher latitudes than we do during hurricane missions.” Coastal mapping is the mission Waddington flies most often in NOAA’s King Air. She describes it as “almost like mowing a lawn, taking photos of the shoreline and updating nautical charts for shipping.” Sometimes the King Air’s sensors come into play with emergency response missions in unexpected ways. After Hurricane Michael devastated Panama City, Florida, in 2018, Waddington and a crew were flying emergency response, photographing the damage to the area. The King Air’s high-resolution cameras picked up something unexpected, she said. “Someone had many trees fall around their house and couldn’t get out,” she remembers. “They actually arranged some of the logs to spell out the word “help”. We didn’t see that with our naked eye flying over but one of our analysts who happened to be scanning through the geo-referenced imagery saw that, and were able to get the people the help they needed.” As Waddington notes, NOAA’s ships and aircraft are first and foremost floating and flying laboratories “but they also do more.”
1990
National Marine Fisheries Services Mississippi Laboratories develop protocols and devices to reduce the take of endangered sea turtles in shrimp trawls. National Meteorological Center installs a supercomputer to run more sophisticated numerical weather production models. Nation’s first restricted rights fishery implemented with quotas of the annual catch of northeast surf clam and ocean quahog.
111
INTERVIEW
NOAA Administrator 2001-2008 Conrad C. Lautenbacher
is the chief executive officer of GeoOptics. He served as Under Secretary of Commerce for Oceans and Atmosphere and as the eighth administrator of the National Oceanic and Atmospheric Administration (NOAA), 2001 to 2008. He rose to the rank of vice admiral in the U.S. Navy, where he was commander of the U.S. third fleet. Lautenbacher also served as Deputy Chief of Naval Operations in charge of programs and budget. He is a graduate of the U.S. Naval Academy and holds M.S. and Ph.D. degrees in applied mathematics from Harvard University. Why does America need NOAA? What does NOAA contribute to the nation? Vice Adm. Conrad C. Lautenbacher: NOAA has been and remains an essential part of the success our nation has experienced since its foundation. For a very small annual investment, NOAA provides the critical information needed to understand the enormous effects the Earth’s atmosphere and ocean to-
1992 112
gether contribute to our existence. There is good reason Earth is known as the “Blue Planet”; 70 percent is covered by the ocean, and 100 percent is covered by the atmosphere. Weather information depends on both ocean and atmosphere, and directly affects our ability to prosper. 30 percent to 50 percent of our economy, depending on the author of the calculation, depends directly on weather forecast information,
Vice Adm. Conrad C. Lautenbacher during his tenure as NOAA administrator, 2001-2008.
and without that base, the other 50 percent to 70 percent could not exist. NOAA provides the foundation of the value chain from basic science understanding to successful applications by society in underpinning economic success. The ocean plays a vital role in shaping the weather, providing basic food sources, and worldwide delivery of goods and services! Ocean and atmosphere are wedded and we humans are the beneficiaries of that fortuitous NOAA marriage. Was there anything about the organization that surprised you after you began your work there? I would have to say after 40 years of U.S. Navy service, nothing really surprised me! The best description of my reaction was extreme pleasure
First Doppler weather radars installed at Weather Service forecast offices around the country, and first Automated Surface Observing Systems.
NOAA PHOTO
Vice Adm. Conrad C. Lautenbacher
with the professionalism, knowledge, and productivity resident in all parts of NOAA, from the headquarters staff to individual scientists on station in such remote locations as the South Pole; Mauna Loa, Hawaii; and Point Barrow, Alaska.
NOAA PHOTO
How did NOAA change while you were in charge? My first activity was devoted to meeting and learning as much as possible from the outstanding professionals that staff NOAA. That internal dialogue culminated in the formation of a committee composed of experienced and energetic younger folks from all parts of NOAA to canvas the organization for ideas and develop a plan for the future. One of the concepts incorporated in that plan was to build a “One NOAA� spirit as the core of our operations, the goal being to encourage the diverse scientific disciplines resident in this widespread and productive organization to work together in harmony across the various NOAA resident earth sciences and operational skills. You were warning of the deterioration of coral reefs almost two decades ago. What has caused the situation, how serious is the risk to the planet, and what solutions can you see that might help ameliorate the problem? Having spent a career in the Navy, my time at sea and in our coastal zones provided a background of how poorly the ocean was treated by human development and blatant misuse of the ocean as a dumping ground. There was a general lack by the public in understanding the
1994
Vice Adm. Conrad C. Lautenbacher answers a question during a press conference in Geneva, 2007.
degradation taking place, and particularly in regard for the damage to coral reefs. Fortunately, many others were also interested in improving the situation, and finally, the rules as well as the practices of not using the ocean as a dumping ground for huma-generated waste changed for the better. There is still very much to do in this area. Not only is this caused by dumping trash at sea, but also every piece of paper or refuse dropped on the land, unless policed, will end up in our watersheds and hence increase the degradation of the ocean. The ultimate answer is building sustainability into everything we as humans created, as well as continue to create and use for our comfort without regard to the
future. We must also clean up the ocean as it is today! You supported the Open Rivers Initiative. Why was and is this initiative important and how much progress has been made? To continue the discussion of our watersheds from the previous question, Open Rivers was an important piece of building sustainability into our operations and planning for the future use of rivers worldwide. Overuse and lax administration of watersheds can result in contamination and outright waste of fresh water needed worldwide for sustainability. One of the initiatives we championed was removal of obsolete dams and creating a sustainable balance
National Polar-orbiting Operational Environmental Satellite System Office established to coordinate civil and military satellites.
113
among human uses for development, agriculture, fishing, and recreation. Over the past 10 years or so, we have seen some improvement, particularly in the U.S. Northwest, in managing our rivers for long-term sustainability, but much more needs to be done. You spearheaded the Earth observation summit in July 2003, and encouraged world scientific and policy leaders to build a Global Earth System of Systems (GEOSS). Why was this initiative important and what has resulted from it? To paraphrase Sean O’Keefe, a former head of NASA and friend from our Navy service together, the Earth is our home in space, and a planet from which we are not likely to escape in the near future. It is up to us to maintain it sustainably! The Earth is a “system of systems” and we need to think of and maintain it as such. Each earth science is extremely important, but how those individual sciences are connected and work together in maintaining our environment is paramount. NOAA itself, as it has progressed since formation 50 years ago, has demonstrated the wisdom of viewing each earth science as a coordinated part of human stewardship of the planet. Like most of my vintage, I was educated in separate courses devoted individually to biology, chemistry, and physics, and of course we cannot forget about mathematics, which plays a role in each! The ocean, the atmosphere, the land, and the cryosphere are indeed complementary and each affects the other in important ways. Maintaining our planet requires we work together across the earth science disciplines in
“NOAA itself, as it has progressed since formation 50 years ago, has demonstrated the wisdom of viewing each earth science as a coordinated part of human stewardship of the planet.” all nations to achieve worldwide sustainability. I am pleased that the global organization founded during my NOAA tenure remains in operation today and continues to grow. There is indeed a greater understanding of the connectivity of the earth sciences and the effect of that connectivity on achieving sustainability. What do you consider to have been your greatest challenges during your tenure as NOAA administrator? Certainly, working to see the initiation of GEO and GEOSS was a major challenge, and I am grateful to all those who participated with me in this undertaking. Working continuously to obtain the resources necessary to meet NOAA goals and objectives was, and I have to say, a challenge for me and remains a challenge today. There are many needs for government funding, but NOAA’s cross-disciplinary mission and backbone of sustainability for us and the planet should always be in the top echelon of that list! I am indeed grateful to the President and Executive Staff, the Department of Commerce, and congressional and senatorial members and staff who supported the NOAA budgets during my tenure.
What achievements or results are you most proud of that came about during your term as administrator of NOAA? First of all, the achievements listed below are those of the knowledgeable, enterprising, and dedicated NOAA team of men and women who worked tirelessly to meet and fulfill the needs of our nation. I am proud to have served with them. It would be a very long list indeed if I were to name all of the achievements of this team during my seven-year tenure as NOAA Administrator. The list would certainly include: The establishment of GEO and the GEOSS; the formalization of the “One NOAA” approach; revitalization of the NOAA Corps and NOAA fleet; the Open Rivers Initiative; Establishment of the Pacific Ocean Tsunami Warning [Center]; Establishment of the Northwestern Hawaiian Islands (Papahānaumokuākea) Marine National Monument), doubling the size of the Pacific Islands Sanctuary; Development of a climate change science initiative; Significant improvements in hurricane prediction; Reauthorization of the Magnusson and Stevens Fisheries Management Act; and many others led by dedicated team members in every part of NOAA!
1995
Geophysical Fluid Dynamics Laboratory develops first hurricane prediction system based on a three-dimensional hurricane model. NOAA’s Space Environment Center uses coronal imager LASCO in NASA’s Solar and Heliospheric Observatory spacecraft; revolutionizes operational space weather forecasting and prediction methods. High Seas Driftnet Fishing Moratorium Protection Act prohibits large-scale high seas driftnets that entangle protected mammals and commercial fish species.
115
NOAA’s Orbital Observatories By Eric Tegler
Y
ou may not realize it, but the National Oceanic and Atmospheric Administration is a major satellite operator. A constellation of 16 satellites is currently flying for NOAA, and every day it reveals a wealth of useful – and sometimes lifesaving – information about our amazing planet and even the sun around which we orbit. Along with operating its own fleet, NOAA also collects and analyzes information gathered by satellites from the Department of Defense, NASA, and several other countries and international organizations.
Monitoring & Understanding The heart of the mission for which NOAA’s satellites were launched is pretty simple. Earth is a dynamic system of systems, which it pays to monitor and understand. NOAA’s satellites are the tools with which the government provides data and awareness of weather, climate trends, terrestrial and undersea changes, and the global environment in general. Using a combination of geostationary, polar and deep space satellites, NOAA’s National Environmental Sat-
1996
ellite, Data, and Information Service (NESDIS) provides secure and timely access to global environmental data to promote and protect the nation’s security, environment, economy, and quality of life. NESDIS data sources also include international satellites operated by partners, including the European Organization for the Exploitation of Meteorological Satellites (EUMETSAT), the European Commission, the Japan Meteorological Agency (JMA) and Japan Aerospace Exploration Agency (JAXA), the National Space Organization (NSPO) Taiwan, the Indian Space Research Organization (ISRO), the Canadian Space Agency (CSA), and the four-party (NOAA, NASA, French Space Agency [CNES], EUMETSAT) Jason satellites. Drawing on these overhead assets, an array of ground/sea based sensors, and data processing tools, NOAA paints a comprehensive picture of the state of global weather and the environment that is updated by the minute, hour, day, and month. NOAA Assistant Administrator for Satellite and Information Services Stephen Volz recently referred to the combination as akin to “creating a digital Earth.”
“NESDIS is about the environmental satellites, but it’s also about the data and information systems,” Volz told online viewers of NOAA’s July 2020 Environmental Leadership seminar. “The information is the value of what we do. The satellites are how we collect it. Digital Earth is going from pretty pictures to critical, useful information. That’s where NESDIS plays a key role as an intermediary with our internal NOAA partners and partners around the world.” Weather is critical, useful information, and NOAA operates the nation’s weather satellites 24/7. Volz pointed out that 95 percent of the data used in weather forecast models comes from satellites. That included NOAA’s early August prediction that the 2020 Atlantic hurricane season would likely bring from 19 to 25 named storms, nearly twice the normal number of named storms on average. Gerry Bell, lead seasonal hurricane forecaster at NOAA’s Climate Prediction Center, told National Public Radio that the nine named storms that had already formed before Aug. 1, 2020 were – “the most ever recorded since the satellite era began in 1966.” Bell’s observations and projections could not have been made without NOAA’s satellites.
GOES NOAA’s Geostationary Operational Environmental Satellites (GOES) provide consistent, reliable monitoring of the Western Hemisphere. They’re the satellites that identify and track severe weather, snow storms, tropical cyclones and, as part of the CospasSarsat Program, emergency locator
Magnuson-Stevens Fishery Conservation and Management Act (“Sustainable Fisheries Act”) provides for National Marines Fisheries Service authority and responsibility to conserve and protect fishery resources and their habitat.
116
NOAA IMAGE
The constellation of satellites that NOAA operates, oversees, or gathers data from.
beacons carried by ships, planes, and even hikers. GOES satellites fly in a geostationary, medium Earth orbit. With an orbital period equal to the Earth’s rotational period, they’re essentially motionless to ground observers, staying in a fixed position in the sky about 22,000 miles above Earth. NOAA currently operates the GOES-16 satellite in the “GOES East” position (over the U.S./Atlantic Ocean), GOES-17 in the “GOES West” position (over the Pacific Ocean), and GOES-14 and 15 as on-orbit back-ups. In 2019, America saw 14 billion-dollar disasters. They included
1997–1998 tropical Pacific.
eight severe storm events, three flooding events, two tropical cyclones, and one wildfire event in multiple locations. Overall, these events caused at least 44 casualties and had significant economic impacts. There were many more less-severe weather events during the course of the year, and NOAA’s GOES-16 and 17 sats – equipped with the Advanced Baseline Imager instrument – saw them all, providing the data for life-saving forecasts by NOAA and others in 2019. They also mapped the flooding that accounted for three of the billion-dollar disasters in 2019,
including devastating floods along the Mississippi, Missouri, and Arkansas rivers. NOAA and George Mason University partnered to develop flood-mapping products that use data and imagery from GOES-16 and GOES17 as well as the NOAA-NASA Suomi NPP and NOAA-20 satellites.
Spotting Wildfires from Space Extreme weather put more people in peril than usual, but so did fires. Wildfires arose across the U.S. in 2019, but California was particularly hard hit. The destructive Kincade Fire was the state’s largest, and NOAA
NOAA successfully forecasts worldwide impact of El Niño using data gathered by the Tropical Atmosphere Ocean array in the
117
people rescued from 20 aviation incidents, and 77 people rescued in 61 incidents using personal locator beacons (PLBs) on land. GOES satellites carry a SARSAT transponder that detects distress signals from emergency beacons and relays them to the closest ground stations. From there, the information is sent to the SARSAT Mission Control Center at NOAA’s Satellite Operations Facility in Suitland, Maryland, before rapid routing to rescue coordination centers, operated either by the U.S. Air Force for land rescues, or the U.S. Coast Guard for water rescues.
Polar Satellites
satellites provided guidance to the firefighters who battled it. GOES satellites can detect and pinpoint fires before they are spotted on the ground, even in remote regions like the Alaskan wilderness. “We use the satellites to inform decisions on where to stage assets across the country,” Brad Quayle of the Forest Service’s Geospatial Technology and Applications Center told a NESDIS interviewer. “When there’s high competition for firefighters, tankers, and aircraft, decisions have to be made on how to distribute those assets.”
NOAA IMAGE
Cospas-Sarsat Lifesavers As the backbone of the international Cospas-Sarsat constellation, NOAA’s GOES satellites helped locate and rescue an estimated 421 people in the United States and its surrounding waters in 2019. A breakdown of the rescues shows 306 people rescued in 96 incidents at sea, 38
1998
Satellites orbiting above the North and South poles provide a critical source of weather and environmental data to NOAA and its partners. They fly in a non-geosynchronous low Earth orbit (LEO) about 500 miles above the poles. These polar-orbiting satellites circle the Earth from North Pole to South Pole 14 times each day as the planet spins below. The weather forecasting and climate research data they gather is collected alongside global sea surface temperature measurements, atmospheric soundings of temperature and humidity, ocean dynamics research, volcanic eruption monitoring, global vegetation analysis, and other applications. NOAA has been flying polar satellites since the 1960s, but the current crop – NOAA-15, 18, 19, 20 and Suomi NPP – has been aloft since 1998. They started off as part of the Polar-orbiting Operational Environmental Satellite (POES) constellation (15, 18, 19) which shifted to a program called National Polar-orbiting Operational Environmental Satellite System (NPOESS). Aborted in the mid-2000s, it was followed by the launch of just one new polar satellite in 2011, the NASA-owned Suomi NPP, which was to bridge capability until NOAA’s latest generation of Joint Polar Satellite System (JPSS) satellites came online. NOAA 20 is the first of these. Rotating between the poles, it can see the entire Earth twice a day. It’s in the same orbit as Suomi NPP, about 50 minutes ahead of the older satellite, which allows for a useful overlap in observational coverage.
Protecting New Routes for Trade and Travel This year, as it did last year, NOAA-20 has been helping ships navigate the Northwest Passage. Famed and
Harmful Algal Bloom and Hypoxia Research and Control Act passed.
119
Ocean Satellites NOAA is interested in a range of ocean data for everything from fisheries and undersea life studies to weather and hydrological conditions. But satellites can also provide crucial data for studying sea level rise. NOAA operates the Jason-3 satellite, which is owned by the French National Centre for Space Studies (CNES) agency. Jason-3 can deliver highly detailed measurements of sea surface height to assess sea levels. Sea surface height data is also used to study hurricane intensity, tsunami
2000
dynamics, El Niño Southern Oscillation, eddy dynamics, ocean boundary currents, coastal and shallow water tides, as well as weather and climate forecasting. Situated in non-sun synchronous low-Earth orbit, Jason-3 uses a radar altimeter to determine sea surface height. Sea level measurement is important because it can be used to estimate the depth of the thermocline, or the transition layer in a body of water where the mixed warm water from the surface and the cooler water from below meet. By measuring how deep ocean heat extends below the ocean surface, NOAA is better able to estimate tropical cyclone heat potential and thus the likelihood of tropical cyclones. Eric Leuliette, NOAA Satellite Oceanography & Climatology Division Ocean Physics branch chief said in a 2017 NESDIS news piece that Jason-3 (and its predecessor, Jason-2) help resolve small eddies and ocean currents, “more accurately mapping La Niña conditions in the Pacific.”
Leuliette added that the satellite also provides data to improve Atlantic hurricane intensity forecasts. Heightened sea surface temperatures add up to the formation of more hurricanes. “When the tropical Atlantic is warmer than usual, that makes more energy available for the storms, so there tends to be greater numbers and more intense hurricanes,” said Mark DeMaria, with NOAA’s National Hurricane Center. Sea surface temperature detection has played a major role in the NOAA Climate Prediction Center’s 2020 Atlantic hurricane forecast.
Deep Space Satellites Keeping track of weather on Earth isn’t enough to keep us truly informed and alert. What happens in space matters too. There is such a thing as “space weather.” The Deep Space Climate Observatory, or DSCOVR, satellite monitors solar wind and other space weather
Presidential Executive Order establishes NOAA’s Marine Protected Areas (MPA) Center. The Coral Reef Act of 2000 establishes NOAA’s Coral Reef Conservation Program. Modernization of the NOAA weather services completed; doubles lead times
120
NOAA IMAGE
sought after as a shorter trade route between Europe and Asia, this pathway through the Arctic has been clear of ice for seasonal periods in recent years, a phenomenon scientists attribute to climate change. Safe travel through the Northwest Passage requires up-to-date monitoring of ice-floes and weather conditions. Along with Suomi NPP, NOAA-20 can provide the necessary ice-condition data, filling gaps over areas not well covered by observing systems on the ground. NOAA-20’s Advanced Technology Microwave Sounder (ATMS) Microwave Integrated Retrieval System (MiRS) technology produces maps of temperature, water vapor, precipitation, and snow and ice cover each day. In addition, the Visible Infrared Imaging Radiometer Suite (VIIRS) instrument aboard the NOAA-20 can observe the entire Arctic within 12 hours at sub-kilometer spatial resolution. Several more polar satellites are slated to be launched into the JPSS constellation, including NOAA-21, scheduled to blast off in 2022.
NASA/NOAA IMAGE
NASA PHOTO
Left: The nearly ice-free Northwest Passage seen from space. Above: The rarely seen dark side of the moon, illuminated by the sun, as it crosses between the DSCOVR spacecraft’s Earth Polychromatic Imaging Camera (EPIC) and telescope and the Earth – 1 million miles away.
events in real time. It’s the nation’s first operational satellite in deep space, orbiting at a unique location called Lagrange point 1, or L1, approximately 1 million miles away from Earth. The orbit is a gravity-neutral point in space, allowing DSCOVR to essentially hover between the sun and Earth at all times, maintaining a constant view of the sun and sun-lit side of Earth. From its vantage, the satellite can provide advanced solar measurements and early warnings of potentially dangerous space weather events, acting as a solar storm buoy in deep space. Early warning of space weather is critical. Events like the geomagnetic storms caused by changes in solar wind have the potential to disrupt nearly every major public infrastructure system, including power grids, telecommunications, aviation and GPS.
DSCOVR can provide a 15- to 60-minute warning time before the surge of particles and magnetic field, known as a coronal mass ejection (or CME), associated with a geomagnetic storm reaches Earth. The warnings potentially spare public infrastructure and advanced technology systems from major damage and disruption. Using NASA’s Earth Polychromatic Imaging Camera (EPIC), a four megapixel CCD camera and telescope, that is part of DSCOVR’s payload, the satellite can also record and display for us a full year of life on earth from its orbital position. EPIC takes a new picture every two hours, capturing the ever-changing motion of clouds and weather systems and the fixed features of Earth such as deserts, forests, and the distinct blues of different seas.
The Dark Side of the Moon This year marks the five-year anniversary of an iconic image captured by DSCOVR in July of 2015. While collecting an image of Hurricane Dolores, then spinning over the eastern Pacific Ocean before it brought flooding rainfall to Southern California, DSCOVR inadvertently captured an otherworldly object that blocked part of its view of the Earth. It was the renowned but rarely seen “dark side of the moon.” DSCOVR caught it as the moon passed directly between the satellite and the Earth. It was of value because it allowed scientists to see the half of the moon that is always facing away from the Earth. Only satellites farther away than the moon, which is approximately 238,000 miles from the Earth, can accomplish this feat.
for tornado and flash flood warnings, reduces tornado-related fatalities by 40 percent. Advanced Weather Interactive Processing System integrates disparate data, putting critical data at the forecasters fingertips.
121
NOAA IMAGE
NASA and NOAA scientists can use DSCOVR to study features on the far side of the moon, an opportunity that arises no more than twice a year. On behalf of NOAA, NASA awarded a delivery contract to Ball Aerospace & Technologies of Boulder, Colorado, for the Space Weather Follow On-Lagrange 1 (SWFO-L1) spacecraft in June 2020. The SWFO-L1 satellite is scheduled to launch in 2024 as a rideshare with the NASA Interstellar Mapping and Acceleration Probe. Like DSCOVR, it will collect solar wind data and coronal imagery to support NOAA’s mission to monitor and forecast space weather events.
An Archive of Weather and Climate
In addition to the satellites mentioned above, NOAA operates four Defense Meteorological Satellite Program (DMSP) satellites that are
The GOES-East satellite, also known as GOES-16, captured this high-resolution imagery of a derecho – a line of severe thunderstorms – on May 4, 2020. Derechos are often accompanied by high winds, heavy downpours, and hail. GOES-East keeps watch over most of North America, including the U.S. and Mexico, as well as Central and South America, the Caribbean, and the Atlantic Ocean to the west coast of Africa.
owned by the U.S. Air Force. Considered complementary to NOAA’s polar-orbiting satellites, they provide the military with important environmental information used in planning and conducting U.S. military operations worldwide. DMSP satellites support NOAA’s three to seven-day operational weather forecasts, operational weather “nowcasting” in Alaska and polar regions, and environmental monitoring and prediction. With the other satellites that NOAA has on orbit, they not only provide for forecasting, early warning and observation – they contribute data to an essential archive of climate and Earth-trends information.
“It’s not just weather. It’s not just the atmosphere or the solar system that we observe,” NESDIS’ Stephen Volz said. “We maintain one of the most significant archives of environmental data on the planet. All of the observations that NESDIS makes are intended to be part of this national archive. When you think about any observation from NESDIS, [the archive] can place it in context for what’s happened in the last 50 years – in some cases, the last 1,000 years.” That long-term view – from above – will help the U.S. and the global community to try to steer a course in managing the climate over the next century and beyond.
Since the program’s inception in 1982, COSPAS-SARSAT has been credited with supporting more than 48,000 rescues worldwide, including nearly 9,100 people in the United States and its surrounding waters. 123
The truth is NOAA can only accomplish its missions by responsibly leveraging internal and external partners across the globe. They magnify the efforts of individual NOAA personnel and the organization’s line and staff offices many times over – providing a multiplier effect for NOAA programs and initiatives, and providing public visibility of NOAA’s efforts out of proportion to its comparatively small size.
“Throughout NOAA’s history, partnerships have underpinned our achievements and will ensure our future success. Whether working collaboratively with researchers to improve forecasts, engaging coastal communities to support thriving recreation and commerce, or collaborating with regional fishery councils to maximize sustainable fishing, our work with our partners is critical to the stewardship of our planet and its resources.” – DR. NEIL JACOBS, ASSISTANT SECRETARY OF COMMERCE FOR ENVIRONMENTAL OBSERVATION AND PREDICTION
2001 124
NOAA’s Office of Ocean Exploration created.
Left: Dr. Neil Jacobs (fourth from left) with NOAA personnel and partners at the designation of the Mallows Bay-Potomac River National Marine Sanctuary. Top: National Hurricane Center Director Ken Graham discusses Hurricane Isaias on The Weather Channel. Center: A Center for Operational Oceanographic Products and Services staff member conducts tide station leveling, supporting the U.S. Army Corps of Engineers. Above: National Weather Service Director Louis Uccellini explains hurricane impacts on CNN with Wolf Blitzer.
NOAA PHOTO BY MATT MCINTOSH
NOAA PHOTO
NOAA PHOTO
A
little more than 12,000 people make up NOAA worldwide. That may sound like an impressive number, but it can’t begin to account for the scale or impact of the agency’s contributions to scientific research, environmental conservation, commerce, navigation, education, and the public’s awareness of the ever-changing weather around them.
NOAA PHOTO
Partnerships
CORAL RESTORATION FOUNDATION PHOTO
“America’s blue economy is strengthened by our partnerships with the scientific, fishing, shipping, tourism, energy and other sectors, agencies, and philanthropies tied to the ocean. By 2030 the global ocean economy will double in value to $3 trillion, and working with our partners, NOAA will advance our understanding, the health, and sustainable use of our oceans, coasts, and Great Lakes to assure our nation’s prosperity and security throughout the 21st century.” – REAR ADM. TIMOTHY GALLAUDET, ASSISTANT
SPACEX PHOTO
Partnering with NOAA, Coral Reef Foundation divers transplant nursery-grown staghorn coral.
“The National Weather Service provides observations, forecasts, and warnings, and links those directly to life-saving decisions made in every community, a key component in building a Weather Ready Nation. We don’t do it alone thanks to valued partnerships, with the larger weather, water, and climate enterprise helping us reach more people and protecting more lives and property every day, while working together to enhance the nation’s economy.”
SECRETARY OF COMMERCE FOR OCEANS AND ATMOSPHERE
A SpaceX Falcon 9 carrying COSMIC-2 satellites as part of the USAF Space Test Program-2 moves to the launch pad. The American Institute in Taiwan and the Taipei Economic and Cultural Representative Office in the United States partnered in the program, with NOAA and the Taiwan National Space Organization as designated representatives.
– DR. LOUIS W. UCCELLINI, DIRECTOR, NOAA’S NATIONAL WEATHER SERVICE
NOAA PHOTO
“NOAA’s advancements in weather, climate, and ocean science have been foundational for the global community, and we are proud to continue working in the global community upon which we rely for meaningful and productive partnerships.”
NOAA, American Rivers, the Maryland Department of Natural Resources, and other partners watch as preparations for the removal of Bloede Dam take place.
2002
– CRAIG MCLEAN, ACTING CHIEF SCIENTIST AND ASSISTANT ADMINISTRATOR FOR OCEANIC AND ATMOSPHERIC RESEARCH
NOAA Weather Radio adapted for use in national emergencies; expanded to reach 95 percent of the American public in 2003.
125
BRANDON TABAHA, CU DENVER STUDENT
“NOAA’s IOOS® Program produces, integrates, and communicates high-quality information about U.S. waters. Its 11 Regional Associations provide distinctive knowledge, technology, and NOAA-backed data that meet regional and national needs. IOOS RAs demonstrate how collaborative efforts achieve lasting results.” – NICOLE LEBOEUF, NOS ACTING ASSISTANT ADMINISTRATOR CU Upward Bound students from six tribal communities in front of the Science on a Sphere in Boulder, Colorado, 2018.
NOAA PHOTO BY DR. STEPHANIE MOORE
“We need everyone’s help to build a sustainable future. Fom the citizen scientist to the high-tech entrepreneur, it’s going to take a global effort to understand and adapt to the changes happening in Earth’s environment, and to understand and adjust our own role as active participants in our Earth system.” – STEVE VOLZ, ASSISTANT ADMINISTRATOR FOR SATELLITE AND INFORMATION SERVICES
NOAA PHOTO
In a collaborative effort led by NOAA, the Northwest Association of Networked Ocean Observing Systems (NANOOS), and the University of Washington Applied Physics Lab, researchers and crew deploy an Environmental Sample Processor (ESP) off the coast of La Push, Washington, where it will collect and process water samples, testing for toxins and cells that signify harmful algal blooms (HABs).
“Maintaining strong commercial and recreational seafood sectors, protecting marine species and their habitats, and practicing world-class science and research is NOAA Fisheries’ mission. Our successes – past and future – require a collective effort that must include partners from all facets of industry, academia, non-government organizations, and more.” – CHRIS OLIVER, ASSISTANT ADMINISTRATOR, NOAA FISHERIES
2003
Hundreds of NOAA employees and partners participate in the annual NOAA Restoration Day in Maryland and Virginia.
NOAA hosts the Earth Observation Summit in Washington, D.C. Emergency Personal Locator Beacon System becomes operational nationwide.
127
NOAA: A Community of Science, Service, and Stewardship Building a diverse and inclusive workforce
D
iversity matters for science, and NOAA understands that the success of its missions depends on the diversity and inclusiveness of its workforce. It’s a principle stated emphatically by Dr. Neil Jacobs, assistant secretary of commerce for environmental observation and prediction, and NOAA’s acting administrator, in his introduction to NOAA’s Diversity and Inclusion Strategic Plan: “It is impossible to articulate,” he wrote, “how critical a role diversity and inclusion play in helping NOAA effectively accomplish its mission.” When we think of all the partners NOAA collaborates with, we think in terms of delivering service, which demands a workforce capable of understanding and responding to a variety of communities and stakeholders. It’s increasingly clear – and substantiated by research – that the work of framing and solving complex problems, as scientists do, is best served by diverse teams of thinkers. Groups composed from diverse experiences and expertise are more creative and innovative, bringing new questions, ideas, energies, and perspectives to old problems – perspectives less likely to be clouded by the familiar. The ability to see problems differently is often the key to scientific breakthroughs.
2005
“For a scientific agency like NOAA,” wrote Jacobs, “innovation is a key driver of growth. Without diversity, we limit our ability to innovate. Without inclusion, diversity becomes meaningless, and any benefits associated with diversity will not be realized. The two concepts are inseparable, and begin with an inclusive environment.” NOAA’s efforts to increase diversity and inclusion are aimed both inward and outward. Internally, its policies and procedures emphasize a commitment to a diverse and inclusive workplace. More important, NOAA encourages a culture that values diversity and inclusion as mission-critical assets. It has adopted an enterprise-wide vision within its Office of Inclusion and Civil Rights, which monitors and encourages the cultivation of principles throughout NOAA. “NOAA’s diversity profile has risen as a result of that,” said Kenneth Bailey, who directs the office, “and in addition, we’ve started a variety of different programs to bring awareness to the importance of diversity and inclusion.” One of these programs is the annual Diversity and Inclusion Summit, first organized in 2016 by a group that included Dr. DaNa Carlis, a meteorologist and program manager
for the Oceanic and Atmospheric Research Weather Program Office. The first summit attracted a few hundred participants, but the number of NOAA managers and staff attending has more than doubled since – over a thousand attended the most recent event held in September, highlighted by Michael Bush, the keynote speaker from Great Place to Work. NOAA’s José E. Serrano Educational Partnership Program with Minority Serving Institutions (EPP/ MSI) supports the training and graduation of students and increases the participation of students from traditionally underrepresented minorities – and in so doing, develops eligible candidates for NOAA’s workforce and mission-related enterprises. EPP/MSI supports four Cooperative Science Centers located at three Historically Black Colleges and Universities, Howard University, University of Maryland Eastern Shore, and Florida A&M University and one Hispanic Serving Institution, the City College of New York. The EPP/MSI centers include 24 academic institutions that work together to train students in core NOAA mission fields: remote sensing technology and atmospheric, oceanic and environmental sciences. Over time, the EPP/MSI centers have supported
Hurricane Katrina generates “One-NOAA response”; NOAA’s National Hurricane Center, Navigation Response Teams, National Weather Service Remote Sensing Division, NOAA HAZMAT teams, NOAA ships, the Coastal Services Center, and Sea Grant offices are examples of many forms of assistance provided by NOAA. NOAA begins expansion of U.S. tsunami detection and warning capabilities in response to the December 2004 Indian Ocean tsunami.
128
NOAA PHOTO
The NOAA Office of Oceanic and Atmospheric Research Equal Employment Opportunity Advisory Committee (EEOAC) during an April 2019 meeting in Silver Spring, Maryland.
2,970 students and awarded 2,058 degrees. In 2019, the Educational Partnership Program funded 289 students attending minority-serving institutions, 44 of whom graduated with mission-related STEM degrees; 17 of whom pursued further education; and 27 of whom found employment with NOAA or other natural resource or science organization. The EPP/MSI Centers have made a significant impact on the demographics of Ph.D. recipients in NOAA mission science fields. EPP/MSI Center institutions graduated about 60 percent of African Americans who
2006
were awarded Ph.D.s in atmospheric science, 55 percent of African Americans who earned Ph.D.s in environmental science, and 35 percent of African Americans who earned Ph.D.s in marine sciences from 2006-2018. Dr. Carlis and Dr. Michelle Hawkins, Chief of the National Weather Service’s Severe, Fire, Public and Winter Weather Services Branch, both EPP alumni, organized the Diversity and Professional Advancement Working Group, an internal network, in 2014. Its mission is to attract, retain, and support the professional advancement of underrep-
resented minorities in NOAA. Carlis described the group as a national network “for people who are interested in advancing their career and impacting change within our agency.” One of NOAA’s most distinguished scientists, Dr. Jamese Sims, also an EPP/MSI alumni, earned a NOAA scholarship to attend college at Jackson State University in Mississippi, and worked as a NOAA intern as both an undergraduate and graduate student before coming to work for the agency as a full-time meteorologist and algorithm engineer. Most recently, she’s been charged with developing NOAA’s strategy for adopting artificial intelligence across its operational lines. NOAA’s efforts to recruit and retain diverse talent, and to foster a culture that values and promotes diversity and inclusion, have made a difference beyond mere demographics. As Bailey pointed out, the Federal Viewpoint Surveys, administered annually by the Office of Personnel Management, include questions in two categories – Support for Diversity and the New Inclusion Quotient (New IQ) – that have both risen in each of the last three years. 2019 also marked the seventh straight year that NOAA employees’ job satisfaction ratings increased as well. These results reflect NOAA leaders’ understanding that changing demographics are only the beginning of what diversity and inclusion can ultimately deliver for the organization and the nation it serves: happier, more productive people, capable of providing the best possible service, stewardship, and science to Americans.
Establishment of the Northwestern Hawaiian Islands Marine National Monument.
129
NOAA TODAY
NOAA Tribal Partnerships
W
hile NOAA works with many partners, from local and state level governments to international entities outside the borders and federal waters of the United States, NOAA’s partnerships with Native American and Alaska Native tribes and villages are unique. The government-to-government relationship between NOAA and native tribes and villages embodies the U.S. government’s obligation to consider the rights and interests of Native American and Alaska Native tribes and villages when carrying out the mandates of federal law. This relationship is a benefit to both. While NOAA brings scientific knowledge and U.S. government support to the table, tribes are sovereign nations and have been stewards of the Earth. They represent a wide, deep pool of ecological knowledge about species, their habitats, behaviors, needs, and threats, gained by a close and interdependent relationship embraced and passed down over the course of centuries. Acknowledging the benefits of traditional ecological knowledge (TEK) is a recent document produced by NOAA’s National Marine Fisheries Service and National Ocean Service – “NOAA Fisheries and National Ocean Service Guidance and Best Practices for Engaging and Incorporating Traditional Ecological Knowledge in Decision-Making” – which encourages, “as appropriate and to the extent practicable
2007 130
and permitted by law, the inclusion of TEK in the line offices’ environmental science, policy and decision making process…” “I grew up at Taos Pueblo and we’re good stewards of the environment, and all of our ceremonies, everything that we do, is tied to the land,” said Georgia Madrid, a NOAA equal employment opportunity specialist in Boulder, Colorado and a Native American. “We are all connected, we are all relatives, and we don’t see the land as a resource, but rather we are to be good stewards.” NOAA’s tribal partnerships with the 574 federally recognized tribes across the country help to conserve habitat on tribal lands, with NOAA providing technical assistance and additional funding on projects while respecting tribal history and culture. In Alaska, NOAA works with native organizations, conserving populations of marine mammals while managing subsistence hunting, and working on issues such as salmon bycatch, harvesting halibut, commercial trawling off western Alaska, and Arctic fisheries management. As the Arctic warms, this partnership is by necessity growing stronger. “NOAA has an Arctic steering committee led by Adm. Gallaudet [Rear Adm. Tim Gallaudet, the assistant secretary of commerce for oceans and atmosphere and deputy NOAA administrator],” said Meredith Cameron, the headquarters liaison for NOAA’s Regional Collaboration Network. “That committee is cur-
rently reworking its priorities, with a renewed interest in the Arctic. They’ve also had a renewed interest in tribal engagement because there are so many tribes here in Alaska and so many issues, especially around fisheries and marine mammals. The team is trying to find ways they can better interact with tribes across the gamut of NOAA missions.” In the Greater Atlantic Region, NOAA works with tribes to protect marine mammals, sea turtles, and species such as Atlantic salmon, as well as on ecosystem restoration, aquaculture, and mitigating ocean acidification. NOAA species recovery grants to the region’s tribes support management, outreach, research, and monitoring projects for endangered and threatened species as well as de-listed species. In the West Coast region, tribes have strong ties to marine and aquatic resources that are valued not only for subsistence and commerce, but for religious and ceremonial reasons. Many Pacific Northwest tribes manage fishery resources in partnership with states and the federal government, and play a large part in managing fisheries while preserving their rights to fish under treaties. NOAA partners with tribes on the formation of salmon recovery teams, supporting efforts with grants such as the Pacific Coastal Salmon Recovery Fund as well as task forces like the Columbia Basin Partnership. In the Pacific Islands, while there are no federally recognized tribes, NOAA still consults with native
NOAA celebrates 200-year anniversary of NOAA predecessor Survey of the Coast, founded by President Thomas Jefferson in 1807.
INTERVIEW
Dr. Jane Lubchenco NOAA Administrator 2009-2013
Dr. Jane Lubchenco served as administrator of NOAA and Under
Secretary of Commerce for Oceans and Atmosphere from 2009 to 2013. After leaving NOAA, she was the Mimi and Peter Haas Distinguished Visitor in Public Service at Stanford University (March–June 2013). In June 2013, she returned to Oregon State University, where she was on the faculty prior to being invited by then President-Elect Barack Obama to serve on his “science team.” Her many awards include the MacArthur “genius” award in 1993, and more than 15 honorary degrees. In 2002, Discover magazine recognized Lubchenco as one of the 50 most important women in science.
2007
much more for less than $5 a day per American! You were in charge when the Deepwater Horizon disaster occurred. What were the immediate and longer-term impacts of the explosion and spill? The Deepwater Horizon oil spill disaster had a devastating impact on the people and economies of many communities along the Gulf coast. Scientists are still documenting the full ecological impacts, especially to longer-lives species such as sea turtles, dolphins, and tuna. It has been more than 20 years since you wrote “Entering the century of the environment: A new social contract for science.” Can you
Dr. Jane Lubchenco during her tenure as NOAA administrator, 2009-2013.
explain its message to scientists and do you think it has had the effect you had hoped for? Just over 20 years ago, I challenged scientists to be more useful to society by doing a better job of sharing their knowledge with citizens. I believe that scientific information should be readily available and understandable to nonscientists so they can use that
The Magnuson Stevens Act reauthorization is a game-changer in fisheries management and places the trajectory of U.S. fisheries on the path to global leadership.
132
NOAA PHOTO
What does NOAA provide to Americans that they might not be aware of? Dr. Jane Lubchenco: NOAA provides a wide range of services to Americans, from weather forecasts and warnings to fishery management in federal waters, from stewardship of marine mammals and turtles to data and understanding about climate change, from nautical charts to marine sanctuaries to space weather forecasts. NOAA employees work from the bottom of the sea to the surface of the sun. The theme that links all of this together is science. NOAA is a science agency – it uses state-of-theart science to deliver these services and stewardship. It’s an incredible bargain for Americans – all this and
knowledge to make better decisions. I’ve been gratified to see more and more scientists step up and become what I call bilingual – they are adept at speaking both the language of science and the language of lay people. I’m delighted to see more and more academic scientists coming out of their ivory towers to actively engage with society and seek solutions, not just describe problems. “Citizen science” is now quite popular. In short, over the last two decades, there has been a sea change in scientists’ attitudes toward their roles in society. Science is more relevant than ever before and scientists are more engaged than ever before. Nonetheless, the academic reward structure continues to deter this engagement and communication. I’m hopeful that, too, will change. NOAA completed the nation’s first National Ocean Policy under your leadership. Why is a National Ocean Policy important? To be clear, President Obama created the country’s first National Ocean Policy. NOAA participated actively in the planning that led to the policy, and was active in helping to implement it. The policy did three important things: One, it provided an overarching mandate and approach. The mandate: to ensure that the country has healthy, productive, and resilient ocean ecosystems. Only then can we have the full range of benefits we want and need from the ocean – healthy seafood, good jobs, clean beaches, abundant wildlife, vibrant coastal communities, and more. The approach is an inclusive and participatory, science-based ecosystem
approach to management and policy. Without an overarching mandate and ecosystem-based approach, ocean management is chaotic, inefficient, and likely to fail. The previous issue-by-issue, sector-by-sector, hodgepodge approach – despite the best of intentions – was leading to depleted and disrupted ocean ecosystems and therefore serious economic losses, increased vulnerability of coastal communities, and loss of wildlife. Two, the policy also provided a mechanism for coordination across the 26 federal departments and offices that have direct or indirect responsibility for ocean health. And three, the policy provided a vehicle for coastal regions to engage in planning and management of the ocean ecosystems off their coasts, supported by federal agencies. The overarching goal of the first National Ocean Policy was to ensure that we could continue to use the ocean and benefit from its bounty without destroying it. That goal is even more important today. What do you consider to have been your greatest challenges during your tenure as NOAA administrator? The biggest challenge was to do justice to the range of NOAA’s important mandates while also implementing some much-needed reforms and also dealing with the disasters that came pouring in over the transom: Deepwater Horizon disaster, the most extreme weather in any four years in U.S. history, a dysfunctional but critical weather satellite construction program, the downturn in the economy, a partisan-heavy, legislation-light Congress, and ClimateGate. For-
tunately, the career employees at NOAA were exceptionally dedicated and skilled, the president and many members of Congress were strongly supportive, as were many of NOAA’s local, state, national, and international partners in government, industry, and civil society. What accomplishments or results are you most proud of that came about during your term as administrator of NOAA? Returning U.S. federal fisheries to sustainability and profitability; providing stellar climate science and services to help Americans understand what’s happening, why, and what can be done; fixing the weather satellite construction program; helping establish and implement the first National Ocean Policy; modernizing approaches to dealing with and assessing damage from oil spills; improving the language used to warn citizens of pending weather-related disasters; helping jump-start the economy and provide lasting economic and environmental benefit through coastal restoration projects – and much, much more! What do you consider the greatest environmental challenges facing the nation today and in the future? Climate change, loss of biodiversity, and disruption of ocean ecosystems all challenge society as never before. But the real threat is the assumption that it’s too disruptive or expensive to transition to more sustainable practices and policies. We have quite viable options, we just need to act.
2007
The National Weather Service transitions from county-based to new storm-based warnings, issuing more geographically specific warnings for tornadoes, severe thunderstorms, floods, and marine hazards. NWS implements the Enhanced Fujita Scale to rate tornadoes, replacing the original Fujita Scale.
133
International By Nature
0°
13 0°
14
NOAA’s Office of International Affairs spearheads global engagement that the agency’s work demands.
e R.
12
0°
Mackenzi
Great
Bear
Lake
A
PAULATUK
Am
un
ds
en
COPPERMINE ra
it
nd
St
S ou
in
on
V
Pr in
ce
Co ro na
Al b
l ph
U ni
er t
Do
tio n
D
G ulf
110°
By Eric Tegler
a nd
C
I
S
T
O
R
I
A
I
A
Gu lf
au
M n
Qu ee
A
Stra it c
M
.
C
R
C
I N
L
C K T O
C H A N N
PRINCE OF WALES I
Franklin Strait
B O O T H I A P E N I N S U L A
Pee
S O M E R S E
I S L A
200
90°W
G
u
o
l f
f
B
o
t h
o
i a
Pr
in ce
R eg
en
BRODEUR PE NINSUL
t
A
200
Roes Welc ome Soun d
ME
LVI
LLE
SOUTHHAMPTON
PENINSULA
D
ISLAND
L
Fo
xe
A
Ch an ne l
N
BYLO
0
20
0
FOXE
S
50
1000
BASIN
I
1500
A
F
F
I
N
B
B nd S ou d rl an
I
T
m be
T
R
A
Cu
S
200
200
S
IS
200
D
I
V
A
D
500
°
T
IU
IM
SIS
F
0
20
500 1000
K
R
E
G
50
° 0
50
1000
0
500
50
1500
00
10
1500
K
O
N
R
E
D
E
R
IK
s VI
ST KY 00
10
40
°
G
Nunap Isua (Kap Farvel)
Constructed from an assemblage of digital and analog information, this map is a modern version of Sheet 5.17 of the General Bathymetric Chart of the Oceans (GEBCO) [Canadian Hydrographic Service, 1979].
Bathymetric and other information The information used in the construction of this map consisted of: historic and recent under-ice soundings collected by submarines of the United States and the United Kingdom; historic and recent observations collected by icebreakers and drifting ice stations; and information portrayed in published navigation and compilation charts. The locations of these data sets are shown in separate source distribution maps, while data contributors and relevant references are listed in this legend under "Data Contributions". Although extensive, in some areas the database of digital trackline and spot observations contained critical gaps that had to be augmented with information that was only available on paper maps and charts. In the central Arctic Ocean, original observations were augmented with contour information derived from a map published by the Russian Federation Navy [Head Department of Navigation and Oceanography et al., 1999]. Similarly, contours extracted from maps published by the Geological Society of America [Perry et al., 1986; Cherkis et al., 1991; Matishov et al., 1995] were used in Bering Strait and in the Barents and Kara Seas. On the continental shelf adjacent to Siberia, soundings were extracted from a suite of navigational charts published by the Russian Federation Navy, and used to develop contours. Bathymetry in the Gulf of Bothnia was derived from a compilation by Seifert and Kayser [1995]. Contours were extracted from the GEBCO Digital Atlas (GDA) [IOC, IHO, and BODC, 1997] to supplement the database in the southern Norwegian-Greenland Seas, in Baffin Bay, and in some areas of the Canadian Arctic. Land relief was derived from the USGS GTOPO30 topographic model [U.S. Geological Survey, 1997], with the exception of Greenland, where the model developed by the Danish National Survey and Cadastre (KMS) was used [Ekholm, 1996], and Alaska, where release 1.1 of the GLOBE topographic model was used [GLOBE Task Team, 1999]. Coastline definition was provided by the World Vector Shoreline (WVS) in all areas except Greenland and northern Ellesmere Island, where an updated coastline was available from KMS.
Methods
2008
N
0
1000
50
F
Map Production
NOAA launches a seafood facts website: FishWatch.noaa.gov.
O
UK NU
NOAA completes the U.S. tsunami detection network after deploying the final two tsunami detection buoys in the South Pacific.
134
D
d
N 100°
k
60
NOAA provides its Earth observation data at no cost to users worldwide.
oria
in
Did You Know
ac
Vict
KING WILLIAM I
Original soundings were corrected for sound velocity using Carter's Tables, or CTD (Conductivity, Temperature and Depth) profiles where available. Subsequently, all data (digitized isobaths; land and marine relief grids; point, profile and swath observations; and vector shorelines) were imported into Intergraph's Geomedia Professional, with projection parameters set to polar stereographic on the WGS 84 ellipsoid, and with true scale at 75º N. Outliers, cross-track errors, and the fit between isobaths and original observation
2008
N
70°
You can think of OIA as a communicator and orchestrator for an agency that crosses many lines, from international boundaries to technical and scientific disciplines. Sometimes the lines are within the federal government. “We do quite a bit with the National Security Council, representing NOAA at various NSC meetings,” Karl-
B
80°
Cutting Across the Lines
son explained. Meetings with other federal entities whose work touches the international sphere are common as well. OIA also coordinates for the International Affairs Council, a council within NOAA that meets once a month to address administration policy, high level inter-agency, and national issues that affect NOAA. Sometimes the lines are broader policy. While NOAA takes its cues and direction from American political leadership, it has its own voice, self-direction, and priorities. The most important of these are reflected in NOAA’s 7-Year Roadmap for Research and Development. OIA’s directors and international affairs specialists provided input for the roadmap, and communicate its imperatives to other government agencies and the public at home and abroad. NOAA’s Research and Development Vision Areas for 2020-2026 include an emphasis on hazardous weather, ecosystem health and management, and data collection and modeling.
Bas
“Anything that is cross cutting or has implications for NOAA as a whole is where we typically operate,” Karlson said, “so that there are not too many [NOAA line offices] competing with one another.”
en uss Rasm
T
he atmosphere is global. Oceans are global. Weather is global. These fundamental elements of life on earth, as well as nearby space, are at the core of the work the National Oceanic and Atmospheric Administration does. They’re even in the agency’s name. “We have to be engaged internationally. We focus on issues that go beyond our border. NOAA is an international agency every bit as much as a domestic one,” said Dann Karlson, deputy director of NOAA’s Office of International Affairs (OIA). OIA works to demonstrate that engagement by enlisting agency partners around the world on a daily basis. It is also the point of contact between America’s political leadership and NOAA leadership. The Office advises the Under Secretary and other NOAA leadership elements on international policy issues. Input from NOAA’s line offices goes up the chain to the agency’s leadership via OIA, ensuring that its international engagement is consistent with U.S. foreign policy, and that U.S. foreign policy furthers NOAA’s goals as well.
L
data wer with sou
After ins (Generic process fitting a was exp discrepa for resid
Final vis dimensi renderin problem segmen
Grid Av
The grid of 2.5 x 2 These g preparat
Acknow
Numero U.S. Arc arranged Commit Neil Guy the U.S. Dick He Foundat Martin J Johnson the IBCA
180°
170°
170° KIVAK
ANADYRSKIY GULF
160°
160°
E
Ber
NOM
PENINSULA
hneva
Str
C. Dec
ai
Cape
CHUKOTSKIY
ing
les
of Wa
e Princ
t 15
0°
0°
R.
15
D
on Yuk
0°
14
N
F
O
R
E
M
A
VANKAREM
CHUKCHI SEA PEVEK
E
G
N
A
R
Close relationships foster quality research and the benefits that come from harmonizing standards for how R&D is done. OIA reinforces messaging about the practices and standards that the agency’s line offices utilize in-house and with international researchers. Research plans and initiatives are communicated both to widen the net of R&D of interest in the global scientific community and to avoid duplication of effort where possible.
A
I C
Ch aun ska ya Gu lf
Ko
AM
BA
ly m
14
. aR
0°
RC
HIK
S
K O
O R
VRANGELYA I
B
T
I
R.
S
R
a
A
E
Bar
E
B
ro
In
0° 13
d ig
w
ir k
Pt.
Co
lv il
le
R.
U
E
T
I
S
E
T
A
T
S
TA
BE
A
O UF
SH
RT
S
ELF
R R A
D
E
IS
.
I
I
50
0
V
N
E
I
E
nd
S
L E
D
A N
B
E
E
25
00
G
V
O
N
D
Oden Spur
I
I
R
A
L
E
A S
G
S Y
ID
B A
E
N
L E K
I
N
K
AI
A
L
S
PL
G
L
Y
A
SA YS
KARA
NORIL'SK
Yenisey R.
RISE UST PORT
S NT RE
K
S T.
A N N A
TR OU GH
00
R
S
A
E
GYDANSKY
A
S
S E A
A
0
A
0
20
0
0
II VI
20
0
200
0 -20
IK
20
0
ED FR
I
A
G
N
1000
0
A
KO
0 -20
200
0
L
a
00
0
a
15
20
R
E
N
S
E
A
T
S
r d R i d g e
Bay of Pechora
BA NK
D
0 20
°
GE ES E
200
s X N
IA T
0
0
R
GREENLAND
Kolguyev I.
N NI KA H RT ANK NO B
S E A
H
G
Pe
MU RMA N R ISE
-200
0
rdka
pp
500
No
1500
50
RØST
E O
RI
NG
TEA
U
R
N
A PL
N
E G
V
I D
0 3000
250
2000
00
I R
TRAENA BANK
G E
JAVIK
RÿRVIK
BANK
S E A
R.
I
H
°
40
IK
NARV
Bay of O ne
I
KEM
ga
Scale: Map projection: Standard parallel: Horizontal datum:
SK
OR
OM
BEL
G U L F
°
30 O F B O T H N I A
Bathymetric contours are at 200, 500, multiples of 500 meters depth to 3000 meters, and multiples of 1000 meters deeper than 3000 meters. Depths are in corrected meters (lake depths are not indicated). 20°
Bathymetric and topographic tints (heavy bars denote contours displayed on the map)
The International Bathymetric Chart of the Arctic Ocean, a cooperative effort of many partnerships with national and international entities. Seabed 2030 (IBCAO) has as its goal the mapping of THE INTERNATIONAL BATHYMETRIC CHART OF THE ARCTIC OCEAN the world’s ocean floor. 10°
-5000
10°
-4000
-3000
-2500
-2000
-1500
-1000
-500
-200
-100
-50
-25
-10
0
50
100
200
300
400
0°
data were checked. Suspicious soundings were removed and, where contours showed major discrepancies with soundings, the contours were adjusted manually to agree with trackline data.
NOAA NCEI IMAGE
After inspection all data sets were exported to an XYZ coordinate system for further manipulation with GMT (Generic Mapping Tools) public domain software [Wessel and Smith, 1995]. Initially, the data sets were preprocessed with the GMT block-median filter, after which they were gridded at a cell size of 2.5 x 2.5 km by fitting a surface of continuous curvature to all points with a tension parameter set to 0.35. The resulting grid was exported to Intergraph’s MGE Terrain Analyst (MTA) for detailed inspection, and for the identification of discrepancies that had to be addressed in the input data set. The data were then regridded and reinspected for residual discrepancies. This process was repeated until the results were judged to be satisfactory.
“We work closely with other countries on research and development, whether that’s with bilateral partners like Canada or Australia, or
Final visualization of the gridded data was performed by means of the Fledermaus software for threedimensional visualization. Artificial illumination was applied to the grid in order to produce a realistic rendering of relief on the seafloor and on the surrounding land. This procedure also emphasized minor data problems that had escaped previous corrections, such as isolated observation errors and mis-levelled track segments. These were eliminated from the map image.
Grid Availability and Format
The grid that was used for the construction of this map can be obtained in two forms: Cartesian with a cell size of 2.5 x 2.5 km at 75ºN, and Geographic with a cell size of one minute of latitude by one minute of longitude. These grids, along with detailed descriptions of their formats and the techniques employed in their preparation, can be downloaded at: http://www.ngdc.noaa.gov/mgg/bathymetry/arctic/arctic.html
Acknowledgments
Compiled by Martin Jakobsson*, University of New Hampshire, USA Ron Macnab*, Geological Survey of Canada (Retired) Norman Cherkis*, Five Oceans Consultants, USA Hans-Werner Schenke*, Alfred Wegener Institute, Germany
Numerous individuals and institutions contributed to the construction of this map. George Newton of the U.S. Arctic Research Commission was instrumental to the release of historic submarine data. The following arranged support on behalf of their respective agencies: Odd Rogne of the International Arctic Science Committee (IASC); Dmitri Travin of the Intergovernmental Oceanographic Commission (IOC); Rear Admiral Neil Guy of the International Hydrographic Organization (IHO); Commander John Joseph and Chris Butler of the U.S. Office of Naval Research International Field Office; Anders Karlqvist of the Swedish Polar Secretariat; Dick Hedberg of the Swedish Polar Committee; Jan Backman of Stockholm University. The Ymer-80 Foundation funded digitizing of contour maps. NOAA Grant NA97OG0241 supported the contribution by Martin Jakobsson in the preparation of this map . John K. Hall of the Geological Survey of Israel, G. Leonard Johnson of the University of Alaska, and George F. Sharman of NOAA/NGDC reviewed the printed version of the IBCAO map. This map was printed with support from ONR Grant N00014-2-02-1-1120.
Contributions by Robert Anderson, U.S. Navy Arctic Submarine Laboratory Harald Brekke, Norwegian Petroleum Directorate Bernard Coakley*, Geophysical Institute, University of Alaska, USA David Divins*, National Geophysical Data Center, USA Margo Edwards, University of Hawaii, USA Valery Fomchenko*, Head Department of Navigation and Oceanography, Russian Federation Garrik Grikurov*, VNIIOkeangeologia, Russian Federation Jennifer Harding, Geological Survey of Canada Hilmar Helgason*, Icelandic Hydrographic Service Martin Klenke, Alfred Wegener Institute, Germany Morten Sand*, Norwegian Petroleum Directorate John Woodward*, Royal Danish Administration of Navigation and Hydrography *Members of the IOC/IASC/IHO Editorial Board for IBCAO
1:6 000 000 Polar stereographic 75° N WGS 84
Solid earth topography under the Greenland ice cap has been derived as contours from the Bamber et al [2001] 5x5 km grid model and added to the chart as dashed contours (-500, -200, 200, 500, 1000, 1500, 2000 m) and a solid (0 m) contour, all in gray.
20
HALTEN
A
na Sev Dvi
0
A
200
°
1500
10 500
REYK
RDUR
E
T
R
G
JA
50
REYR
DISFJÖ
K
LS
GE
Bay of Duna
I
AKU
SEY
200
Gulf of Kandalakcha
O
20
N
BASIN
S V E R I G E
ABYSSAL PLAIN
30
I
S
Sÿ
TROM
AN
H RK
DUMSHAF
BANK
I S L A N D 20
E
A
E
E
°
Mezen R.
E
NORWEGIAN
MA
00
S IN E O
L
B
PLATEAU
K
0
0 50
N
G
20 0 N R IDGE
G ID R Y
ICELANDIC
E
IS
I T
A
R S T R
ZO
200
N M D E
K A R
MEZEN
P E N I N S U L A
M
00
D
2500
0 10
AN
00 20 00
RE
R
S
O
50
15
H N M O
U
1000 1500
°
TU
YE
E
200
40
C
S
00 20
LIK
00
A
W
00
00
SA
10
FR
N
N
K O L S K I Y
Y GLØ FU NK BA 0 20
I A
YE
Bay of Mezen
SK
M
E
R
0
10 15
AS
A
Jan Mayen
G
Ve stf jor de n
200
q
I D
O
50
2000 1500
e
0 i tt i va
M
AN
M
UR
00
N
W
200 0
ÿ RD
25
JA
50 rt
°
1000
1500
2000
1500
LAND
ng
AN ISTI CHR
IXs
Ka
G KON M
ST KY
R.
0
VA
AM
o ra
Bay of Tscheskai
15 00
G
ch
Øya Ørn
20 Bj 0
ABYSSAL PLAIN
R.
60
N A L
0 20
200
IS
K NK BA BAN
0
N
A YA Nÿ NÿY BJØR
00 15 00 20 00 00 25 30
20
O
ABYSSAL PLAIN
G R E E N L A N D
20
EL D-IC AN NL EE GR
ty, ne h's nd on
70°
20 200
-200
A
ER
Y
N
L
0
M
A
BOREAS
200 500
he as sk pt
H
C
0
cal he ap 9]. 6; he ed as tal nd
0
1000
K
0
et
gs ns nd ile
20
Ø
R
50
s VI
G
E
s
U
D
Z
K
I
00
R
15
E
1000
D
G
Ob
I.
200
0
E
1000
R
O
LA
-20
0
ND
500
500
500
200
R
BANK
O
K
N
AMDERMA
Vaygach
g
500
T
A
B
BELGICA 500
90°E
NYDA
ra
SPITSBERGEN
Molloy Hole
Q
NA
K
T
F
O
N
s
NOVYY PORT
Ka
v
50
AN
IS
X
I
D
y
of
o
M
M
D
L
N
P E N I N S U L A
H
R
Y
0
0
20
UU
200
0
-20
0
A
of T a z
Ob
Ba
20
-200
0
of
A L Y
A
20
YERMAK
200
-20
500
50
T
V
0
500
K Y ST
0
UPERNAVIK
0
PLATEAU
A L
lf
M Z E
0
20
Y
0
O
200
A
KOST
B
N
500 20
200
Gu
Y A M
50
50
50
0
L A N D
00
40
N
500
50
0
20
0
0
N
IOSIFA
V O R O N O V P L A T E A U
1000
Ba y
PENINSULA Ostrov Belyy
Y A N O V A
I
200
F
ZEMLYA FRANTSA
E
F
0
A
UG
20
2000
B
R A S M U S S E N
se
N
-200
-20
K N U D
LA
1500
Ri
500
1000
up Jes
rris Mo
Seabed 2030 is a good example of an effort that will need all hands globally to be a success. Seabed 2030 is a collaborative project that aims to bring together all available bathymetric data to produce the definitive map of the world ocean floor by 2030 and make it available to all. It is often said that we have more accurate maps of the surface of the moon than we do of the world’s seabed. It will take 10 years to fully map our seafloor in basic fashion (about 20 percent of the global ocean floor has been mapped as of June, 2020). Part of the initiative’s focus is on identifying seabed resources. Among these is an increasingly important vein of metals for the battery electrification energy transformation that elements of the world community are trying to advance. The effort to scoop manganese and other metals for batteries off the seafloor has been called a modern gold rush. 65°
70°
T R O U GH
30
Basin
a R.
B
AB
75°
as in
CENTRAL
E
L I N C O L N
it
Kane
500
M
O P
0 200
BA
500
0
20
ALERT
E
A
E
S D
N
M A 4000
d
D
O
L
200
N
500 1000 1500
A
Stra
Y
L
R
A
500
L
Seabed 2030
S
IN LA
P
R
A K
SIB ABYS ERIA SAL PLAIN
E G ID
R
A
M
N
un t Vis co
PH AL 1000 1500
S
Nares
V OR O N I N
200
I
A
80°
N
Soun d
M
85°
U
M
500
E
N
I
00
R
N
20
E
R
Py
1000 1500 2000
O
S
M
VE
A
2500
D
S
R.
I
NORTH POLE
2500
N
E
Z
SE
3000
A
Sound
L
S
L
RE
ga
100°
T
S
S
at an
PENINSULA
B
S ou er t
Al b ce
Me l ville
A
20 500 0
R
I
KA
Jones
oun ter S Lancas
D
E
V
O
O
EU
BYLOT I
N
110°
D
H H E I B E R G
I S L A N D
L
E
S
DEVON
E
F
NE
T
NG
E
RI
F
LE
le t
ISLAND
R.
Pr in
k
R
ne
B
In
O le
A
EL
RESOLUTE
Kh
TAYMYRSKIY
15 1000 00
Z
t
A
A
00
I
Barrow Strait
en
20
300 0
L
I
I
A X E L R eg
Lena R.
E
E 2000
Adolf
I S L A N D
BRODEUR PE NINSUL
ha
N
BATHU RST Peel Sound
o rk
S
N
E
PRINCE OF WALES I
S O M E R S E T
Bu
V
I
I S L A N D
Sea
Franklin Strait
of
O
IY
K
Bay
K
E
WRANGEL
Prince
in ce
S
T
E
RICK
M E L V I L L E
Gustaf
Pr
IR
ABYSSAL PLAIN
I
U
PAT
D
C H A N N E L
00
IB
P
it
E
N
S
A
ra
re
Q
N
C K T O
O
L
lu
NC
A
V
E
'C
PRI
M
200
L
O
C
3000
N
S
E
2500
T
St
ait
A
S
Wa les Str
I
0°
V
EEV DEL LAIN MEN L P SSA
A
ce of
R
12
I
O
500
0
00 10
R
1000
I
E
1500
S
H
2000
S
C 50
ABY
B
ISLAND
Pr in
O
R
R
0 20
U
lf
BANKS
T
BO
N
A
K
L P LAIN
en
CHUKCHI PLATEAU
A
ds
CHUKCHI ABYSSAL PLAIN
D
un
2000
A
Am
Gu
Y SSA N OR T HWIN D AB
N
S E A
Cape Parry
NORTHWIND RIDGE
IN PLA SAL BYS D A A CA NA
A
0
20
PAULATUK
E
O
C
B E A U F O R T
Bathurst
S
500 10 00 1500
TUKTOYAKTUK
Cape
A
200
Macken zie Bay
. ckenzie R
I
80°
Pt.
E
tin
G
Mar
Data Contributions
The IBCAO compilation is based upon data sets that were acquired and/or provided by the organizations listed below, and which were made available through individuals whose names are shown. References are also listed for the published maps and digital compilations that were used. We thank the contributors of these data sets for their assistance in making this compilation possible.
Printed Maps
Digital Compilations
Bamber, J.L., Layberry, R.L., and Gogenini, S.P., 2001, A new ice thickness and bed data set for the Greenland ice sheet 1: Measurement, data reduction, and errors. Journal of Geophysical Research v. 106, no. D24, p. 33773-33780. Ekholm, S., 1996, A full coverage, high-resolution, topographic model of Greenland computed from a variety of digital elevation data: Journal of Geophysical Research, v. 101, no. B10, p. 21,961-21,972. GLOBE Task Team, 1999, The Global Land One-kilometer Base Elevation (GLOBE) Digital Elevation Model, Version 1.0. National Oceanic and Atmospheric Administration, National Geophysical Data Center, Boulder, Colorado.
600
700
800
1000 (Meters)
IHO Data Center for Digital Bathymetry, U.S. National Geophysical Data Center, National Oceanic and Atmospheric Administration, Boulder, Colorado. IOC, IHO, and BODC, 1997, GEBCO-97: The 1997 Edition of the GEBCO Digital Atlas, published on behalf of the Intergovernmental Oceanographic Commission (of UNESCO) and the International Hydrographic Organization as part of the General Bathymetric Chart of the Oceans (GEBCO): British Oceanographic Data Centre, Birkenhead (this publication includes a CD-ROM). Seifert, T., and Kayser, B, 1995, A high resolution spherical grid topography of the Baltic Sea: Meereswissenschaftliche Berichte, Institut fur Ostseeforschung, Warnemunde. U.S. Geological Survey, ed., 1997, GTOPO30 Digital Elevation Model: U.S. Geological Survey, EROS Data Center, Sioux Falls, South Dakota. U.S. National Geophysical Data Center, National Oceanic and Atmospheric Administration, Boulder, Colorado.
with the European Union and individual countries within it,” Karlson said. “Many countries share the goal of close relationships on R&D projects.” Canadian Hydrographic Service, 1979, General Bathymetric Chart of the Oceans (GEBCO) Sheet 5.17: Canadian Hydrographic Service, Ottawa, scale 1:6,000,000. Cherkis, N. Z., Fleming, H. S., Max, M. D., Vogt, P. R., Czarnecki, M. F., Kristoffersen, Y., Midthassel, A., and Rokoengen, K., 1991, Bathymetry of the Barents and Kara Seas: Geological Society of America Map and Chart Series, MCH047, Boulder, Colorado, scale 1:2,313,000. Head Department of Navigation and Oceanography, All-Russia Research Institute for Geology and Mineral Resources of the World Ocean (VNIIOkeangeologia), and Russian Academy of Sciences, 1999, Bottom relief of the Arctic Ocean: Head Department of Navigation and Oceanography, St. Petersburg, Russia, scale 1:5,000,000. Head Department of Navigation and Oceanography, 1989-1998, Hydrographic Charts: 11139, 11140, 11142, 11143, 11150, 11152, 11155, 12230, 12334, 12335, 12344, 12348, 12401, 12404, 12407, 12417, 12428, 12433, 13317, 13410, 13420, 13421, 13425, 13426, 13432, 14305, 14321, 14403, 14404, 14411, 14420, 14421, 14427, 14433, 14434, 15430, 16442, 18330, 19448, 19453, 698, 948-955, scale 1:10,000 to 1:700,000. Matishov, G. G., Cherkis, N. Z., Vermillion, M. S., and Forman, S. L., 1995, Bathymetry of the Franz Josef Land Area: Geological Society of America Map and Chart Series, MCH080, Boulder, Colorado, scale 1:500,000. Perry, R. K., Fleming, H. S., Weber, J. R., Kristoffersen, Y., Hall, J. K., Grantz, A., Johnson, G. L., Cherkis, N. Z., and Larsen, B., 1986, Bathymetry of the Arctic Ocean: Geological Society of America Map and Chart Series, MC-56, Boulder, Colorado, scale 1:4,704,075.
500
Contributing Organizations Canada
Canadian Hydrographic Service Geological Survey of Canada Royal Danish Administration of Navigation and Hydrography: Nielsen, A. Alfred Wegener Institute Icelandic Hydrographic Service Norwegian Petroleum Directorate Head Department of Navigation and Oceanography VNIIOkeangeologia Sweden Stockholm University Swedish Polar Committee: Hedberg, D. Swedish Polar Secretariat: Karlqvist, A. United Kingdom Royal Navy Submarine Force United States Lamont-Doherty Earth Observatory: Hunkins, K., Coakley, B., Langseth, M., and Hall, J.K. National Geophysical Data Center: Sharman, G. and Loughridge, M.S. Naval Research Laboratory: Crane, K., Fleming, H. S., Cherkis, N.Z., and Kovacs, L. C. U.S. Geological Survey: Grantz, A. U.S. Navy Submarine Force Denmark Germany Iceland Norway Russia
Key Software Applications GMT (Generic Mapping Tools): IVS (Interactive Visualization Systems): Intergraph:
Wessel, P., and W. H. F. Smith, 1995, New Version of the Generic Mapping Tools Released, EOS Trans. AGU, 76, 329. Fledermaus 3D visualization and analysis software Geomedia Professional, MGE Terrain Analyst (MTA)
Research Publication RP-2 National Geophysical Data Center Boulder, Colorado USA 80305 2004
2008
NOAA Ship Okeanos Explorer, “America’s ship for ocean exploration” commissioned.
2008
NOAA establishes the Unmanned Aircraft Systems program within NOAA Research.
135
NOAA’s mission as a steward of the oceans and their resources demands it pay attention. “For something that would have significant ramifications for NOAA,” Karlson confirmed, “our seat on the U.S. delegation to the International Seabed Authority is important, as is our participation in UNCLASS (United Nations Convention on the Law Of the Sea). They define how [undersea] boundaries are defined and how the surveying is done that determines what a country’s rights are within those boundaries.” While resource rights have traditionally been associated with fisheries management and, at times, undersea oil deposits, deep water metals extraction is adding a new competitive and environmental dimension to resource exploitation and protecting the seas. “Through our ocean exploration and through our partnerships with other countries, we’re trying to assess the impact [this activity] will have before the gates really open up – before this gold rush to get these polymetals up off the ocean floor,” Karlson said. He adds that NOAA recognizes the balance between understanding the environmental impact of such activity and being mindful of the positive economic stimulus extraction of these resources can provide to countries, particularly small island states that have territory but little in the way of sustainable economies beyond tourism or fishing. These kinds of issues are what draws NOAA outside of the U.S., and why its relationships with myriad international bodies, with foreign countries, and with regions where
2008
Did You Know NOAA services support more than 1/3 of the United States gross domestic product. American leadership is a global good are so important.
Spinning Leadership Through a Web of Relationships How many international organizations do OIA and NOAA’s individual line offices interact with? “It’s likely upwards of 100,” Karlson said. “A single line office like NESDIS (NOAA Satellite and Information Service), which is focused on satellite data, probably participates in a dozen organizations in which they’re a key player.” The same could be said for the NOAA Fisheries line office, which participates in a variety of regional fisheries management organizations (RFMOs). For example, there’s the north Pacific RFMO, the western and south Pacific RFMOs, and fisheries bodies for individual species such as tuna. There’s the familiar International Whaling Commission as well. NOAA’s Oceanic and Atmospheric Research International Activities Office has membership in many more. How do the agency, OIA and the line offices keep track of it all?
The Ship Strike Reduction Rule is implemented to protect North Atlantic right whales and other cetaceans from ship strikes.
136
Basically, OIA, and each line office, has its own international affairs specialists and analysts, Karlson explained. “As with the line offices we [OIA] have both thematic and geographic portfolios. The international bodies that I represent us on include the UN Office of Disaster Risk Reduction and Resiliency. I engage with them very closely. Within my geographic portfolio I focus on Australia, New Zealand and the Pacific Islands, engaging closely with the Secretary for the Pacific Community and the Secretary for the Pacific Regional Environmental Program. We have international affairs specialists who engage with these organizations as well.”
Pacific Partnerships Each of NOAA’s international partnerships contributes to a whole, a web of understanding and cooperation across the globe, which lends NOAA influence and leadership opportunities that affect American national security. Nowhere is this of greater value than the geographic area that Karlson oversees – the Pacific. “NOAA is seen as a major supporting element of the broader Indo-Pacific strategy. We’re rolling out new initiatives, rededicating funding to projects throughout the Pacific, and we have aid from the State Department to assist in that effort.” NOAA’s role hinges on its credibility. The agency has been perceived as a trusted partner in the Pacific, seen as a relatively neutral, subtle, positive force in regional affairs. Its decadeslong support of regional countries in natural hazards resilience, fisheries
2009
Dr. Jane Lubchenco becomes the first woman and the first marine ecologist to lead NOAA.
U.S. COAST GUARD PHOTO BY COAST GUARD CUTTER MELLON
A boarding team from the Coast Guard Cutter Mellon (WHEC 717) approaches a fishing vessel on the high seas in January 2019 while patrolling in support of counter-Illegal, unregulated and unreported fishing and global security missions. Mellon’s crew is supporting the protection of international fisheries on the high seas and enforcement of the Western Central Pacific Fisheries Commission (WCPFC).
management, and countering illegal fishing (in which China is a major transgressor) has earned it respect, and the data and expertise it has shared have been grounded in science. “The fact that scientific principles are at the core of our agency is why we are so widely respected globally. We are viewed as the softer side of U.S. government diplomacy, and we want to make sure we uphold our scientific principles,” Karlson said. “If we’re doing a research cruise
in the Pacific or the Caribbean, we want to ensure understanding that it is truly being done for research purposes – not just for political capital or political gain. Yes, it does improve our relations, yes it may serve some other purposes.” In view of its web of international relationships, safeguarding NOAA’s reputation as an honest broker of scientific data and research is as important as it has ever been. But the agency maintains its positive reputa-
tion via more than the distribution of data or interaction with international bodies.
Hurricane Warning, Tsunami Readiness, and Chatty Beetles NOAA’s tracking of and involvement in the discussion of changes in the global climate naturally touches on sea level-rise, an issue watched closely by Pacific island states. For
421 U.S. citizens were saved in 2019 as a result of the International Search and Rescue Satellite Aided Tracking System, or SARSAT, program.
2009
An uncrewed underwater glider successfully crosses the Atlantic Ocean, opening up a new world of ocean technology.
2009
NOAA Fisheries begins an initiative to strengthen partnerships with the recreational fishing community.
137
PHOTO BY EDWARD YOUNG, UCAR/COMET
NOAA GRAPHIC
low lying islands, land erosion and saltwater intrusion into freshwater supplies in combination with intensifying severe weather events (storms/cyclones/tsunamis) are direct threats. NOAA, specifically the National Weather Service, is well known for providing advance weather warnings for the United States. In the Pacific, the agency is not only providing advance warning, but helping nations in the region improve their own early warning communications systems. “We actually operate weather service centers in three countries in the Pacific – Micronesia, Palau, and the Republic of the Marshall Islands” Karlson said, “NOAA has a physical presence there. We employ local citizens. We train them to become meteorologists and we provide the actual infrastructure for their weather forecasting.” NOAA’s Central Pacific Hurricane Center works to help islands better understand tropical systems and to bolster their resiliency. Through the International Tsunami Information Center, NOAA runs a tsunami training and readiness program that helps with contingency planning and recovery. NOAA even provides free ruggedized communication devices, called “Chatty Beetles”, to Pacific region nations and other countries around the globe. These portable Iridium satellite terminals (satellite phones) permit text-based alerts and messaging in remote locations, where communication options are limited.
NOAA also provides the infrastructure for Cospas-Sarsat, an
internationally available satelliteenabled search and rescue system. The Search And Rescue Satellite Aided Tracking (SARSAT) System detects and locates mariners, aviators, and recreational enthusiasts in distress almost anywhere in the world at anytime and in almost any conditions. SARSAT uses NOAA satellites in lowEarth and geostationary orbits as well
2009
2009
International Rescue
NOAA establishes the Ocean Acidification Program.
138
Above: NOAA has worked with a network of international partners to expand its national tsunami warning system into an international one. Left: A “Chatty Beetle” device employed by NOAA to enable Pacific region nations and other countries around the globe to receive weather warnings and communicate to NOAA personnel or others through the Iridium satellite network.
as GPS satellites in medium Earth orbit. The satellites relay distress signals from emergency beacons to a network of ground stations and ultimately to the U.S. Mission Control Center (USMCC) in Suitland, Maryland. The USMCC processes the distress signals and alerts the appropriate search and rescue authorities as to who is in distress and, more importantly, where they are located. NOAA-SARSAT is a part of the international Cospas-Sarsat Program, to which 41 nations and two independent SAR organizations belong. NOAA works with all of the Cospas-Sarsat countries very closely to ensure that something as critical as saving somebody in distress is fully supported.
National Severe Storms Laboratory conducts the first phase of the largest tornado field experiment in history, aiming to answer detailed questions about how, when, and why tornadoes form.
PHOTO BY ANDREA PAZMO VIA WIKIMEDIA COMMONS
The Popocatépetl volcano, located near Mexico City, Mexico. NOAA is responsible for volcanic ash advisories that could pose a danger to air travel for aircraft flying in and out of Mexico City’s airport.
International by Nature Whether acting as an instrument of national policy, disseminating scientific research and data, or providing infrastructure in regions where it would otherwise be absent, NOAA’s interna-
2010
tional activities keep OIA engaged and in touch with a variety of issues daily. “If people know about NOAA, they say ‘that’s cool, you get to do international affairs.’ I get that kind of reaction. Other times I get the question, ‘What’s NOAA?’ I go into my best explanation about what NOAA
NOAA mobilizes ships, aircraft, and personnel in response to the Deepwater Horizon oil spill in the Gulf of Mexico.
is. Usually the National Weather Service is the hook there. But when I tell people the work we do in international affairs for NOAA it generally triggers a nice reaction.” “NOAA does cool stuff.” It does, and that stuff is international by nature.
2010
NOAA Ship Okeanos Explorer participates in the first joint expedition by the U.S. and Indonesia to explore unknown deep-sea areas in Indonesian waters.
139
INTERVIEW
Dr. Kathryn D. Sullivan NOAA Administrator 2014-2017 Kathryn D. Sullivan
was under secretary of commerce for oceans and atmosphere and administrator of the National Oceanic and Atmospheric Administration (NOAA) from 2014 to 2017. She had previously served as NOAA’s chief scientist, and as deputy administrator and acting administrator. A graduate of the University of California and Dalhousie University, she holds a B.S. in earth science and Ph.D. in geology. She joined NASA in 1978, was a crewmember on three space shuttle missions, and was the first American woman to walk in space on Oct. 11, 1984. She was also a member of the Naval Reserve beginning in 1988, retiring as a captain in 2006. Following completion of her service at NOAA, she was designated as the 2017 Charles A. Lindbergh Chair of Aerospace History at the Smithsonian Institution’s National Air and Space Museum, and has also served as a senior fellow at the Potomac Institute for Policy Studies. On June 7, 2020, she became the first woman to dive to the Challenger Deep in the Mariana Trench, the deepest part of the Earth’s oceans.
2010
nation need NOAA? You know we live on this extraordinarily dynamic planet. And the United States of America in particular, with the size of its territory, the bounding by oceans – again our livelihoods, our public safety, our economies, our businesses are very, very strongly influenced by the conditions of the atmosphere and the ocean and the climate and weather and ecosystems that make our planet work. What NOAA does for citizens, elected officials, or businesses is stay very aware of the kind of issues and questions and hazards that the natural environment poses towards
2010
Dr. Kathryn D. Sullivan, during her tenure as NOAA administrator, 2014-2017.
society. And then, as a richly scientific agency, NOAA musters the measurements and analyses and the information processes that can transform scientific understanding of our planet and how it works into useful, actionable information that we can use in our everyday lives. So, I call NOAA America’s environmental intelligence agency.
A nearly 17,000-acre area encompassing Hurricane Earl marks the first flight of freshwater marshes, uplands, and an uncrewed aircraft system, NASA’s river on the shores of Lake Superior in Wisconsin Global Hawk, above a fully developed tropical becomes the 28th member of NOAA’s National cyclone. AOML and NASA researchers collect Estuarine Research Reserve System. data and images of Earl at 60,000 feet.
140
NOAA PHOTO
What does NOAA contribute to the nation? Why does America need NOAA? Dr. Kathryn D. Sullivan: It’s probably no exaggeration to say that NOAA is the one federal agency that touches almost every American’s life almost every day, and almost always in a way that helps them get through their day. I mean, you need only look at the value and importance of weather forecasts to the pleasure of our day, the safety of our day, the safety of our businesses, efficient operation of businesses – that alone would make my statement valid. So why does the
I think of the value to a president or a military commander of having good intel, a good picture, a good understanding of the situation that you’re confronting, and the dynamics of that situation and which way it might go. That rich picture, that rich painting of intelligence – reliable, worthwhile information – can help you understand where you are, what’s happening, what’s coming at you, and to think ahead and plan ahead to decide what course of action to take. In an advanced society like the United States in this day and age, and with the complexity and dynamics of our planet and our economy and our lives, environmental intelligence is actually vital to safety and success every single day. NOAA is certainly one of the country’s top environmental agencies, but I would argue it is the sole environmental intelligence agency. You served in the nineties as the chief scientist at NOAA and then later on, between 2011 and 2017, you were deputy administrator, acting administrator, and administrator. How did your position as chief scientist inform the latter 10 years as deputy administrator and administrator? It informed my later service in two key ways. My stint as chief scientist in the early nineties was my “first rodeo” at the national policy level and with the interfaces between the White House, Cabinet secretaries, Congress, and the agencies. So, it was a great learning curve – a steep learning curve at times – but a great learning curve
about the full range of NOAA’s work. As chief scientist, I focused mainly on guiding and shaping the scientific research and technology development investments and programs. I didn’t have to get directly involved in very much of either the White House dynamics or Hill politics. But the chief scientist position was an excellent one from which to watch and listen and observe and build a solid understanding of how those dynamics work – what the roles and responsibilities and motivations and tensions are between agencies and the Congress, between agencies and their departments and the White House, and how to navigate through those effectively to advance an administration’s agenda and the agency’s legally chartered mission. So, with four years of that sort of seasoning and background, I then went into other executive positions from 1996 to 2010. Those positions helped me hone my skills as an executive at different levels. So, when I came back in 2010 as the No.2 and then the No.1 chief executive at NOAA, I had a solid grasp of both pieces of the jigsaw puzzle. I had a well-formed and sophisticated understanding of the interagency, executive branch and legislative branch dynamics and processes, and I had more than a decade’s experience as a senior executive responsible for directing and steering organizations. What changes did you see in the organization and also in environmental issues between your first stint in the nineties
and your second in 2011 through 2017? Several come to mind. No.1 would be climate science. It’s often an overlooked little detail that I was actually first nominated to the position of NOAA chief scientist by President George Herbert Walker Bush, around April of 1992. And of course, he subsequently lost the November election. But it was his administration – a Republican administration – that issued the first substantive national policy on climate change, which stated clearly that the climate was changing – the scientific evidence was clear – and that the consequences for the country were potentially quite substantial. This made it important to support research to refine the future outlooks and reduce the uncertainties so that policymakers could better understand how to mitigate the risks or prepare the country to adapt to the consequences. So, “climate change” – in air quotes – was not a weaponized issue back then. And interestingly – and ironic amid today’s politics – that the teeing up of climate change as a potentially significant systemic threat the country needed to be ready for came from a Republication president. That dynamic had of course changed radically by the time I came back in 2010. Second, the hyper-partisanship and stridency generally of the country and in particular within the Congress, was also very different. I think I saw the starting steps of that evolution during my time as chief scientist, when the 104th Congress came along with Newt Gingrich
2011
The NWS begins to upgrade the NEXRAD radar network to add dual polarization capabilities. Dual polarization (using horizontal and vertical radar pulses) improves the identification of different precipitation types and amounts, as well as tornado debris and other non-weather targets, leading to more accurate forecasts and warnings.
141
as the speaker. Having paid an interested citizen’s attention to national policymaking since about sixth grade, I remember being struck by how notable a change of tone suddenly seemed to be getting into the equation. Now maybe it was not quite as notable and stark as it struck me. Maybe it was partly that I was standing closer to the scene than I ever had done before. But nonetheless, it really was rather striking to me. So that trend, unfortunately, has continued and become even more hyper-partisan. There’s much more denigration of science, dismissal of credentials and expertise now than back then. But those two factors – the weaponization of climate as a political wedge issue and the erosion of trust in science and expertise more generally – would be the ones that had the greatest influence on my second stint at NOAA. They not only affected what challenges came my way as deputy administrator and administrator, but also influenced substantially how I could respond effectively to those challenges. What were your priorities during your time as administrator? I really had a singular priority as administrator, and that was to really raise NOAA’s game in terms of how effectively it operated, how highly it was regarded, supported, and rewarded both from the executive branch and the legislative branch. When I came aboard in 2011, the satellite programs of NOAA were in rather a mess. I came in after the big divorce between the Defense Department and NASA
and NOAA over what had been an abortive attempt to produce just a single national weather satellite program instead of a defense one and civilian one. That effort began actually when I was chief scientist, and I was given the assignment of being part of setting up that experiment. But it failed badly, and it had unraveled completely by the time I came back. NOAA had not come out looking good. It had lost a lot of capability and talent as brain drain went towards the Defense Department, where the money was, and NASA, where the prestige was. As one of my colleagues put it, NOAA was basically in receivership. It was not very highly regarded on the Hill because it was sort of blamed for the debacle of the satellite program. So actually the job Jane Lubchenco hired me for was to pull the satellite program out of the ditch and get it back on its feet so we wouldn’t have a break in weather services. So, there was that. I needed to fix a bunch of technical and programmatic issues with the satellite program. That’s a couple billion-dollar program, by the way. So, it’s not chump change. Also, when I first got there in 2011, it was clear there was quite a schism between the political appointee leadership and the career ranks. It is my view that that is always damaging to both the policy agenda of a White House and to the agency in terms of its performance capability. Once I became the acting administrator, my first goal was to move the agency beyond that schism, and then to improve NOAA’s standing with the Office of Management
and Budget and with the Hill, so that we could start to get stronger support for the key thrust of the agency’s programs. So, I did not have a long laundry list of high priorities. My long-term priority was to make the White House, Congress, the public, and various other audiences understand NOAA not as a hodgepodge of pet projects that all want some money, but as “America’s environmental intelligence agency,” and identify a small set of high-level strategic thrusts. I believed that focusing on the four strategic thrusts we identified would give us the bounce that lets us strengthen and improve many of our program elements. I don’t think you advance by telling the world you’re doing 300 important things. You help the world outside of your walls understand the essence of what you are and what you do, and inspire or persuade them to support that. That’s how you lift the entire boat. What achievements or results are you most proud of that came about during your term as administrator? Well, we got the satellite programs out of the ditch. The NOAA/NASA relationship, which is vital to those programs, was really fraught, in a mess – we made that better. That was a combination of both high-level work that I did with my NASA counterparts and senior members of the agency, and strengthening the bench at NOAA. We got the budget support and approval needed for the specific satellite that was being built
2011
Following several weather disasters in 2011 that took hundreds of lives, NWS initiates the Weather Ready Nation campaign. WRN combines the resources of the NWS with communities, emergency managers, businesses, and the general public to encourage readiness, responsiveness, and resilience to extreme weather, water, and climate events.
143
at the time I came aboard, and that one got into orbit. Then we convinced Congress that continuity in that program was essential, and persuaded them to authorize the entire series instead of extending permission one satellite at a time. We managed slowly, but bit by bit, to get budget increases. Let me set one bit of context here. When budgets are tight, as they were throughout my tenure, both the White House and the Congress tend to see in NOAA just a couple of things that really have to get done. There has to be a weather service, and that requires satellite data, so those two are essential. And the fisheries stuff NOAA does is vital to coastal economies, so you probably have to do that. And although everything else that NOAA does, like all of its research, underpins those three activities, budgeters tend to regard those as optional, as programs that can be trimmed or even cut out altogether. So, we had to move these three strategic thrusts forward in order to shore up the strength of the research programs and the ocean science programs. I’m pleased that we actually made some good progress on those fronts as well. I’m also very proud of how the internal executive team, both the political staff and the senior career leaders, worked together. I had never seen NOAA function that effectively across the different operating divisions and across the political appointee to career staff. I think we really did manage to make the agency hum and hit its stride in a very productive and positive way. That takes a combination of
2011
program strategy and a lot of work on culture and people. I’m probably most proud of the progress we made in that area. Looking into the future, what do you think are the greatest environmental challenges we face in this century? I think of this on several different levels. One is the acute. In the short-term, the reality that the social and economic toll of severe weather is rising, due in part to the changing frequency and severity of events, but more so to population growth and the expansion of our cities and infrastructure. This is already problematic on lots of fronts, from tornado and hurricane damage to increased nuisance flooding in coastal zones, notably in Florida and the Hampton Roads area of Virginia. The second level is systemic, and here the biggest worry is systems failure. It’s the depletion of biological resources in the ocean through industrial scale fishing up and down the food chain – finning, killing tens of thousands of sharks per year just for their fins; taking out highly-evolved slow-growth species like tuna or, further down the food chain, taking masses of krill out of the ocean to make fish oil for pet foods, nutritional supplements, and the like. That’s kind of like cutting down all the grasses where you used to graze your cows and then wondering why your cows aren’t growing. On top of the general depletion of the ocean, there are the increasing pollution levels, ranging from the carbon dioxide that makes the ocean more acidic
A four-day tornado outbreak across 21 states and parts of Canada results in a total of 360 tornadoes, including a record 216 on April 27 alone. The outbreak kills 348 people, making it the deadliest day for tornados since 1925.
NOAA TODAY
to physical pollution, like the now famous great garbage patches. Beyond that is the potential of, if not system failure, certainly major regime change in the Earth’s climate system. I’m fond of saying that the issue with the Earth’s climate changing is not that the Earth is going to be in trouble. The Earth, this planet, will be just fine; no need to worry about it. The issue is the human societies and economies are going to be wildly disrupted. The fish stock you used to feed off has just migrated north as waters warm, and it’s now in my waters, not yours. Where do you go to replace that protein supply? Where the wheat belts used to be, where the breadbaskets used to be now can’t produce crops, et cetera, et cetera, et cetera. Those dislocations are likely to be severe, and also to creep up on us like the water slowly heating up around the frog in the pan. But they will occasionally smack us hard, because, as basic physics tells us, one of the consequences of the kind of change that is happening in the climate is that extreme events happen more frequently and they are more intense than what we’ve grown accustomed to over the past decades. So more shocks, more frequently and more intensely than your insurance models had ever anticipated, that your social fabric has ever had to withstand. The planet itself physically and chemically? It may become like Venus or Mars at some point, but there will be a planet. It may not be anything like the planet as humankind has known it. It’s the fate of the biological species living on this little orb that’s in question.
2011
The Shark Conservation Act improves the conservation of sharks domestically and internationally.
145
NOAA FUTURE
NOAA leadership drives the growth of benefits from healthy ocean and coastal resources. By Craig Collins
Lt. Cmdr. Ryan Wartick, NOAA Coast Survey navigation manager embedded with the Coast Guard, briefs Coast Guard personnel about NOAA surveys and data analyses following Hurricane Florence’s devastation in North Carolina on Sept. 14, 2018. Because hazardous port obstructions were charted in record time – under 24 hours – ports were able to reopen safely and quickly, lessening the impact on maritime transport, which makes up a significant part of America’s “Blue Economy.”
O
ur nation’s waterfronts, ports, and harbors have historically been centers of rapid industrial and urban growth, and have
2011
advanced critical national objectives by promoting energy exploration, fishery production, commerce, and recreation. Maritime transport is one significant part of America’s “Blue
Boosting American Seafood Competitiveness American wild-capture fisheries are among the best-managed and most productive in the world. In 2017, U.S. commercial and recreational fisheries generated more than $244 billion in sales and more than $110 billion in additional
NOAA’s Marine Debris Program launches a response to debris floating across the Pacific Ocean resulting from a devastating 9.0 earthquake and tsunami in Japan.
146
NOAA PHOTO
Powering the Blue Economy
Economy,” the benefits derived from perhaps the world’s biggest and most diverse economic frontier: a healthy ocean. Still in its formative stages, America’s Blue Economy includes seafood production, recreation and tourism, ocean exploration, and coastal resilience, and maritime transport alone adds 2.3 million jobs to the U.S. market, provides $373 billion in goods and services, and produces $617 billion in annual sales – far more than agriculture. NOAA is exceptionally qualified to lead this era of economic growth: As the nation’s leading students and stewards of the ocean, its people recognize the sea as the Earth’s largest life-support system, a resource requiring careful, evidence-based management. As devoted public servants, they have the expertise and competence to connect decision-makers and coastal communities with the data, products, and methods that will help them understand the value of their marine resources and sustainably develop them. By 2030, the global ocean economy is expected to double in value to $3 trillion, and NOAA has a plan to grow the American Blue Economy – to balance the needs of Americans with the health of the ocean.
NOAA FISHERIES IMAGE
NOAA FISHERIES PHOTO
U.S. commercial and recreational fisheries generate billions of dollars in sales and additional value annually and add millions of jobs to the market.
value, while adding 1.74 million jobs to the market. Since 2000, informed by sound science and innovative management practices, NOAA Fisheries has rebuilt 47 economically valuable fish stocks to sustainable levels, often years or even decades ahead of schedule, while
NOAA FUTURE
reducing the number of overfished stocks to an alltime low. The most significant threat to American seafood isn’t the U.S. industry, but the exploitation of its resources by unlicensed or fraudulent interlopers. Illegal, unreported and unregulated (IUU) fishing in U.S. waters, along with seafood fraud – misrepresenting seafood products to consumers – threaten the health of fish stocks, reduce consumer confidence, and unfairly compete with U.S. fishers who operate lawfully. In 2018, to ensure fairness for U.S. seafood producers, NOAA Fisheries launched its Seafood Monitoring Import Program, which establishes a chain of custody from where seafood is harvested to its entry in the U.S. market. The program protects the value of both domestic and imported seafood, requiring data on 13 imported fish and fish products identified as vulnerable to illegal fishing and/or seafood fraud. The world’s per capita seafood consumption has more than doubled since NOAA was founded in 1970. At the same time, its population has nearly doubled as well. Amid this rising demand, the United States is importing more seafood than ever, leading to a significant trade deficit. In 2017, a year in which the United States exported 3.6 billion pounds of seafood, it imported 6 billion pounds. Wild-capture fisheries cannot sustain this demand. Over the past 30 years, aquaculture – cultivating fin fish, shellfish, and algae – has begun to close the gap, increasing its share of global seafood production from 10 to more than 50 percent. It’s the world’s fastest-growing food sector. Despite advancements, American aquaculture is in its formative years, accounting for less than 1 percent of global production – but NOAA is leading an effort to expand it, encouraged in part by a May 2020 Executive Order (EO) promoting American seafood competitiveness and growth in federal waters. The EO prioritizes efforts to support the American seafood industry. The EO seeks more efforts to increase permit efficiencies related to offshore aquaculture and additional streamlining of fishery regulations. “By removing outdated and unnecessarily burdensome regulations; strengthening efforts to combat illegal, unreported, and unregulated fishing; improving the transparency and efficiency of environmental reviews; and renewing our focus on longterm strategic planning to facilitate aquaculture projects, we can protect our aquatic environments; revitalize our
2012
NOAA commissions state-of-the-art coastal mapping vessel, NOAA Ship Ferdinand R. Hassler, named for the founding superindendent of the Coast Survey (1770-1843), the precursor to today’s NOAA. The ship operates mainly along the Atlantic and Gulf coasts, Caribbean Sea, and Great Lakes in support of NOAA’s nautical charting mission.
147
NOAA PHOTO
NOAA FISHERIES PHOTO BY MARK DIXON
Above: Blue mussels grown on an offshore experimental farm site in Cape Ann, Massachusetts. NOAA is leading efforts to expand American aquaculture to help meet increasing global demand for seafood. Below: A crew member views Electronic Navigation Charts (ENCs) on the bridge of NOAA Ship Thomas Jefferson. NOAA is transforming its ENCs to be able to provide updated electronic imagery that can scroll continuously along a vessel’s entire route.
nation’s seafood industry; get more Americans back to work; and put healthy, safe food on our families’ tables.” NOAA’s effort to establish the scientific knowledge base for sustainable American aquaculture, while reducing regulatory barriers to production, is coordinated by its Office of Aquaculture. According to Danielle Blacklock, who directs this office, the growth of American seafood farming will be built on a solid foundation of science and stewardship. “We already have a strong industry when it comes to shellfish,” she said. Cultivation of algae – including kelp and other seaweeds – has also taken hold in Alaska and Northeastern waters. Fin fish farming in marine waters is currently only done by a handful of companies in the U.S., while in other countries it is a prominent food production system. “As NOAA and our partners provide the research and regulatory efficiencies to move offshore,” Blacklock said, “we will see opportunities for all types of marine aquaculture production to grow significantly.”
Safer, More Efficient Marine Transportation Over 95 percent of the cargo entering the United States arrives by ship at American ports. NOAA’s navigation services help support the $5.4 trillion in economic activity and 31 million jobs that rely on these ports, and are developed in collaboration with port operators. Navigation safety is NOAA’s oldest mission, dating to the 1807 founding of the Survey of the Coast. As today’s
NOAA FUTURE
Office of the Coast Survey phases out production of its traditional paper nautical charts, it is producing a new generation of navigation services and data packages tailored to the needs of mariners and port operators. Today’s Electronic Navigational Charts (ENCs) are updated weekly with critical corrections such as newly discovered shoals, debris, or other navigational hazards. NOAA is in the process of transforming ENCs, whose layouts have been based on the paper charts from which they were originally digitized. The result will be an updated electronic image capable of scrolling continuously along all parts of a vessel’s route, a merging of the 1,200 ENCs covering 95,000 miles of shoreline and 3.6 million square miles within U.S. coastal waters and its Exclusive Economic Zone (EEZ). With its new Precision Marine Navigation (PMN) program, NOAA customizes its datasets for individual port environments and packages them at a single online portal. The new PMN site features a map viewer that allows users to explore tides and currents; water depth; the shape of the seafloor and coastline; the location of obstructions or hazards; and other physical features of the port
2012
Superstorm Sandy makes landfall along the south shore of New Jersey. NOAA conducts navigation surveys to restore maritime commerce, aerial surveys to assist on-the-ground responders, and other storm damage assessments.
149
NOAA FUTURE
with us and have the same cloudbased architecture disseminating their navigation services.”
A saildrone observed at sea during 2019 NOAA Arctic missions. Saildrones were dispatched to the Arctic again in 2020 to conduct the first uncrewed hydrographic survey ever performed to assist in EEZ mapping efforts.
environment from their computer or smartphone. An Application Programming Interface allows shipboard users to integrate this data into onboard systems. In the summer of 2020, NOAA began issuing surface current forecasts in support of PMN, collected from NOAA-operated systems and automatically processed and uploaded into the NOAA Big Data Program cloud every six hours. These data are now being evaluated among users with different types of navigation software. Most of a vessel’s transit happens outside of a port. According to NOAA Corps Rear Adm. Shepard Smith, who directs the Office of Coast Survey, NOAA is participating in an effort to optimize long routes. In receiving ports, a vessel’s estimated time of arrival (ETA) is an intricately coordinated event, with schedules involving trains, trucks, labor, and other vessels. The typical way vessels assure their ETA is to speed through the first portion of their voyage, building confidence in
2013
an on-time arrival, and then gradually slowing. It’s an inefficient waste of fuel and money, Smith said, and produces more carbon emissions than necessary. “The most efficient speed for a ship to go on a voyage is the slowest constant water speed they can travel to make it there on time.” The Coast Survey is working with a coalition of international partners, NOAA’s Ocean Prediction Center, and the National Ice Center to produce models and provide digital navigation services that will help operators optimize route speeds over long transits. Industry investigations have indicated that optimized routes could reduce fuel consumption – and resulting emissions – by more than 10 percent. “If we could reduce that global energy usage by 10 percent, by improving the efficiency of routing, we now have something that has a global impact on our carbon loading of the atmosphere,” Smith said. “These coalition members would very much like to be operating in concert
The U.S. EEZ – an area extending outward up to 200 nautical miles from U.S. territorial seas where it retains jurisdiction over natural resources – is among the largest in the world, larger than the combined land area of all 50 states. With the advent of side-scanning multibeam echo sounders, NOAA has helped to lead a 21st-century transformation in the field of hydrography: measuring and describing the physical features of bodies of water. Still, we know remarkably little about the U.S. EEZ. More than half of U.S. and Great Lakes waters have not been mapped to modern standards. Knowing the depth, shape, and composition of the seafloor beneath U.S. waters is critical to understanding, developing, conserving, and managing offshore resources – including wildlife, energy resources, and the valuable minerals used to build everything from jet engines to cell phones. The United States imports nearly all of these critical minerals, which is a serious national security vulnerability. In November of 2019, the Trump administration directed NOAA and other federal agencies to develop a national strategy to map, explore, and characterize the U.S. EEZ and the Alaskan coastline – which, historically icebound for nearly the entire year, has emerged as a navigable seacoast. The strategy, developed by a task force co-chaired by NOAA Corps Rear
NOAA dedicates the Daniel K. Inouye Regional Center in Honolulu. The center integrates new facilities with historic preservation of four World War II-era structures, culminating in an environmentally sustainable, state-of-the-art, LEEDcertified campus.
150
NOAA PHOTO
Exploring and Mapping the U.S. EEZ
NOAA FUTURE
expanding the reach of U.S. hydrography, Leonardi said. “We don’t see a future without ships,” he said. “But we do see a near future, probably in the next five years, where we’ve operationalized these robotic vehicles to become force multipliers.”
Recreation and Tourism
NOAA PHOTO BY MATT MCINTOSH
A pair of surfers walk on the shore at sunset in Olympic Coast National Marine Sanctuary.
Adm. Smith and Dr. Alan Leonardi, director of NOAA’s Office of Ocean Exploration, aims to map the nation’s deep waters by 2030 and nearshore waters by 2040. It’s an ambitious goal, Leonardi said, that will require two important transformations. “It’s become abundantly clear that, A, the government can’t do this alone,” he said. “And B, we’re not going to get it done in a timely fashion using the technology that exists today.” The new strategy builds on existing public and private partnerships to pool capabilities and avoid overlapping efforts. A recent 5 percent increase in EEZ mapping, Smith said, was achieved largely through consolidating the hydrography of federal, state, academic, private, and non-government organizations. “A lot of those gains were achieved by gathering up data that already exists,” said Smith, “not from NOAA surveys, but from other scientific agencies, and getting them into the archive where they can be accessible.” The mapping strategy also will rely increasingly on new and emerg-
ing science and technology. Mapping the seafloor is painstaking and often tedious work, referred to as “mowing the lawn”: Surface vessels, sometimes aided by a remotely operated robot, sail back and forth across the ocean, scanning line after line. “To use ships with tethered robots to fully explore the U.S. EEZ will take centuries or longer,” Leonardi said. “If we use newer autonomous vehicles, it can likely be accomplished in decades.” In the summer of 2020, the Coast Survey dispatched four autonomous surface vehicles – saildrones, which have already proven useful for conducting fisheries surveys and other remote sensing operations for NOAA – to the Arctic, to conduct the first uncrewed hydrographic survey ever performed. The saildrones, equipped with side-scanning sonar, will conduct programmed bathymetric surveys and produce high-definition charts of the seafloor along Alaska’s North Slope. Saildrones and other uncrewed systems, operating on the surface and underwater, will likely play a role in
Americans love their coasts. Ocean-based recreation and tourism employ nearly 2.4 million people, and contribute about $124 billion to the annual U.S. gross domestic product. NOAA works on several fronts to support and enhance the economic and social benefits of coastal and ocean resources. NOAA’s research programs establish a link between healthy, clean coastal resources and increased tourism-related spending. Coastal cleanup projects, coordinated and supported by NOAA’s Marine Debris Program, help draw more tourists and recreational users to coastal communities. These users are protected by NOAA’s harmful algal bloom (HAB) forecasts, which map blooms, measure toxins, and provide water-quality data to coastal managers. The nation’s most iconic marine resources are protected by the 14 national marine sanctuaries, which generate about $8 billion annually for coastal economies. According to John Armor, who directs NOAA’s Office of National Marine Sanctuaries, the agency is involved in several efforts to maintain and even expand the appeal of the ecological and cultural assets it oversees. The Mission: Iconic Reef program, for example, is a historic multi-partner effort to restore parts of the Flor-
2013
NOAA takes delivery of Reuben Lasker, the agency’s newest high-tech fisheries survey vessel. The 208-foot ship supports surveys of fish, marine mammals, and turtles of the U.S. West Coast and in the eastern Pacific Ocean.
151
NOAA PHOTO
NOAA PHOTO
Above: A diver explores the wreck of the USS Monitor, located in the depths of Monitor National Marine Sanctuary. A pending proposal aims to expand the sanctuary that was established to protect the site of the sunken ironclad. Right: A team in Papahānaumokuākea Marine National Monument sits atop a massive pile of fishing nets, rope, and other debris cleaned from beaches in the monument. Such coastal cleanup projects, coordinated by NOAA’s Marine Debris Program, help to attract tourists and recreational users to coastal communities.
ida Keys National Marine Sanctuary, which protects the only barrier coral reef in the continental United States, and which has taken a beating from hurricanes, boat groundings, ocean warming, and pollution. “Several programs within NOAA, including ours, are working together to restore these seven reefs of the Florida Keys,” Armor said. “We’re going to restore them to a level that provides important services for the community, and that are needed to maintain a healthy ecosystem, which drives the local economy. It is just an unprecedented and visionary project we’ve embarked on.” Only one sanctuary has been added to the system in the past two decades – the Mallows Bay-Potomac River National Marine Sanctuary,
2013
about 40 miles south of Washington, D.C., designated in November 2019 – but the system has plans to expand opportunities for recreation and tourism. In May of 2020, NOAA submitted a proposal to bring 15 additional reefs under the protective umbrella of the Flower Garden Banks National Marine Sanctuary, off the Texas and Louisiana Coasts, where some of the world’s healthiest coral ecosystems are located. There is also a pending proposal to expand the Monitor National Marine Sanctuary, the nation’s first national marine sanctuary, established to protect the site where the ironclad USS Monitor sank southeast of Cape
NOAA FUTURE
Hatteras on New Year’s Eve 1862. NOAA is working closely with various stakeholders on the development of these exciting proposals. Not many Americans know it, but the area is also near what was known during World War II as Torpedo Alley, the Outer Banks waters where German U-boats sank more than 300 merchant ships and battled British naval ships before the United States entered the war. At least 65 wrecks have been identified in the area. “That is no less important to our democracy, to our history, than places like Gettysburg or Normandy or Pearl Harbor,” Armor said. “NOAA has an opportunity, through expansion of the Monitor National Marine Sanctuary, to protect the shipwrecks and also interpret the battlefield in a way that’s never been done before.” Meanwhile, proposals for new national marine sanctuaries in the Great Lakes region are moving forward: off the Wisconsin shore of Lake Michigan, and another off New York’s Lake Ontario shore. If designated and brought into the National Marine Sanctuary System, Armor said, each will protect cultural resources – merchant and military shipwrecks – as well as help tell the story of how cultures have been navigating these waters for thousands of years. “For the communities,” said Armor, “we’ll be shining a light on their rich historic resources, providing opportunities and incentives for people to travel to these places and enjoy them. And we’ll also be bringing more Great Lakes communities into the conversation about ocean conservation. I think this is a tremendous opportunity to add value not only to these communities, but to the National Marine Sanctuary System as a whole.”
The eastern population segment of Steller sea lions is removed from the Endangered Species list.
153
NOAA FUTURE
Stewards of the Ocean
Leading the way to cleaner, healthier, more sustainable oceans By Craig Collins
F
2013
A NOAA Fisheries team researching Pacific Leatherback turtles homes in on a previously tagged individual to recover behavioral video data. NOAA strives to preserve, protect, and restore the health of the nation’s ocean resources.
Shelf, and many kelp-dependent fish and wildlife have returned. The transformation of an underwater wasteland into a healthy, resilient ecosystem was one of many small victories engineered in recent decades by NOAA and its partners in the nation’s coastal waters. Such victories are hard-earned: in the 50 years since NOAA came into existence, the ocean has become a more difficult – or at least a very different – place for many marine species to thrive: warmer, more acidic and more polluted. Our fates are tied to the ocean. The World Wildlife Fund estimates the oceans’ natural capital to be worth at
least $24 trillion to the world, with an additional $2.5 trillion in ocean goods and services produced annually. The ocean provides the primary source of protein for 35 percent of the world’s population, produces half the oxygen we breathe, and absorbs 30 percent of the world’s CO2 emissions. The health of the planet – and every organism on it, including us – depends on a healthy ocean. America’s marine economy, including goods and services, depends on a healthy ocean. It contributed about $373 billion to the nation’s gross domestic product in 2018 and grew faster than the nation’s economy as a whole,
The Alaska Tsunami Warning Center is renamed the National Tsunami Warning Center. Its responsibilities cover the areas of the U.S. Pacific, Atlantic, and Gulf Coasts, British Columbia, Puerto Rico, the Virgin Islands, and the Atlantic Coast of Canada.
154
NOAA/JOHN DOUGLAS, MOSS LANDING MARINE LABORATORY
or more than 30 years after a chemical manufacturer stopped dumping waste into the sewers of Los Angeles, the kelp forests of the Palos Verdes Shelf, an ecosystem contaminated with the pesticide DDT and other toxins, recovered slowly. By the early 2010s, only about 25 percent of the original kelp canopy had been restored, stalled in a negative feedback loop: without kelp to provide habitat and cover for animals that fed on sea urchins, the urchins – which devour kelp and other algae – had transformed the area into an “urchin barren,” teeming with spiny animals that gobbled up new kelp plants before they had a chance to grow. After years of monitoring, research and planning, NOAA and its partners sprang into action. Teams of NOAA-certified volunteer divers ventured out to gather urchins – by the summer of 2020, 4.2 million urchins had been collected in more than 8,000 hours underwater – freeing up space for new kelp plants to grow, provide cover for urchin predators such as sea otters, and restore a healthy balance to coastal waters. 55 acres of kelp forest have been restored so far, on the Palos Verdes
OUR WORLD OCEAN provides CLIMATE REGULATION
THE AIR WE BREATHE
ocean produces >50% The over half of the
70%
Covering 70% of the Earth’s surface, the ocean transports heat from the equator to the poles, regulating our climate and weather patterns.
world’s oxygen and stores 50 times more carbon dioxide than our atmosphere.
TRANSPORTATION
76%
Percent of all U.S. trade involving some form of marine transportation.
RECREATION From fishing to boating to kayaking and whale watching, the ocean provides us with so many unique activities.
ECONOMY
$282 billion
Amount the U.S. ocean economy produces in goods and services. Oceandependent businesses employ almost 3 million people.
FOOD
MEDICINE
The ocean provides much more than just seafood. Ingredients from the sea are found in surprising foods such as peanut butter and soymilk.
Many medicinal products come from the ocean, including ingredients that help fight cancer, arthritis, Alzheimer's disease, and heart disease.
DAVID WITTING, NOAA
A diver removes urchins from an urchin barren to allow for kelp growth on the Palos Verdes Shelf.
according to the marine economy statistics released in June 2020 by two Department of Commerce agencies. By 2030 the global ocean economy is expected to double in value. The mission to preserve, protect and restore the health of the nation’s ocean resources is a keystone of NOAA’s charter, and NOAA and its partners are adapting, with new strategies and technologies to meet new challenges.
2013
Healthy, Sustainable Fisheries Today, the United States is a global leader in responsibly managed fisheries, ensuring a sustainable supply of seafood from U.S. waters. In July of 2020, NOAA reported that about 7 percent of the nation’s managed stocks were subject to overfishing, an all-time low. Globally, however, up to 33 percent of fisheries are overfished, accord-
NOAA FUTURE
ing to the United Nations Food and Agriculture Organization. Fisheries management in the United States is guided by the Magnuson-Stevens Act (MSA), a federal law created to prevent overfishing, rebuild overfished stocks, increase long-term economic and social benefits, and ensure a safe and sustainable supply of seafood. Among the provisions of the law was the creation of the nation’s Exclusive Economic Zone (EEZ), which includes ocean waters out to 200 miles and applies federal regulations within those waters. Before the MSA, international waters began at just 12 miles from shore and were being fished by unregulated foreign fleets. The 1976 law established eight regional fishery management councils with representation from the coastal states and fishery stakeholders. The councils’ develop fishery management plans that comply with the MSA’s conservation and management requirements, including 10 national standards – that promote sustainable fisheries management. The management process relies on collaboration among stakeholders, government, industry and environmental groups. NOAA has led several innovations that have, in many cases, accelerated the rebound of overfished stocks. One example of innovative means to prevent overfishing is “catch shares” that dedicate a secure share of fish to individual fishermen, cooperatives, or fishing communities for their exclusive use. In traditional fisheries management, fishers often hurry to catch as many fish as possible before the overall limit is reached. Catch shares allow fishers to pursue their catch when they want to – during bet-
NOAA announces the end of traditional paper nautical charts, instead providing print-on-demand charts and electronic charts.
155
NOAA FUTURE
analysis of marine ecosystems, will be a continuing emphasis for NOAA and its partners in preserving these valuable resources. In the fall of 2018, NOAA Fisheries issued a report identifying challenges that lay ahead for fisheries management in the changing ocean environment – which has begun to alter the productivity of fisheries and the way species distribute themselves (some, such as salmon, appear to be drifting northward toward colder waters). The agency’s six-step plan for anticipating and meeting these challenges involves real-time monitoring and advanced sampling with uncrewed platforms such as ocean gliders and saildrones. The genetic information collected in these environmental DNA samples will help distinguish between migratory populations of a single species, assess the health of stocks, and determine their resilience to climate change – all of which will help inform better management decisions.
Viable Ocean Farms
NOAA IMAGES
This Aquapod, essentially a fish-farming cage, allows farmers to grow fish in the open ocean, away from crowded coastlines. With NOAA’s cutting-edge research and industry’s innovative designs, seafood producers can expand sustainable and environmentally sound farming out to sea.
ter weather or at times of year when costs are lower or the value of fish is higher. Since the first U.S. catch share program was implemented in 1990, more than a dozen have become operational, producing higher incomes, safer fishing, and reduced overfishing. Given the stressors now acting on ocean ecosystems, NOAA Fisheries and its partners will continue to emphasize the overall health of the marine ecosystems that support U.S. fish stocks, rather than narrowly focus on species themselves. Through its Office
of Habitat Conservation, NOAA and its community partners develop and support targeted projects designed to conserve and restore habitat for managed fisheries. The Office’s Habitat Restoration Center, for example, has funded more than 70 projects in 15 states to restore natural oyster reefs – including the world’s largest oyster restoration effort, in the Chesapeake Bay, where populations have shrunk to about 1 percent of historical levels. This ecosystem approach, aided by genomic
The increasing demand for seafood both globally and in the United States makes it unlikely that even the best-managed fisheries can be induced to sustainably produce more seafood. Around the world, wild-capture fishery yields have plateaued during the last 30 years. Aquaculture – cultivating fin fish, shellfish, and algae – is expanding to meet this growing demand for seafood. In the United States, with the support of NOAA’s Aquaculture Program, a small but vibrant U.S. industry has been firmly established, but still comprises less than 1 percent of the world’s aquaculture production. Around the country, marine aquaculture operations provide a year-
2014
NOAA forecasts a bloom of cyanobacteria that contaminated drinking water in Lake Erie on Aug. 2, 2014. This event left nearly 400,000 people in Ohio without drinking water for two days.
157
NOAA FUTURE
2014
A close-up of one of the GoPro cameras attached to an oyster cage that Milford Lab scientists are using to observe how other species use oyster cages.
sustainable seafood complement to wild-capture fisheries.
Protected Marine Species NOAA Fisheries is responsible for recovering more than 165 marine species listed as threatened or endangered under the Endangered Species Act, and protecting most marine mammals under the Marine Mammal Protection Act. In 2015, NOAA Fisheries launched its “Species in the Spotlight” initiative to draw greater attention to, and rally resources around, several high-risk, high-priority species – now nine in number. For each of these nine species, NOAA Fisheries has developed action plans for protecting and restoring habitat, reducing human-caused threats, encouraging community science and stewardship, and – when possible – breeding in captivity. The population of one of the spotlight species, the Hawaiian monk seal, has declined to about 1,400 individuals, less than one seal per mile of the island archipelago. In this vast and
remote area, NOAA Fisheries and our partners have focused on maximizing the survival of every individual seal encountered, in a recovery effort drawing on more than 30 years of research. Over this time period, the rate of decline for the Hawaiian monk seal population has been reduced by half. The endangered Pacific leatherback sea turtle, another spotlight species, ranges throughout the Pacific Ocean, and the west Pacific population of the turtle swims through the waters of at least 32 nations, including the U.S. The species has declined more than 80 to 90 percent over the past few decades, and both the east and west Pacific populations are at high risk of extinction. The primary threats to the species are being caught as bycatch in fisheries and, in some nations, killing of turtles and their eggs for consumption. NOAA Fisheries has been working with partners across the Pacific to ensure that nesting turtles and their eggs are protected. Research efforts include tracking the movements
NOAA releases version 1.0 of the web-based U.S. Climate Resilience Toolkit, which helps the nation address challenges related to coastal flooding and other climate-related risks.
158
NOAA
round source of high-quality jobs and economic opportunities in coastal communities that augment seasonal tourism and commercial fishing. Marine aquaculture is also a resource-efficient method of increasing and diversifying U.S. seafood production that can expand and stabilize U.S. seafood supply in the face of environmental change and economic uncertainty. Despite the growing need for sustainable aquaculture, major barriers to industry expansion still exist, and NOAA is working to address these. One of the main challenges facing marine aquaculture development has been the uncertainty of permitting. The U.S. is a world leader in setting and enforcing environmental laws and has a framework of regulations that help ensure sustainability of industries including aquaculture. NOAA has been working with partner agencies to increase the efficiency of this regulatory framework to offer potential growers a more defined path toward getting farms in the water. NOAA is also working to foster acceptance of sustainable marine aquaculture through research and outreach efforts across the Aquaculture Program. The public still encounters farmed seafood information that is often out-of-date, incomplete, or inaccurate. Thanks to efforts by NOAA’s National Centers for Coastal Ocean Science, the Sea Grant extension network, and NOAA Fisheries, there is a growing sense of understanding and optimism around marine aquaculture. As more communities become familiar with NOAA’s work and the current industry, they may understand the benefits ocean farming provides for protein production, coastal economies, and as a
NOAA PHOTO
The Hawaiian monk seal is one of the endangered species highlighted in NOAA’s “Species in the Spotlight” campaign.
of leatherback turtles via satellite transmitters attached to their shells, and development of fishing techniques to reduce bycatch. According to Donna Wieting, director of the Office of Protected Resources, monitoring a small number of animals over vast ocean distances has always been difficult. This challenge increases as warming oceans alter the behavior and distribution of some species. Traditional vessel- or aircraft-based surveys come with limitations – and dangers – but uncrewed systems are enabling more sustained observations farther afield. Uncrewed aerial vehicles, for example, have been used by NOAA’s Southwest Fisheries Science Center to track North Pacific gray whales and assess an individual animal’s health throughout their annual 12,000-mile trip from their summer home in Alaskan waters to breeding and calving grounds off the Mexican coast. “Using drone technology, we can get much
better estimates of whether the animals are more or less healthy than before,” said Wieting. North Pacific gray whales in U.S. waters have suffered two “Unusual Mortality Events” (UMEs) over the past 20 years – one spanning 1999-2000 and one beginning in 2019 that is still ongoing in 2020 – so new and emerging technologies like drones are crucial tools in efforts to investigate health of free-swimming whales and advance conservation of the species. In the Atlantic, the North Atlantic right whale – one of the world’s most endangered species, with only about 400 animals left, including fewer than 100 breeding females – has been difficult to track. “With climate change and other changes in the environment,” Wieting said, “some animals are moving from places they used to be. The scientific thinking is that their food is moving, and they’re seeking it out.” Beginning in 2017, several right whales were killed primarily by vessel strikes or fishing gear
NOAA FUTURE
entanglements in U.S. or Canadian waters, which necessitated NOAA Fisheries to declare a UME for the species and launch an investigation with international partners. Over the past three years, 41 whales (31 dead and 10 seriously injured) have been documented so far in the UME, which represents 10 percent of the remaining individuals in the population. The mortalities in Canada occurred in waters where scientists did not expect to find the whales, and underscored the changing distribution of North Atlantic right whales and their prey. Uncrewed systems, either in the air or underwater, help to locate individual animals – to issue warnings to approaching vessels in the area, for example, or perhaps to mount a rescue effort for an animal in distress – and, more importantly, to target conservation actions that mitigate threats to the whales. ”The ocean is vast and the animals are cryptic, so having these new ways to find out where they are, and whether they are encountering threats, is really important, because we’re working hard to minimize threats to these animals,” said Wieting.
Conserving and Restoring Coral Reefs Uncrewed systems may also become instrumental in gathering data critical to protect and restore ocean corals, many of which are battered, scarred or dislodged from the ocean floor by more frequent and more intense tropical storms. The increasing temperature and acidity of ocean waters make corals more prone to diseases and to bleaching, in which coral
2014
NOAA collaborates on a tool called OceanAdapt to track shifting fish distribution in response to climate change. A presidential task force is established to combat illegal, unreported and unregulated fishing and seafood fraud. Involving 12 federal agencies co-led by the State Department and NOAA, the task force identifies 15 actions to strengthen enforcement. One of those actions results in establishing the Seafood Import Monitoring Program.
159
NOAA PHOTO
The Experimental Reef Laboratory features 16 aquaria that researchers are using to study how corals respond to ocean warming and acidification.
polyps expel the symbiotic algae that live in their tissues. Coral reefs anchor the most biodiverse habitats in the ocean, critical to the survival of thousands of other marine organisms, including commercially valuable food species. It’s been estimated that 25 percent of all marine species spend some portion of their lives on a coral reef. According to Jennifer Koss, who directs NOAA’s Coral Reef Conservation Program, using uncrewed gliders and remotely controlled underwater vehicles may help make the collection of environmental data faster and more thorough, yielding a trove of data that can be analyzed by artificial intelligence. “We have a partnership effort where we’re training computers to analyze photos of corals and identify what species are in the photos, so we don’t need a bunch of coral biologists in Hawaii poring over these pictures,” she said. The data can also be stored and processed in a cloud platform that will enable greater access and computing power. New technologies, including genomic analysis, introduce the potential to overcome some early
limitations in the emerging field of coral reef restoration. “We’ve cut our teeth on restoring corals after a ship grounding, or after a large storm event, where we go in and gather up the corals that have been dislodged or broken up, consolidate the reef matrix as much as we can, and then go back and plant those rescued corals to address the acute damage,” said Koss. “Now, in Florida and other parts of the Caribbean, the reefs are degraded and have lost much of their structure, requiring a lot more active large-scale restoration to regain their ecosystem function.” The trouble with simply reattaching pieces of coral to the reef, said Koss, is that if they are all the same individual within a single species, they won’t be any more resilient to future stress events: “It doesn’t make a lot of sense to create tens of thousands of coral fragments that are genetically identical and put them out in the water,” she said, “it’s analogous to recreating an Irish potato famine scenario and we’d be doing the environment a disservice knowing that with a single disease or bleaching event, they
NOAA FUTURE
could all get wiped out. A diversity of coral species and individuals within those species is the key to coral restoration moving forward.” With NOAA models predicting that warming and acidification will worsen in the coming decades, scientists at NOAA’s Atlantic Oceanographic and Meteorological Laboratory recently designed the Experimental Reef Lab at the University of Miami, to study the molecular mechanisms of coral resilience. Established in 2017, the laboratory will help to forecast how corals will respond to these stressors, and to inform future mitigation, management and restoration strategies. The Coral Reef Conservation Program has funded grants supporting studies in “stress-hardening” corals to leverage their innate genetic makeup and make them more resilient. “We’re hoping to learn both the simple things, such as whether you can breed two corals that you know to be resilient, because they made it through some disease event or a thermal event,” she said, “as well as the feasibility of things like gene editing. We’re not there yet. But knowing whether we can get there, applying these ‘omics sciences, is why we have our lab in Florida as part of our coral conservation program.” The prospect of genetically engineering corals to withstand the stresses of a warmer, more unpredictable ocean environment might have seemed outlandish just a few years ago, but Koss seems to think it’s inevitable. The suite of technologies being matured at NOAA and around the world today will enable scientists to learn more about the changing ocean environment, anticipate changes, and protect the long-term health of the oceans on which our lives and livelihoods depend.
2015
NOAA successfully launches DSCOVR from Cape Canaveral, Florida. DSCOVR, the United States’ first operational deep space satellite, is a vital piece of our international space weather observing system.
161
NOAA FUTURE
Enriching Life Through Science
New tools and strategies to maximize the quantity, quality, and value of NOAA science By Craig Collins
I
n late 2019, NOAA began to finalize the agency’s vision for a new set of strategies that would maximize the value of NOAA science through six interdependent elements: uncrewed systems; ‘omics; cloud computing; artificial intelligence; data management, and citizen science. The strategies were developed by teams of experts within NOAA who understand the most important point about all of them: one big strategy for unlocking the potential of these outcomes to maximize the value of NOAA science and dramatically expand the agency’s application of emerging science and technology focus areas to guide transformative advancements in the quality and timeliness of NOAA science, products and services. “These strategies will accelerate the implementation of the most effective science and technology applications to advance NOAA’s mission to protect life and property and grow the American
2015
Blue Economy,” said retired Navy Rear Adm. Tim Gallaudet, Ph.D., assistant secretary of commerce for oceans and atmosphere and deputy NOAA administrator. NOAA’s vocation is to enrich life through science. Two parts of its overall mission – sharing knowledge of the changing planet with others (service) and conserving and managing coastal and marine resources (stewardship) – are anchored by the third, science: its ability to understand and predict changes in climate, weather, oceans and coastlines. Everything NOAA produces – weather forecasts and advisories; climate information; harmful algal bloom (HAB) forecasts; nautical charts; fishing regulations; coastal management decision tools; endangered species recovery plans and more – depends on science. And the science behind every one of these applications depends on data. NOAA has one of the world’s most advanced and comprehensive
systems for collecting environmental data, gathering samples from the ocean floor and from the sun: buoys, gauges, radar stations, geographic reference stations, satellites, air- or ocean-borne sensor arrays, and other sensing platforms use cutting-edge technologies to reveal conditions in, on and beyond the planet. Just a few years ago, NOAA estimated that these sensing capabilities enabled it to collect about 20 terabytes of data – the amount found in the texts of the library of Congress – every day. Today its daily haul is up to five times that amount.
More Data Means More Computing Power and More AI The recent spike in the quantity and variety of NOAA’s observational data has the potential to overburden the systems tasked with incorporating all of this new information. Much of this data is fed into NOAA’s massive
NOAA begins a major upgrade of its large-scale operational supercomputers that will create more realistic conditions in NOAA models and enable more accurate weather forecasts and enhanced public safety.
162
NOAA PHOTO
weather forecasting models, which are based on numerical calculations so intricate that, even when run through a powerful supercomputer, they can take hours to generate a single forecast. In early 2020, NOAA’s National Weather Service (NWS) invested in an upgrade of its supercomputing system that would triple its capacity to run models and generate forecasts, as well as double the speed at which data is stored. The agency purchased two high-capacity Cray computers that will triple NOAA’s total supercomputing capacity for prediction and research. After a period of code migration and testing, they will be brought online in 2022 to replace existing systems in Virginia and Florida. Raw computing power alone won’t be able to optimize how NOAA’s data is stored, analyzed and shared. Even the most powerful supercomputers available, running world-class models, are predicting the future using data that’s already hours old – which can limit forecasters’ awareness of current conditions. Improved image analysis is one area that has benefitted from artificial intelligence, which has been used by NOAA scientists for more than 25 years to process and act on data in real time, using machine learning algorithms. Imagery collected during aircraft and drone overflights of HABs in Lake Erie, for example, is processed by an algorithm developed to estimate the concentration of cyanobacteria (blue-green algae) in Erie waters. Another algorithm under development will be able to tell the difference between toxic and non-toxic algae from these overhead images. In Alaska, scientists have
NOAA FUTURE
Employed for NOAA research on harmful algal blooms in Lake Erie, one of the Monterey Bay Aquarium Research Institute’s (MBARI) long-range autonomous underwater vehicles (LRAUV) makes its way through the green, algae-rich waters of Lake Erie to track the 2019 harmful algal bloom. NOAA is using unmanned vehicles across a range of important research tasks.
trained computers to identify, with algorithms that process both visual and acoustic data, animals of specific species, such as ice seals and beluga whales – doing in hours what humans would take months to do. NOAA’s already using AI in Alaska’s remote Aleutian Islands, where volunteers have helped classify hundreds of thousands of images of Steller sea lions taken by remote cameras, identifying animals marked by researchers from NOAA’s Alaska Fisheries Science Center to monitor them. These volunteers have already
saved NOAA staff hundreds of viewing hours – but are still spending hundreds of hours themselves performing tedious work.
NOAA’s Big Data Project Takes to the Cloud Not every NOAA workstation is powerful enough to run machine learning algorithms, and it can be difficult for users of NOAA data to download and work with such large data volumes. NOAA is in the midst
2015
NOAA ships collect critical hydrographic, fisheries, and protected species data in the Arctic region, enabling improvements to nautical charts required for safe navigation and providing data on managed species.
163
PHOTO BY LT. ELIZABETH CRAPO, NOAA CORPS
Deploying a TAO buoy. TAO is a moored buoy array maintained by NOAA located across the equatorial Pacific Ocean. Its surface and sub-surface observations are critical for our understanding of the El Niño – Southern Oscillation (ENSO).
of a sweeping public-private initiative – the Big Data Project – to provide public access to NOAA’s open data on commercial cloud platforms. The Big Data Project became operational in December of 2019, when NOAA contracted with three commercial cloud providers – Amazon Web Services, Google Cloud and Microsoft Azure – to host NOAA data in support of some of its most widely used online applications. The project combines NOAA’s expansive collection of high-quality environmental data with the infrastructure and expertise of some of the data sector’s biggest innovators. NOAA’s N-Wave network is facilitating this big data move to the cloud. N-Wave’s high-speed network services include direct connections to multiple commercial cloud providers, enabling both NOAA research and operations in the cloud. The Big Data Project has already moved 130 NOAA datasets to the
cloud, with more arriving every day – and NOAA is already seeing that its data are being used more, sometimes in surprising and innovative ways. For example, when the entire archive of data collected from the National Weather Service’s NEXRAD (nextgeneration radar) stations was moved onto a cloud platform maintained by Amazon Web Services, an international team of ornithologists and computer scientists was able to reprocess the archive using a machine learning tool that could distinguish birds from weather. The new tool, MistNet, helped to reveal previously undiscovered bird migration patterns. According to Jonathan O’Neil, director of the Big Data Project, two things enabled this new application, neither of which had been previously achievable with NEXRAD: Making the entire archive – most of which had been written onto computer tapes – available to outside experts was
NOAA FUTURE
a significant task. “There are some challenges getting the entire archive off of tape,” said O’Neil, “but the other side of it is having enough computing power, which the cloud provides. It’s not something you could run on your PC. Combining the high availability of this data with the computing power of the cloud platforms allows those types of activities to happen.” The “challenge” O’Neil refers to is, in part, one of formatting data that has been housed for years on one platform – tapes – so that it can be shared and processed in the cloud. The Big Data Project is experimenting with converting traditional NOAA formats to more cloud-native formats optimized for high-powered tools and algorithms. As O’Neil pointed out, NOAA hasn’t adopted obscure data formats that work only for internal users; it has adhered to international data standards – but those standards were written before the advent of many of the most powerful cloudcomputing tools. For example, much of the National Geodetic Survey’s spatial reference data – which NOAA uses to support emergency response and homeland security activities – is collected in several datasets that can be rapidly disseminated to federal, state and local agencies. These data include lidar, high-resolution digital imagery, film camera photographs and hyperspectral scans. NOAA’s Big Data Project team has begun the process of converting all of these data to Cloud-optimized Geotiff (COG) files, a format that can be accessed and analyzed in the cloud, without the need for a second conversion. “When people say AI-ready, analysis-ready or cloud-optimized,
2016
The next generation of geostationary satellites begins with the launch of GOES-16 on Nov. 19, 2016, and GOES-17 on March 1, 2018. The GOES-R series provides advanced imagery and atmospheric measurements of Earth’s weather, oceans, and environment, real-time mapping of total lightning activity, and improved monitoring of solar activity and space weather.
165
NOAA FUTURE
2016
NOAA’s newest high performance computer, Hera, went online in November 2019 and was upgraded in February 2020. Hera is used for research to advance weather, climate, and ecosystem prediction and modeling.
technology strategies on uncrewed systems, artificial intelligence, ‘Omics and citizen science.
Citizen Scientists, Data Enthusiasts Since 2010 NOAA has also operated and managed its own shared national network infrastructure – N-Wave (noc.nwave.noaa.gov) – to enable NOAA-wide data transport, connect scientists to remote high performance computing resources and bridge public access to NOAA data. N-Wave’s high-speed network capabilities are scalable to meet the needs of NOAA science from the campus to the cloud, including the magnitude increase of data sourced from innovative, higher-resolution
instrumentation. Technology only partly explains NOAA’s data reach. The key is people: NOAA employs 6,770 scientists, a significant number for any agency – but its weather enterprise alone is fed by data from a network of more than 10,000 volunteer observers throughout the United States and its territories, participants in the Cooperative Observer Network who take daily weather observations and make them available online. NOAA’s growing commonwealth of citizen scientists, some using NOAA-developed mobile apps, report from every part of the country daily, helping NOAA scientists observe, predict and protect the environment. Crowdsourced data is becoming an increasingly significant NOAA asset. Volunteers have collected fish for
The United States represents one of the largest single markets for fish and fish products, second only to the European Union in imports. In 2016, the EU, U.S., and Japanese markets together accounted for approximately 64 percent of the total value of world imports of fish and fish products.
166
NOAA PHOTO
they’re talking about the same thing,” O’Neil said. “Parts of NOAA, as they see the utility of these formats, may begin to produce them. The usefulness of data in the cloud, though, is mostly due to the scalability of the platform. If your data is on an empty feed, really all you can do is download it. But if your data is on Microsoft [Azure], Google [Cloud], or Amazon [Web Services], you don’t really need to download it. You can do all your processing and use all their tools right where the data sits.” According to David Layton, NOAA’s chief enterprise architect, the Big Data Program teams are also working to make more data available to the general public. “Often, people who need to access data from our archives are experts. They know where to find it. They know the formats, and they know how to ask the right questions. Today’s data infrastructure is oriented toward those users.” NOAA is merging all of this data into a new framework, the OneStop portal (data.noaa. gov/onestop/), an online gateway to all of NOAA’s data, which can be searched by topic (i.e., “fisheries” or “weather”). “With OneStop, we’re trying to broaden our audience and make the data easier to access through modern cloud-based technologies,” Layton said. “It will be an increasingly important interface for NOAA customers, and the public in particular, to discover and access our data holdings.” Both the big data and cloud strategies have their own broad application across the agency while underpinning and enabling the goals of NOAA’s interrelated science and
NOAA FUTURE
NOAA archives 26 terabytes of oceanic, atmospheric, and geophysical data every month. genetic analysis; mapped urban hot spots; warned of severe weather; monitored and reported marine debris; and even monitored sea stars along the West Coast. Citizen science benefits society while cost-effectively enhancing NOAA’s research and monitoring efforts. Volunteers don’t just fill NOAA’s data bucket; they often work to process data as well – for example, converting older weather records, such as ship logs, to digital formats. NOAA is fully leveraging the power of public participation in support of agency mission areas through the Citizen Science Strategy. Citizen science, crowdsourcing, and challenge competitions provide opportunities for the agency to engage the American public in addressing societal needs and accelerating science, technology,and innovation
Autonomous Uncrewed Systems and ‘Omics Analysis The continuing increase in NOAA data volume is supported by new technologies, including uncrewed vehicles that can be operated remotely. Autonomous instruments are capable of operating unattended for extended periods of time, and can collect data in the atmosphere or in bodies of water. NOAA’s Great Lakes
Environmental Research Laboratory is working to integrate uncrewed aircraft into its airborne harmful algal bloom (HAB) detection and mapping program, to complement the work of the piloted aircraft now conducting aerial surveys – enabling a more rapid response and data collection in a constantly changing environment. The GLERL is also exploring the use of underwater drones to help with short- and long-term decision making in an area of Lake Erie that supplies drinking water to 11 million people. A torpedoshaped autonomous underwater vehicle (AUV) released from a NOAA research vessel into the waters of western Lake Erie in the summer of 2018 had two assignments: First, to measure levels of a toxic chemical, microcystin, produced by blue-green algae that blooms with increasing frequency. The three-dimensional picture of the toxin’s concentration in the water column, and where it was moving, would help regional and municipal managers make forecasts and decisions such as whether and when to close off drinking water intake pipes. The AUV’s second job – to collect water samples from both within and outside the algal bloom – was aimed at the longer term: With new technologies that allow sequencing and analysis of DNA in a given water sample, scientists could catalog all the organisms present in certain
locations at certain times. The genetic information collected from Lake Erie would help scientists to understand the ecological dynamics of HABs, and ultimately to plot strategies to avoid and reduce their harm. The ability to characterize larger ecosystems by analyzing molecules in organic material such as DNA, RNA and proteins is a relatively new field: the ‘omics sciences, known for their common suffix (i.e., genomics, proteomics, metabolomics). Dr. Kelly Goodwin, a molecular biologist and microbiologist with NOAA’s Atlantic Oceanographic and Meteorological Laboratory, is cochair of the task force that developed an overall ‘omics strategy for the agency. Uncrewed systems such as the gliders used in Lake Erie, she said, constitute a huge leap forward in data collection: “It’s a big deal,” she said, “because there are a lot of places we can’t trawl, or we can’t sample: under ice, the deep ocean, places where the habitat is really sensitive.” Uncrewed systems have the potential to increase not only the raw quantity of data, but also the types of data that can be collected feasibly and safely.
Putting It All Together: Strategies for the Future As O’Neil and Layton point out, exciting scientific and technological
2016
40th anniversary of the Magnuson-Stevens Act; overfishing and overfished numbers hit historic all-time lows, with just 8 percent of managed fish stocks on the overfishing list and 16 percent of stocks considered overfished – all of them under rebuilding plans.
167
innovations are developing among NOAA’s different lines. The Office of Aviation and Maritime Operations is implementing NOAA’s new Uncrewed Systems Operations Program: establishing an uncrewed systems office to coordinate testing, training, development, and operations among about 100 aerial, sea surface, and undersea vehicles now being used to collect high-quality environmental data for NOAA’s line offices. Kelly Goodwin and her NOAA microbiologist colleagues are investigating and discovering new applications for the ‘omics sciences, using molecular analyses of environmental DNA in marine and aquatic environments to discover the mysteries about how these ecosystems work. New communications technologies and mobile applications have unlocked new pathways for citizen scientists to engage in NOAA’s scientific research and monitoring. Emerging capabilities such as artificial intelligence, cloud platforms and computing tools are enabling NOAA scientists to rapidly store, share, and analyze data. These developments are part of a NOAA science and technology strategy for a future with the potential to greatly enhance the benefits of NOAA science – but only, its scientists caution, if they grow together. The ability to use uncrewed vehicles and sample processors to sort genetic information from a seawater sample is immensely promising – but according to Goodwin, it also presents new challenges to NOAA biologists, most of whom received their education before such tools
existed. “The transformational part of ‘omics – the part that gives you so much information on the cheap – is also the part we have to manage, which is the data dump,” she said. “We’re really talking about a new field of science, and we’re going to need partnerships and people to grow it. Utilizing these new supercool tools is going to require a lot of expertise and computing power.” Dr. Alan Leonardi, director of NOAA’s Office of Ocean Exploration and Research, is excited about the potential of uncrewed systems to help reveal the undersea world – but he knows it will be more complicated than simply tossing robots into the ocean. Advances in engineering, he said, will have to be matched with advances in data and software capability: “If you’re going to have robots out there doing their thing, you’d better make them smart,” he said. “Artificial intelligence and machine learning are going to help us do that. If we can put our data in the cloud, rather than sit on a hard disk somewhere in a shore-based location, those tools can help a broad array of clients in the world – whether in the business, philanthropic, academic or government sectors – to quickly assess whether or not our data and information have value to them, so they can make decisions, improve a product, or in some cases make money.” Dr. Jamese Sims, a physical scientist who began her NOAA career more than 15 years ago, developing and improving predictive models for the National Weather Service, coordinated NOAA’s Artificial Intelligence Strategy, released in
NOAA FUTURE
February of 2020. “We have a lot of synergy across all these strategies. We’re really changing the culture in the way that we manage our science and technology,” she said. “By making sure we’re taking the ‘One NOAA’ approach, and that line offices are constantly communicating about driving these strategies and implementing them. … We have a lot of synergy across all these strategies.” “NOAA is a pioneer with a strong track record of applying the latest science and technology and these new strategies will allow us to dramatically expand these applications across our mission areas,” said Dr. Neil Jacobs, Ph.D., acting NOAA administrator. “These detailed strategies will enable us to achieve our priorities of reclaiming and maintaining global leadership in numerical weather prediction and sustainably expanding the American Blue Economy.” Such an approach makes it impossible to view any of these six strategies in isolation. As NOAA scientists expand their use of uncrewed systems and partner with citizen scientists to collect more data – including more detailed and comprehensive data such as the molecular information revealed by ‘omics analyses – NOAA experts will assure that the growing data catalog will reach a wider audience, who will use new tools to do more with it. Emerging technologies like AI, uncrewed systems, ‘omics, big data and cloud services hold incredible promise to solve difficult challenges, and through these strategies and initiatives, NOAA seeks to bring this potential to all Americans for their use and benefit.
In the United States, more than 200 million observations, mostly from satellites, are processed and used each day as input into global and regional weather models. 169
NOAA FUTURE
Building a Weather-Ready Nation Through Lessons Learned, Innovation, and Partnership
Protecting lives and property from extreme weather By Craig Collins
F
or two days in early April 1974, the nation experienced an unprecedented outbreak of tornadoes, known today as the Super Outbreak. In all, 148 tornadoes tore through communities across 13 different states, killing 319 people and injuring more than 5,400. National Weather Service (NWS) meteorologists could see the tracks of the storms, but the inability to see these tornadoes resulted in an underestimation of the severity of the system. It lacked many of the sophisticated tools used today to predict severe storms. The result of the lessons learned that day was an ambitious and sweeping transformation about nearly everything the NWS did. The Modernization and Associated
2017
Reorganization, or MAR, improved collaboration within the NWS and resulted in expansion of hydrologic forecast products and services. The NWS invested in a new generation of s-band Doppler radar systems, collectively known as NEXRAD, more advanced weather satellites, and a network of automated surface observing systems (ASOS) reporting weather data at hourly intervals, mostly from airports. To ensure the highest level of scientific expertise, the service required each of its meteorologists to have at least a bachelor’s degree. One of the capstones of this modernization effort was the Advanced Weather Interactive Processing System (AWIPS), a sophisticated network that collects and integrates meteorological, hydrological, satellite, and
radar data; processes it; and distributes it to regional weather forecasting offices (WFOs) and River Forecast Centers (RFCs). AWIPS has enabled forecasters to make increasingly accurate weather, water, and climate predictions, and to issue highly reliable warnings and advisories.
Super Outbreak II The warnings and advisories issued before a second Super Outbreak of tornadoes over three days in April 2011 – a larger event, consisting of 360 tornadoes throughout 16 Midwestern, Southern, and Northeastern states – were timelier due to the advances in technology. On the morning of the outbreak’s first day, NWS issued a forecast warning that the nation was at its highest-ever danger for tornadoes. Over the next three days, tornado warnings were issued an average of about 25 minutes before a tornado struck. These warnings were remarkably accurate: 95 percent preceded a tornado. Despite these earlier warnings, more accurate forecasts, and better communications, the 2011 event resulted in the largest, deadliest, and costliest tornado outbreak in U.S. history: More than 320 people were killed during the 2011 Super Outbreak,
The Weather Research and Forecasting Innovation Act of 2017 is passed. The first major weather legislation since the early 1990s, the act directs NOAA to prioritize weather research and forecasting improvement, satellite and data innovation, and improve coordination among government agencies, research institutions, and industry.
170
PHOTO BY MIKE CONIGLIO/NOAA NSSL
NOAA FUTURE
In the months that followed, NWS leaders talked over the problem among themselves and others in the U.S. meteorological community: How could the agency make sure its weather information – the best the agency had ever produced – achieve the societal benefits it had always envisioned? Later in the year, NWS decided on a name for a new guiding doctrine: Building a Weather-Ready Nation.
Weather-readiness: Impact-based Warnings
NOAA PHOTO
Top: A supercell thunderstorm in Kansas. Above: Doppler radars transmit pulses of radio waves to scan the atmosphere to help meteorologists detect severe weather with precision. Modernization efforts over the years, including investment in sophisticated tools like Doppler radar systems, have enabled the National Weather Service to make increasingly accurate weather, water, and climate predictions.
during which 360 tornadoes caused $10.2 billion in damages. The mission of the National Weather Service is to provide weather, water, and climate data, forecasts, and warnings for the protection of life and property and enhancement of the national economy. The 2011
Super Outbreak showed that even the best possible forecasts and warnings, communicated with unprecedented timeliness and clarity, wouldn’t automatically fulfill the second half of that mission: protecting life, property, and the national economy. Something was missing.
This new philosophy recognized that the accuracy, thoroughness and speed of information NWS issued to the world was, ultimately, just one factor determining how harmful an extreme weather event could be. How people received, interpreted, and acted on that information was at least as important. The NWS immediately accepted responsibility for helping decision-makers (i.e., emergency managers) and end users of its weather information (the public) understand the potential impact of a weather event. Service leaders began to focus forecasting efforts on “the last mile,” taking an active role in connecting its forecasts to lifesaving actions on the ground. For one thing, NWS began to change the way its warnings and decision-support services were worded, focusing not on the weather events themselves, but on their potential to do harm. Impact-based warnings are worded differently. The tornado warning issued to the area around Sioux Falls, South Dakota, in September of
2017
NOAA launches polar-orbiting satellite JPSS-1, officially known as NOAA-20. The satellite’s advanced instruments provide global observations that serve as the backbone of both short- and long-term forecasts, including those that help us predict and prepare for severe weather events.
171
NOAA FUTURE
The National Weather Service aims to help decision-makers and communities understand the effects of severe weather on people, and its impactbased warnings and educational information like this graphic emphasize the potential of weather events to cause harm.
2019, for example, contained some non-meteorological language: This is a particularly dangerous situation. … You are in a life-threatening situation. Flying debris may be deadly to those caught without shelter. Mobile homes will be destroyed. Considerable damage to homes … businesses and vehicles is likely and complete destruction is possible.
NOAA GRAPHIC
Decision Support Another key to Building a Weather-Ready Nation is delivered through decision support teams, based at individual WFOs: Impact-based decision support services (IDSS) connect forecasts and warnings to the partners responsible for public safety,
and help them understand and utilize these forecasts before and during extreme events. Like impact-based warnings, IDSS encourage partners and customers – emergency managers, broadcasters, and the general public – to be aware of and consider the potential impacts of events, and to factor human and societal factors into these events. Some early NOAA research indicates that IDSS helps to mitigate damage from extreme events, but NOAA’s social scientists are still studying why, and to what degree, as they try to develop and refine new services. At the National Hurricane Center, Dr. Michael Brennan, chief of the Hurricane Specialists Branch, has noticed that forecasts need to be packaged and
delivered differently, depending on the recipient. “Our customer base runs the whole spectrum,” he said, “from very sophisticated emergency managers who understand everything about hurricanes and have very sophisticated data plans, to the general public, to publics in other countries that might speak a different language and might approach hurricane preparedness differently. We’ve learned that people interpret the same information in different ways.” Social scientists at NOAA’s Weather Program Office have taught Brennan and other hurricane forecasters some valuable lessons. “If people are hearing different messages about preparedness and what they should be doing, they may just not do anything,”
2017
Federal, state, and local officials cut the ribbon on the new facility for NOAA’s Aircraft Operations Center at Lakeland Linder International Airport in Lakeland, Florida.
173
NOAA FUTURE
Did You Know
he said. “Conflicting preparedness information generally makes people kind of just seize up.” Also, Brennan said, “We’ve learned that people tend to anchor on the initial information they hear about a potential threat. So they might make all their decisions based on the first information they hear about a storm, and they may never change their perception of the storm’s threat and risk.” In recent years, NHC advisories and warnings have shifted their traditional focus on storm strength and trajectory toward communicating the likely impacts of storm surge, rainfall flooding, winds, and other hazards. According to Dr. Gina Eosco, social science program manager for NOAA’s Weather Program Office, IDSS is fundamentally a marriage of the physical and social sciences: joining the calculated probabilities of weather outcomes with the entire context in which people make decisions. But the problem IDSS addresses isn’t a scientific one: “It’s actually more about training and culture change,” she said.
2018
New FACETs Over the past 20 years, Eosco said, the NWS has done a good job of characterizing atmospheric probabilities. NOAA’s social scientists are working to match this work with a better understanding of behavioral probabilities, which are every bit as complicated as the planetary elements that cause weather. Alerts and warnings can frame public perception – and as Michael Brennan points out, those perceptions are difficult to change once established; if the public is alerted to relatively small probabilities – of hurricane-force winds, or road ice, or rain – that don’t come to pass, they often tune out future alerts. Risks of extreme weather events either fade or build over time – and if they build, Eosco said, it’s important to connect with partners and the public at a threshold when and where they’ll take appropriate action. It’s a tricky calculus, involving the intersections of weather conditions, time, space, and human behavior.
Eosco is leading the evaluation and testing of a new all-hazard warning paradigm, developed by NOAA’s National Severe Storms Laboratory (NSSL) with input from other NOAA research elements: the Forecasting a Continuum of Environmental Threats (FACETs) initiative. FACETs isn’t a single program, but a framework for organizing and guiding efforts to coordinate next-generation forecasting technologies and tools with useful outputs and effective responses. For example, one of the new warning methods being evaluated for inclusion in the FACETs framework, Threats in Motion, makes an important upgrade to the way storm warnings are conveyed by forecasters: Traditionally, a forecaster uses software to draw a red polygon outlining an area of extreme weather over a gridded map. But there’s a problem, said Eosco: “A storm moves. Right now our software is made to supply a static polygon. When a tornado gets to the end of that polygon, a forecaster has to go back in and create another one.” Threats in Motion software creates warning grids that update every minute, moving continuously with the path of a storm – giving
NOAA launches a massive supercomputer upgrade, putting it among the 30 fastest in the world with the ability to process 8 quadrillion calculations per second.
174
NOAA PHOTO
A forecaster with the National Hurricane Center in Miami briefs Federal Emergency Management Agency personnel about the track forecast for Hurricane Joaquin in 2015. Through its impactbased decision support services efforts, the National Weather Service works to help public safety personnel utilize its forecasts before and during extreme weather events.
Lightning can heat the air to 50,000 degrees Fahrenheit – about 5 times hotter than the surface of the sun!
NOAA PHOTO
lives and property by itself. One of the charter elements of the program is the Weather-Ready Nation Ambassador initiative, which builds innovative collaborations across government, academia, non-profits, and private industry – not just forecasting companies such as Accuweather or The Weather Channel, but also schools, parks, shopping centers, and other organizations that can help prepare constituents, students, and customers to prepare for bad weather. As of Sept. 1, 2020, the NWS recognizes more than 11,000 Weather-Ready Nation Ambassadors. As a WRN Ambassador, partners commit to working with NOAA and other Ambassadors to strengthen national resilience against extreme weather. In effect, the WRN Ambassador initiative helps unify the efforts across the various partners toward making the nation more ready, responsive, and resilient against extreme environmental hazards. Top: Emergency managers train with senior hurricane specialists Dan Brown (right) and Mike Brennan (standing at left) at the National Hurricane Center during a hurricane preparedness course jointly sponsored by the National Weather Service and the Federal Emergency Management Agency. Above: A summary infographic showing hurricane season probability and numbers of named storms predicted from NOAA’s 2020 Atlantic Hurricane Season Outlook.
NOAA GRAPHIC
NOAA FUTURE
forecasters and the public an idea not only of where a storm has been, but also where it’s going. “This could help forecasters spend more time looking at the data and offering decisionsupport support services. Instead of drawing a new polygon, they can call an emergency manager.” Given new communications technologies, such as smartphones, Threats in Motion and other FACETs elements could provide end users with a continuous
flow of credible information about the development and potential impacts of severe weather. “FACETs,” said Eosco, “is about creating a culture within weather communication that integrates physical attributes with social attributes to create meaningful information.” NOAA understands, given that the Weather-Ready Nation philosophy relies on information exchange among partners, that it can’t protect
The Emerging Climate Timescale The Weather-Ready Nation philosophy is aimed at human behaviors to protect life and property from weather events: choosing safer vehicle routes or deciding to stay off the road entirely; taking cover in advance of an approaching storm; evacuating homes and businesses in advance of a wildfire; activating flood-protection systems or a dam release in anticipation of heavy rainfall. Longer-term forecasts, from yearto-year or further into the future, can also help to shape decision-making – and are becoming increasingly important, given the likelihood that
2019
An estimated 91 percent of all U.S.-managed seafood species are not experiencing overfishing, with 82 percent of stocks not overfished and 47 stocks fully rebuilt since 2000 – a 97 percent increase in the Fish Stock Sustainability Index since tracking began in 2000.
175
NOAA FUTURE
2020 176
The Navajo Department of Emergency Management (NNDEM) was selected as the 2020 WeatherReady Nation Ambassador of Excellence by the National Weather Service. NNDEM provides citizens of the Navajo tribe with prompt and reliable service for police, fire, and emergency medical logistical support and coordinates major emergency response.
permafrost thaw … and these longer timescale decisions come with a large price tag. Major infrastructure planning to manage flooding/drought or other impacts within the U.S. has similar long timescales and large price tags.” Planning and development decisions are engineered, to the extent possible, in anticipation of extremes such as hurricanes or droughts. The ESPC ensures that federal partners develop the most technically advanced, precise – and consistent – multi-model resource for informing these longterm planning decisions. Mark Osler, NOAA’s senior advisor for coastal inundation and resilience, notes how NOAA has embraced the need to provide information that informs decision-making over these longer timescales. “There is an urgent demand to know how factors like local sea level, temperature, drought, coastal water quality, and precipitation are changing from month to month, year to year, and over the coming decades,” said Osler. “NOAA is proudly at the forefront of efforts to advance the measurements and modeling needed to improve our skill in making accurate predictions on these longer timescales.”
We see the impacts of these changes in daily life and the routine decisions Americans make as they go about their day. For example, said Osler: “It is common in many communities on the East and Gulf coasts that you have to check the tides to figure out whether a certain parking lot or the road that leads to your daughter’s school is flooded, because it floods at high tide now.” Ensuring that NOAA succeeds in meeting these emerging needs will require an ever more integrated approach, and Osler celebrates the increased collaboration among NOAA’s physical and social scientists. “This intersection of science and communication of impacts is a unique expertise that NOAA offers,” Osler said. “Beyond the longstanding excellence in performing research and producing world class science and modeling, NOAA is increasingly putting user experience at the center of our evaluation of services. This evolution in our approach allows NOAA to co-create and integrate social science insights from the start, and check back with users to ensure that our products are meeting the needs of the public.”
NOAA celebrates 50 years of operation since its creation in 1970.
NATIONAL WEATHER SERVICE
the future timescale will diverge from historical weather and climate data. NOAA is the convening federal authority for producing the government’s National Climate Assessment every four years. One of the NWS’s National Centers for Environmental Prediction, the Climate Prediction Center, issues predictions of climate variability over periods from weeks to seasons – but some decisions require an even longer timescale. Dr. Jessie Carman is associate project manager for research at the Earth Systems Prediction Capability (ESPC), a partnership of interagency government modelers and their research partners who aim to coordinate and refine modeling systems and multi-model ensembles used by meteorologists, planners, and decision makers. Originally focused on modeling to support operational, synoptic prediction, the original NOAANavy-Air Force partnership recognized a need to support longer-range decisions, and has expanded to include other government partners involved in long-term weather and climate modeling research: NASA, the Department of Energy, and the National Science Foundation. The goal of the models coordinated by ESPC cover timescales from the synoptic – a single point in time – out to 30 years in the future. “Naval bases are always built at the coasts,” said Carman; these areas are subject to future sea level rise. “Air Force bases are built in areas of flat land, which tend to be tidewater areas near the coasts – so they have those same problems. The Air Force also has facilities in the Arctic, which are encountering some problems with