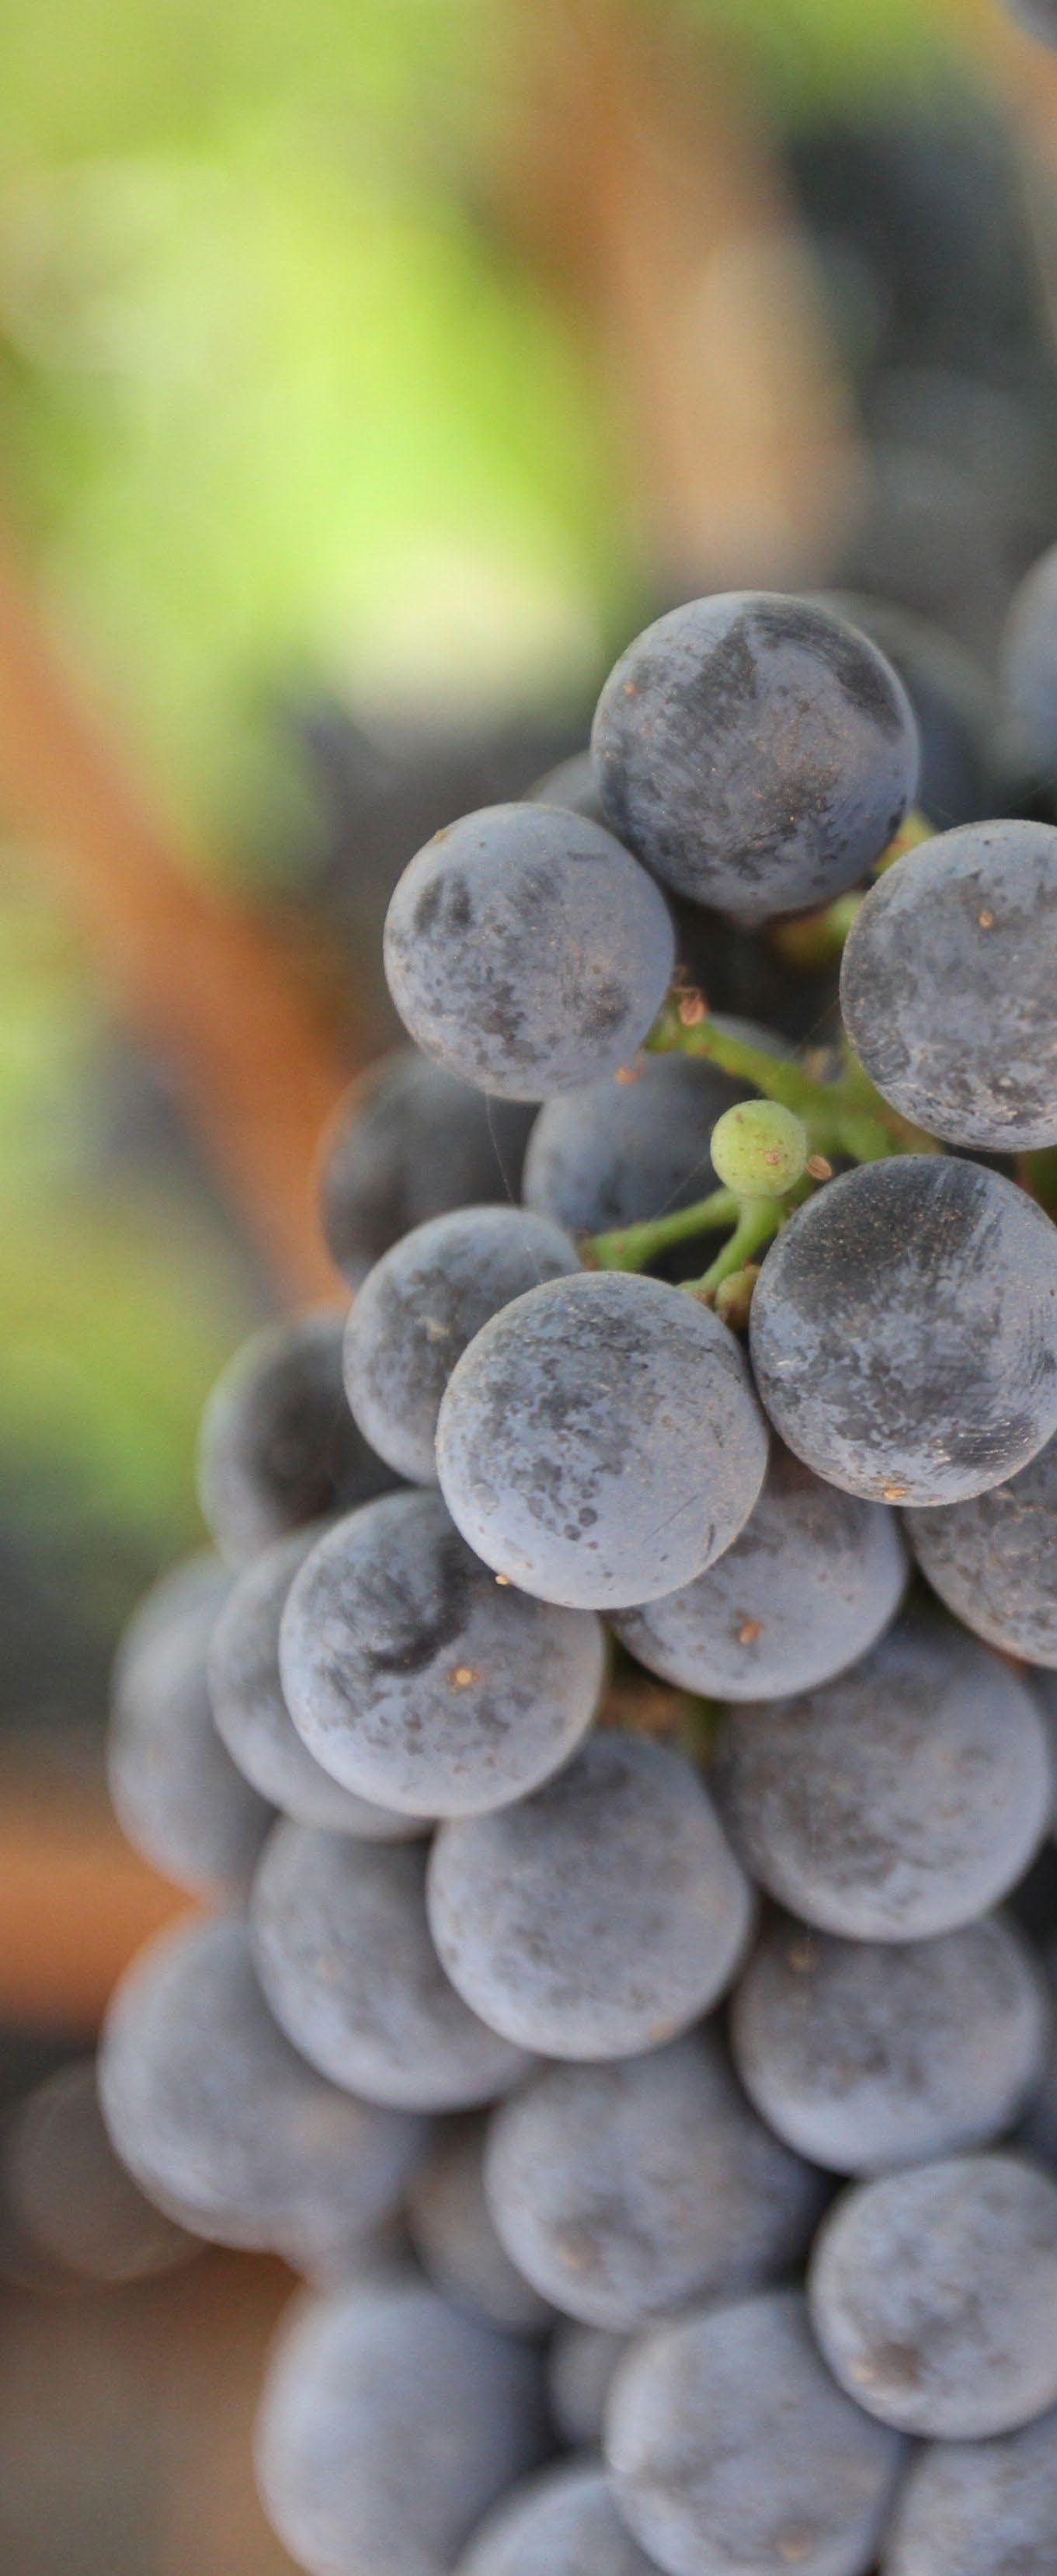
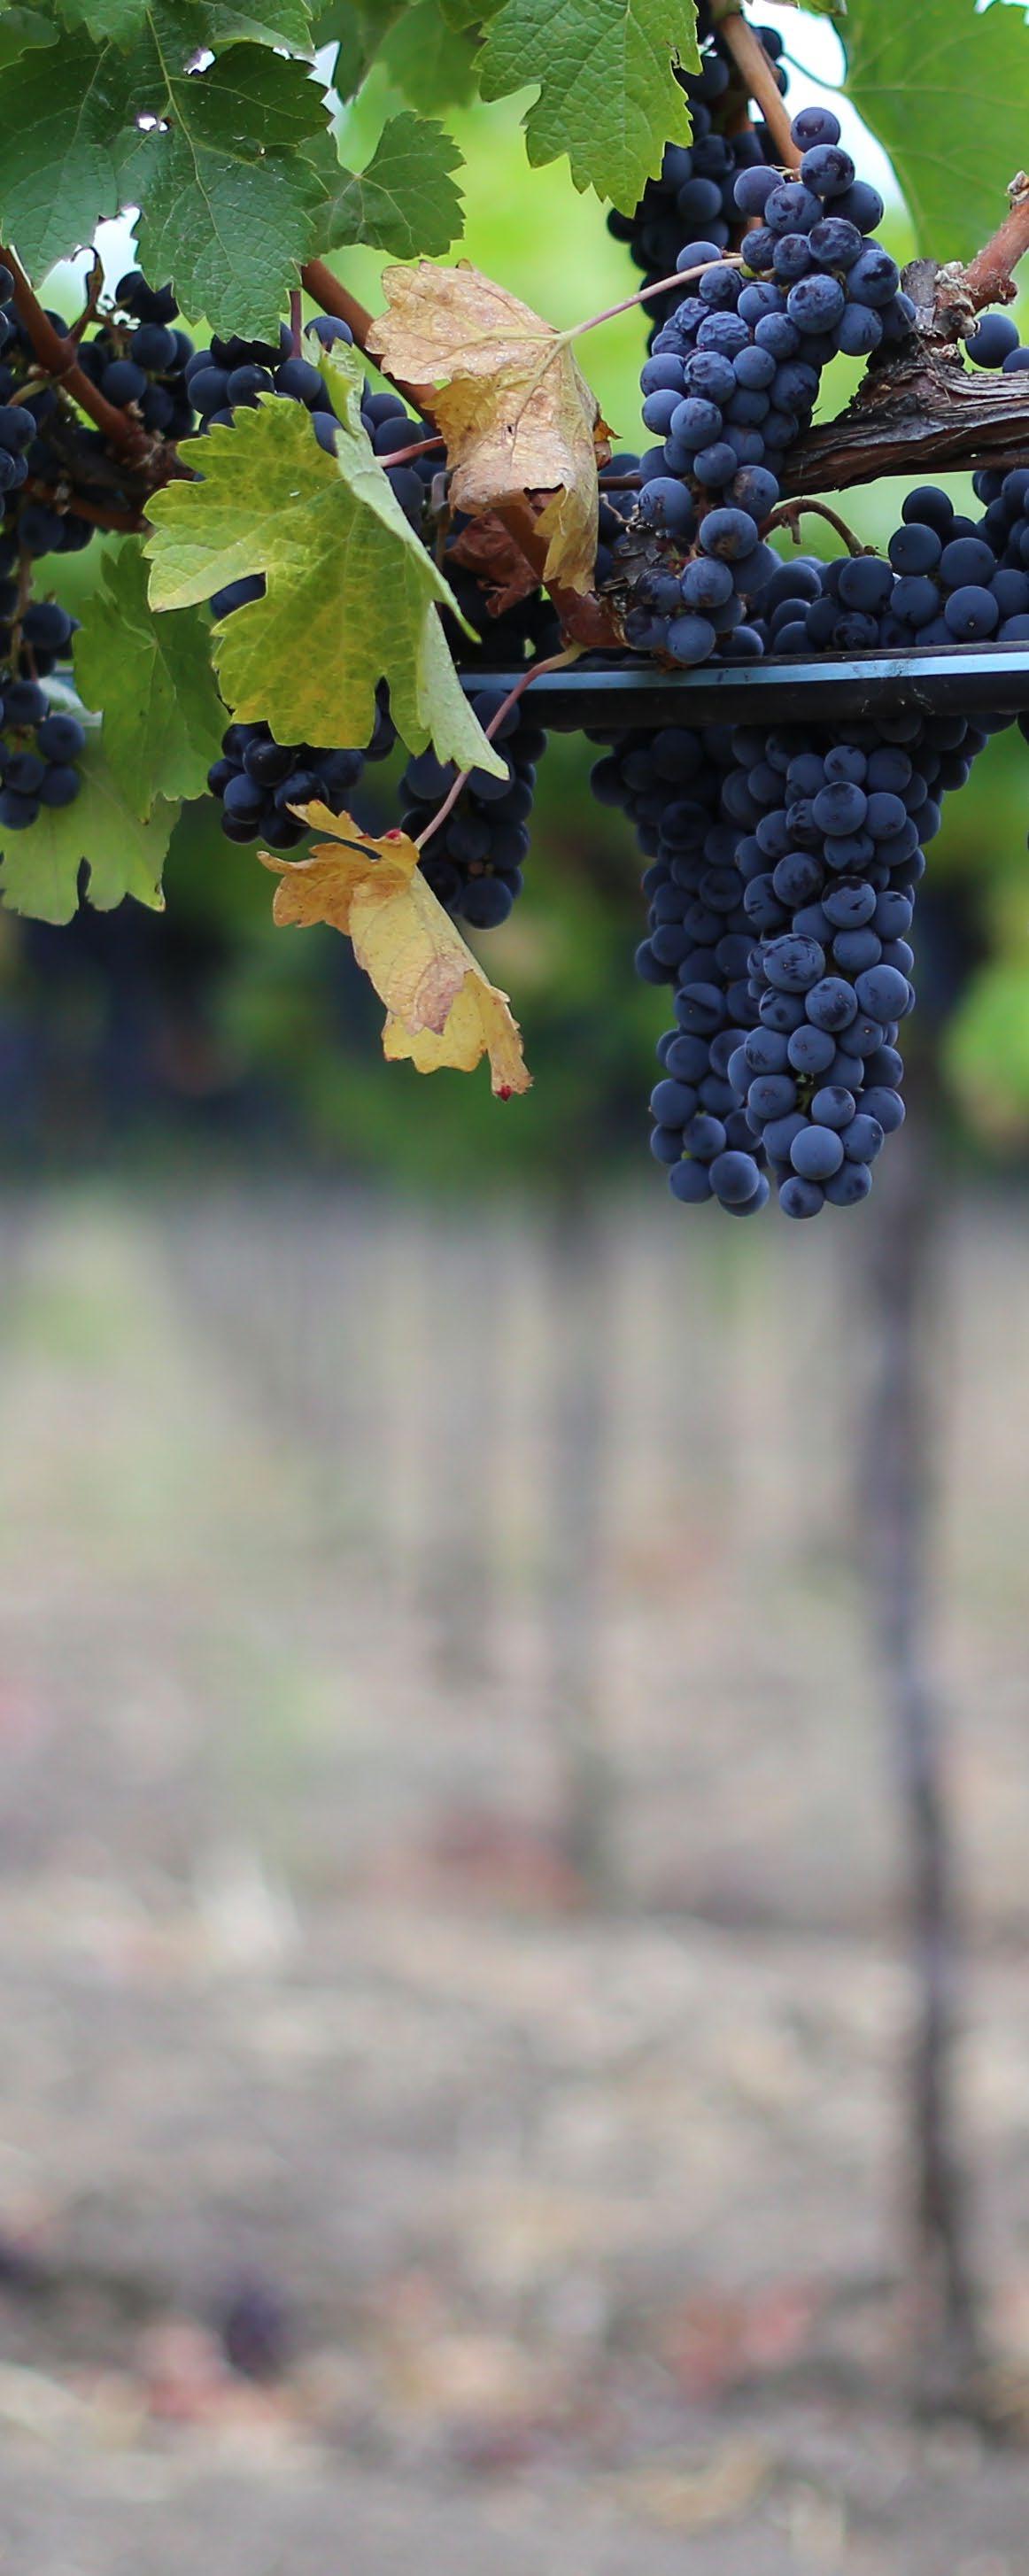
HARVEST GUIDE

ETS LABORATORIES | 2023

pages 01-02
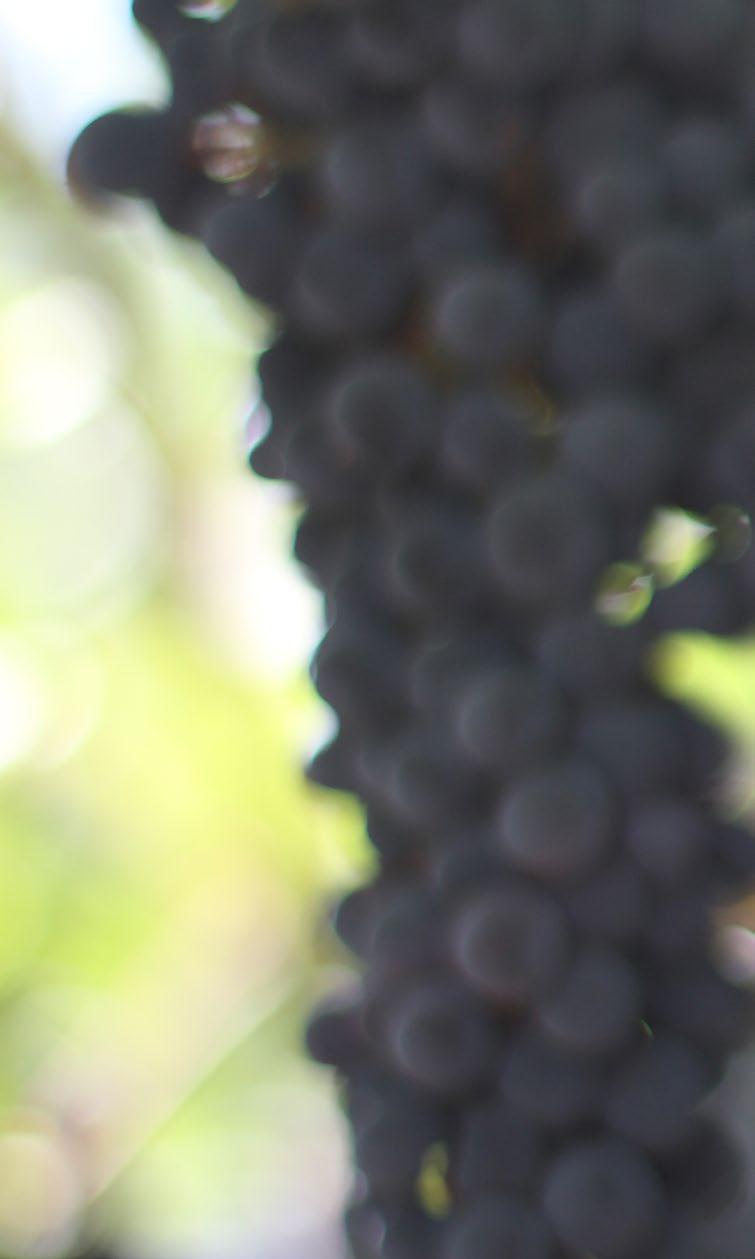
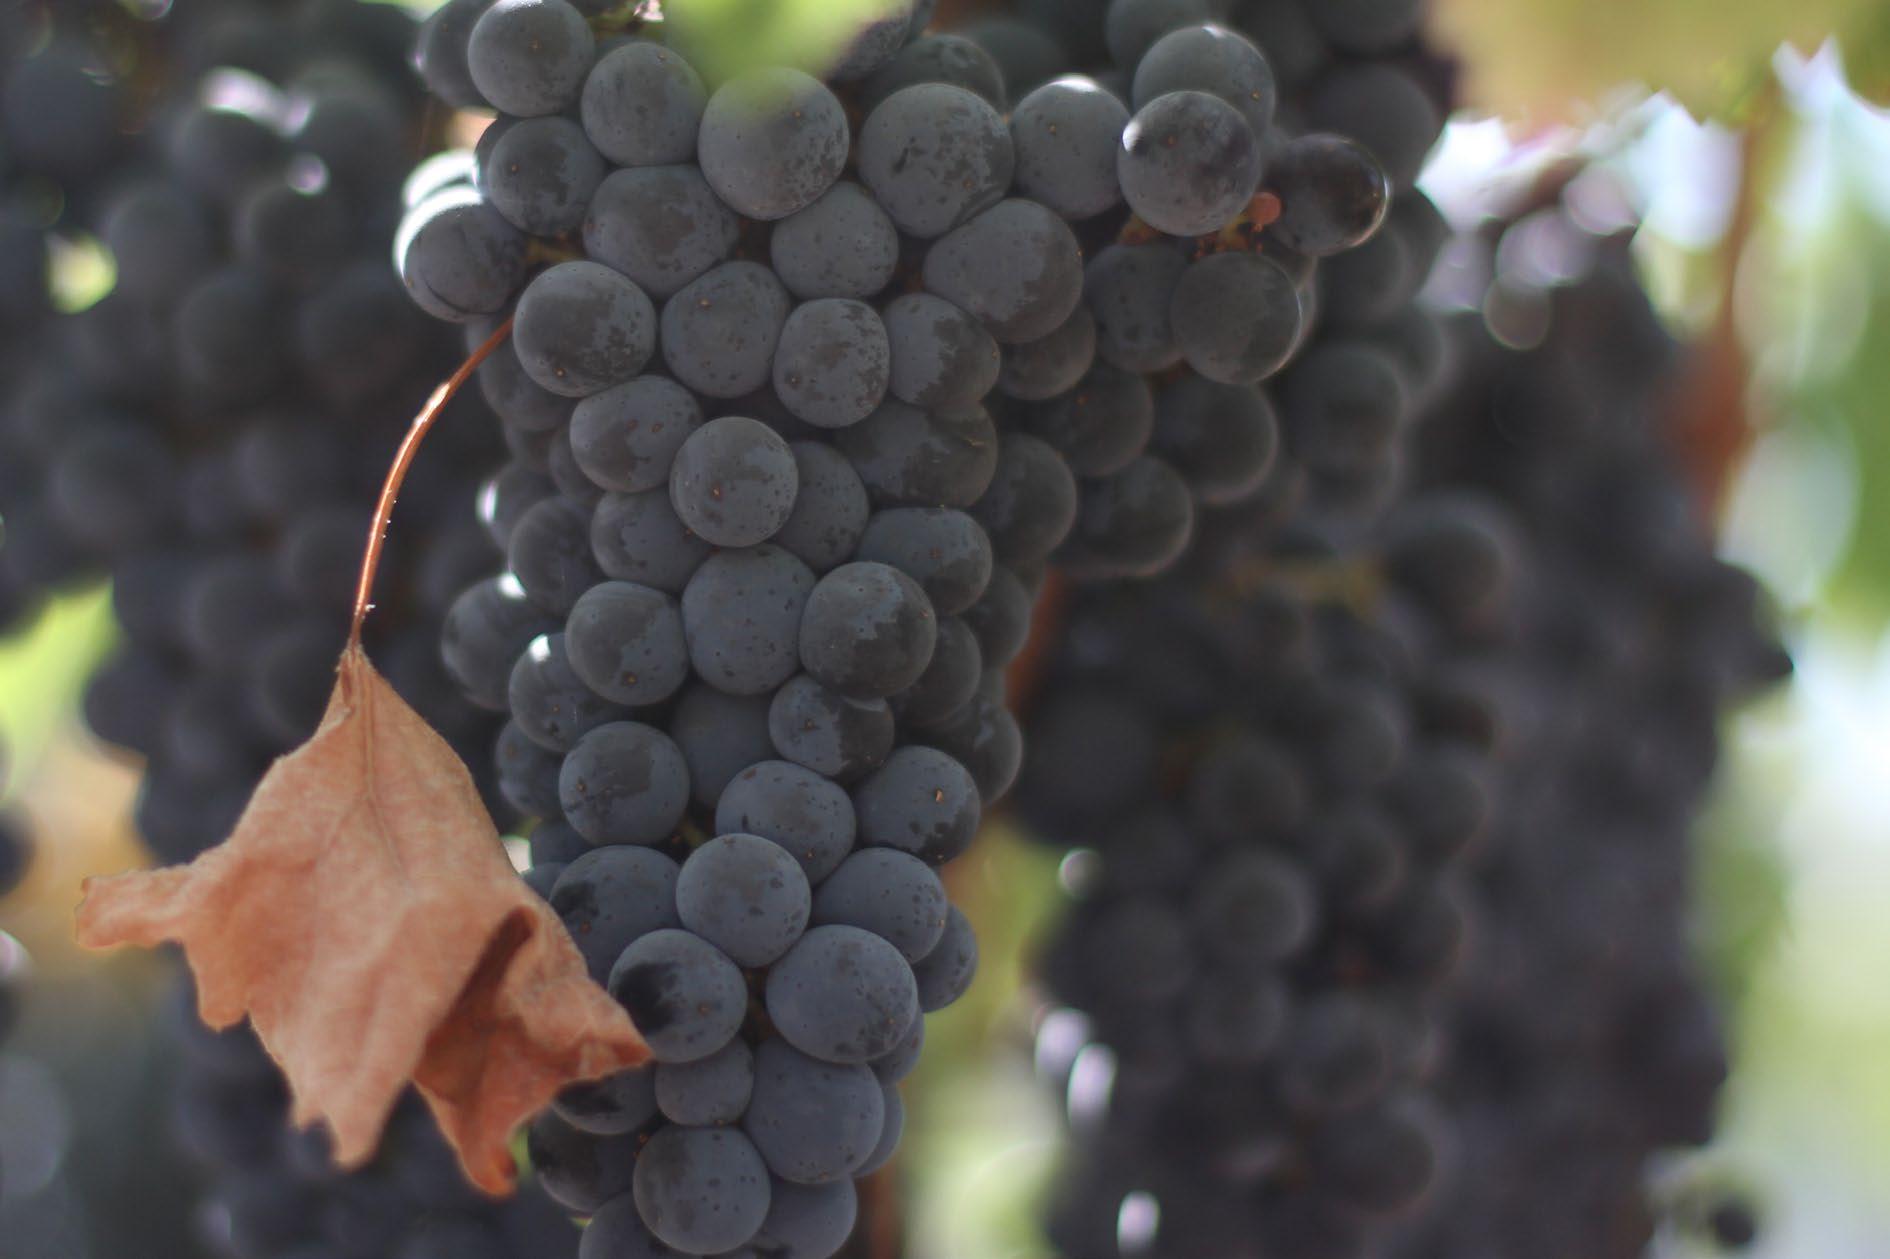
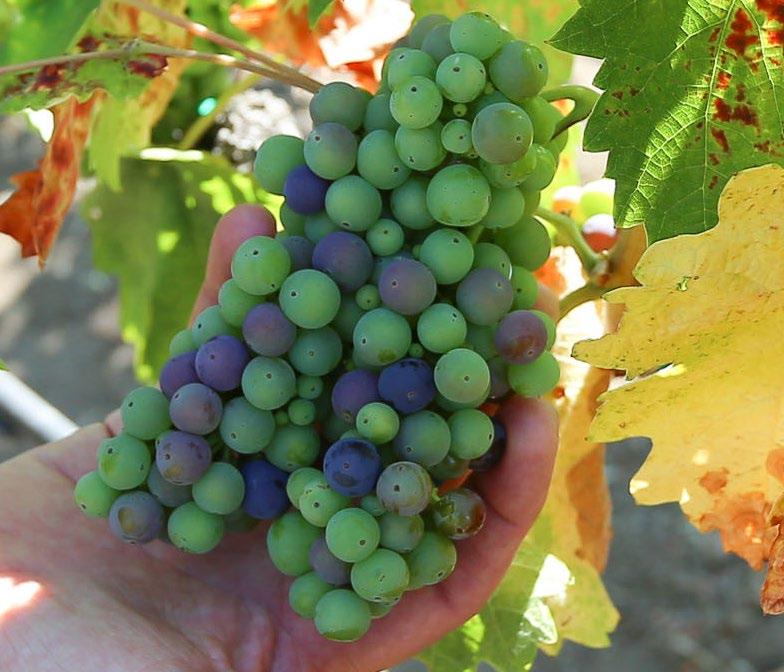
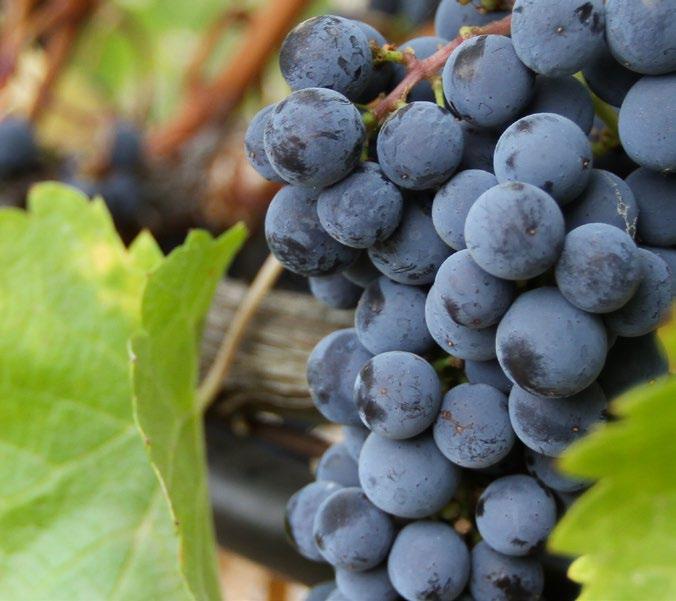
Maturity Monitoring: The ETS Grape Maturity Monitoring Panels provide sets of analyses requested to monitor fruit maturity.
pages 03-32
ETS Juice Panel : Get the complete picture for informed winemaking with the harvest Juice Panel and insights from the 2022 Harvest.
pages 33-34
Scorpions : Find out what microbes are coming in on your grapes using Scorpion diagnostics.
page 35-36
Non-Saccharomyces Yeasts Diagnostics: The PCR-based diagnostics can be used to determine implant success with commercial strains of non-Saccharomyces yeasts.
page 37-38
Measuring Proteins in Juice: ETS has developed Enzyme-Linked Immunosorbent Assays (ELISA) to monitor proteins associated with heat instability.
pages 39-40
Volatile Acidity: Recognize the microbes and conditions that lead to VA formation to develop an effective monitoring and prevention program.
page 41-42
Potential Alcohol: Get a closer look at using glucose+fructose analysis to estimate potential alcohol.
page 43-44
Sugar Analysis: Sugar can mean a number of things. See what's behind your "Residual Sugar" numbers.
pages 45-48
Phenolics Program: ETS offers a full suite of advanced HPLC-based analytical tools to evaluate phenolic compounds in grapes and wines.
pages 49-50
Aromas: Detect and prevent common (and uncommon) sensory flaws.
pages 51-56
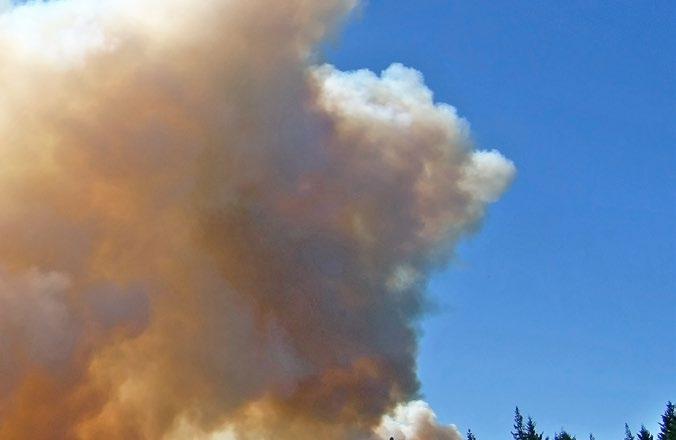
The Impact of Wildfires: ETS offers an extended panel for volatile smoke markers and a glycosylated markers panel this harvest.
pages 57-62
Wildfire Impact FAQ: Your most-asked questions, answered.
pages 63-65
Harvest Toolkit: This short guide will give you the highlights of our most-requested Harvest testing.
page 67-68
Harvest Satellite Analysis: Use this quick reference to see which Juice Analyses are offered at your local lab.
pages 69-70
Sampling and Shipping: Make sure you get the most out of your results using these sampling guidelines.
pages 71-76 Our Locations p. 72- St. Helena p. 73- Healdsburg p. 74- Paso Robles p. 75- Newberg p. 76- Walla Walla
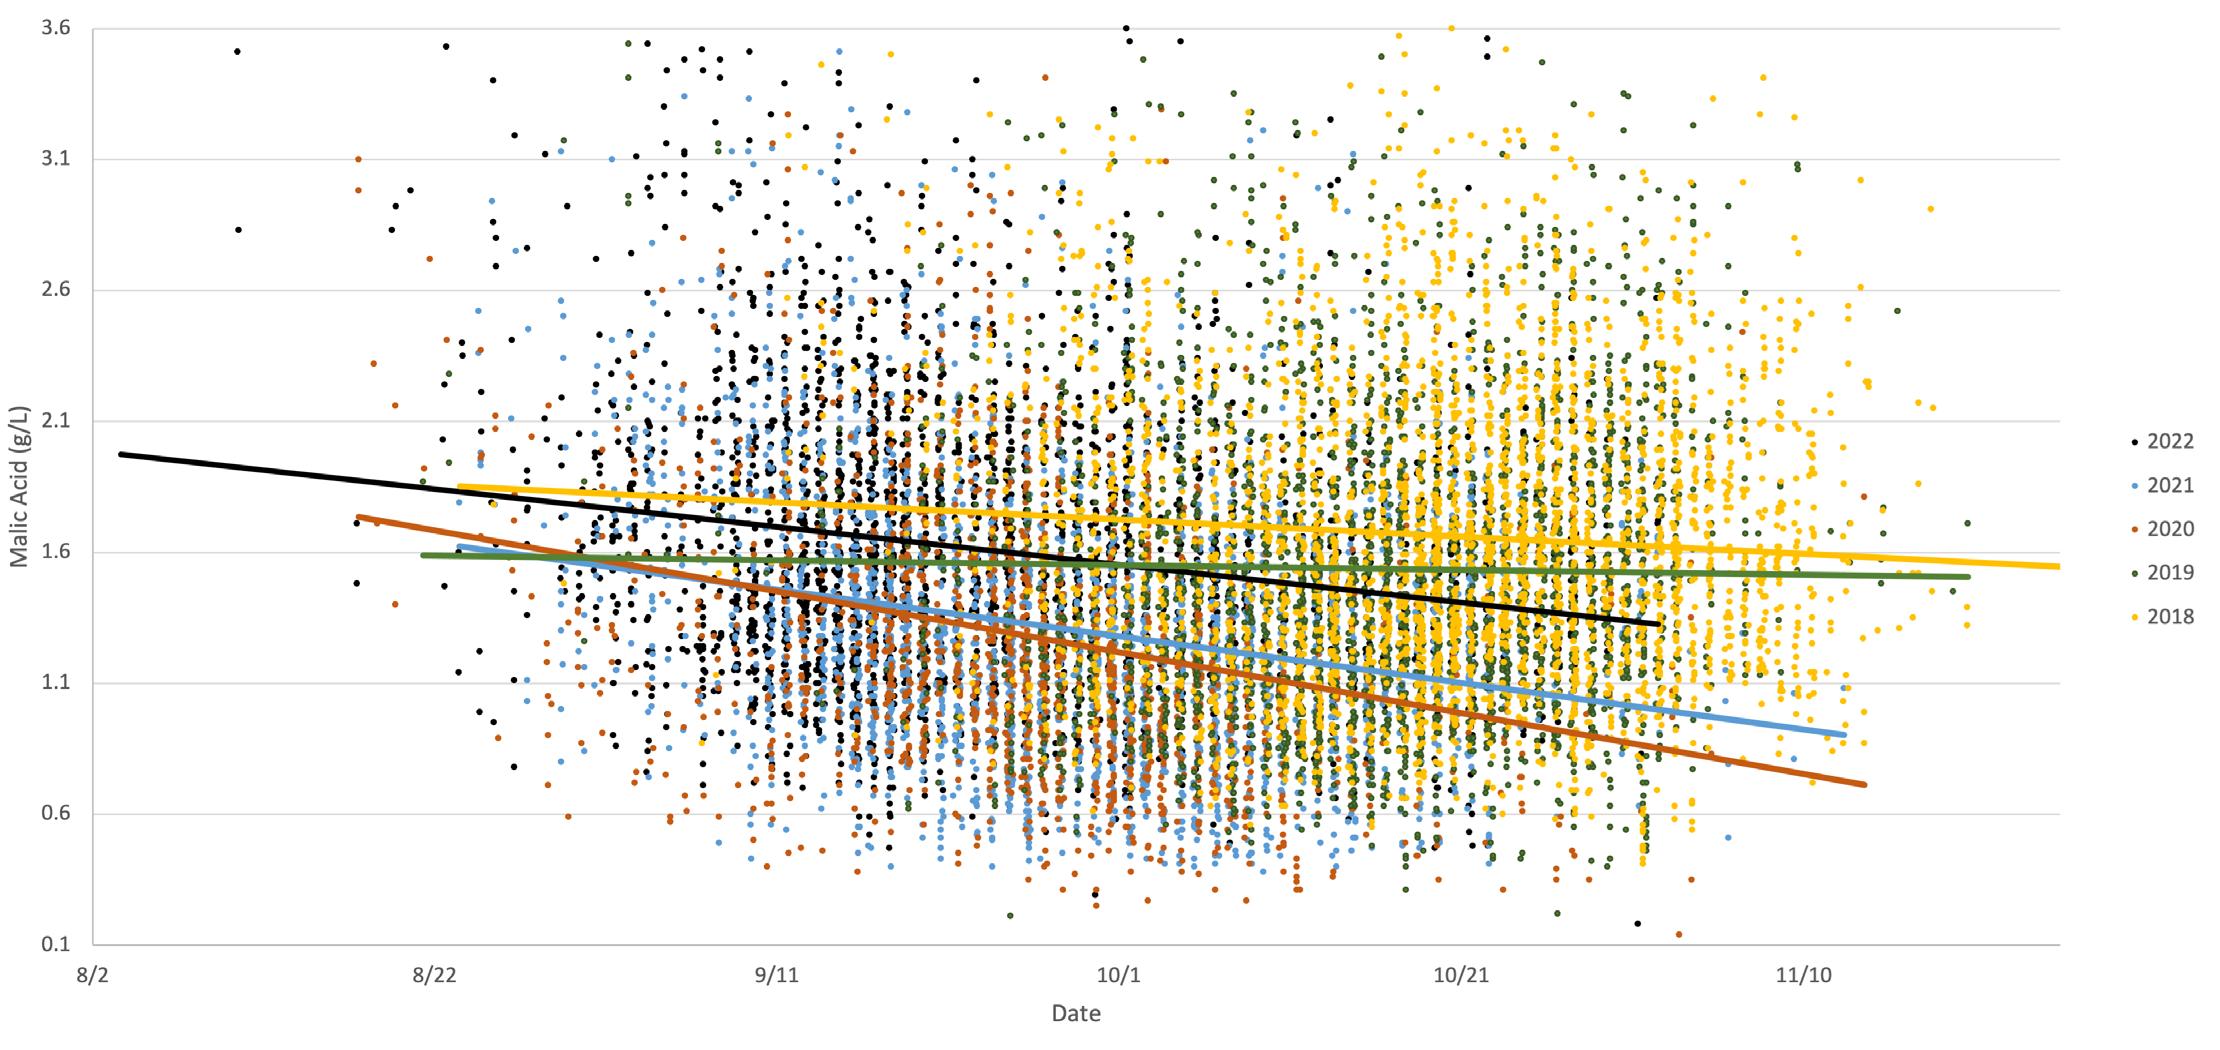
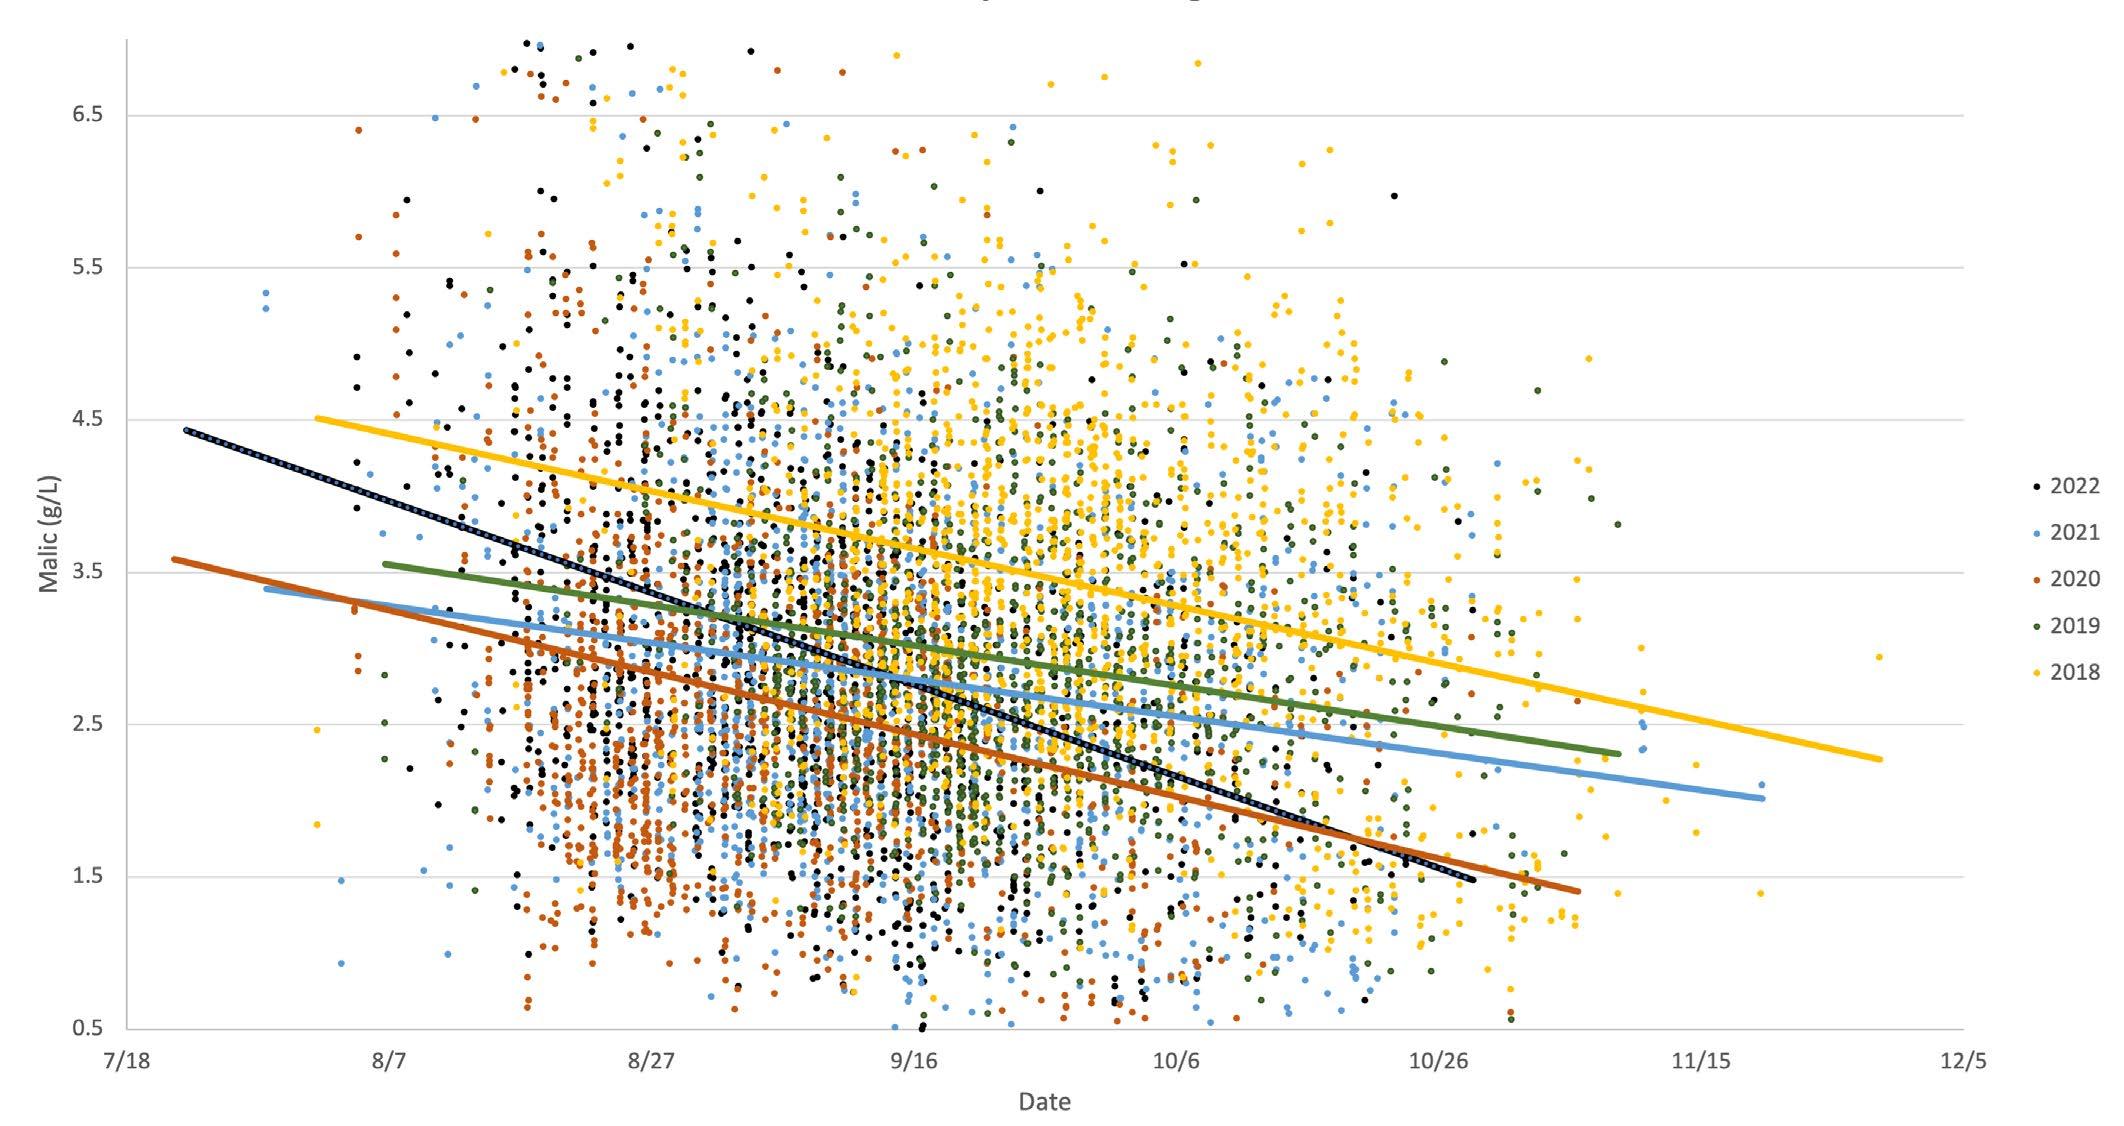
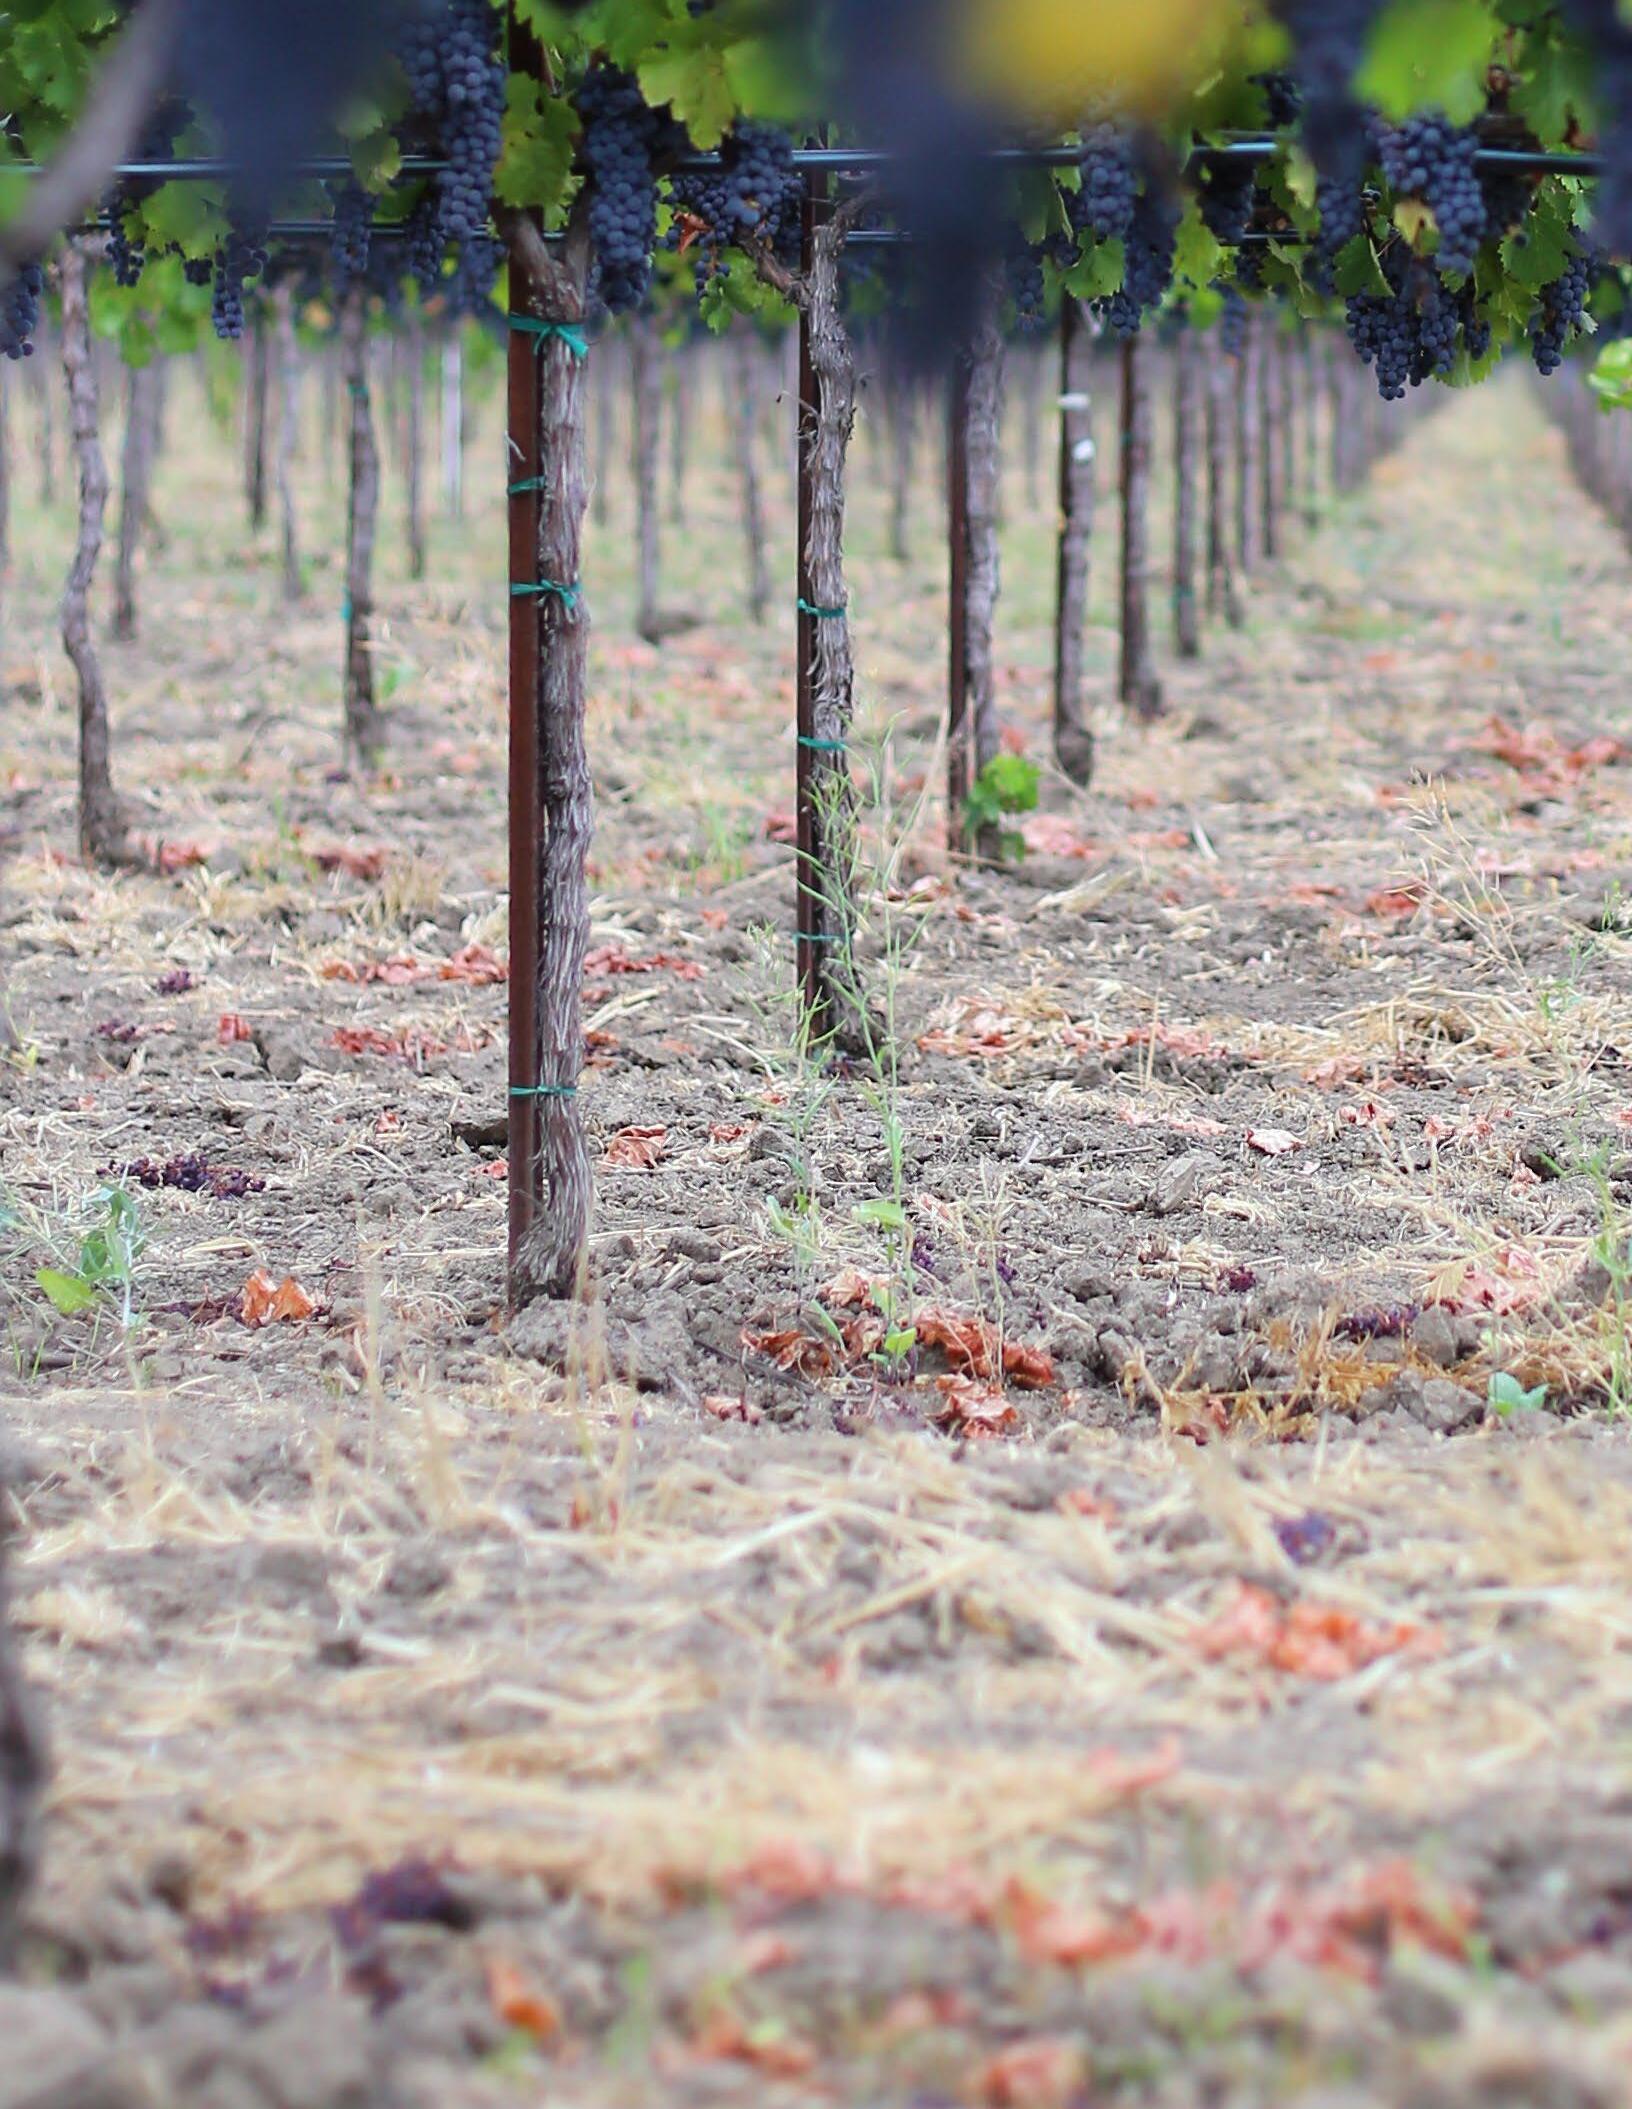
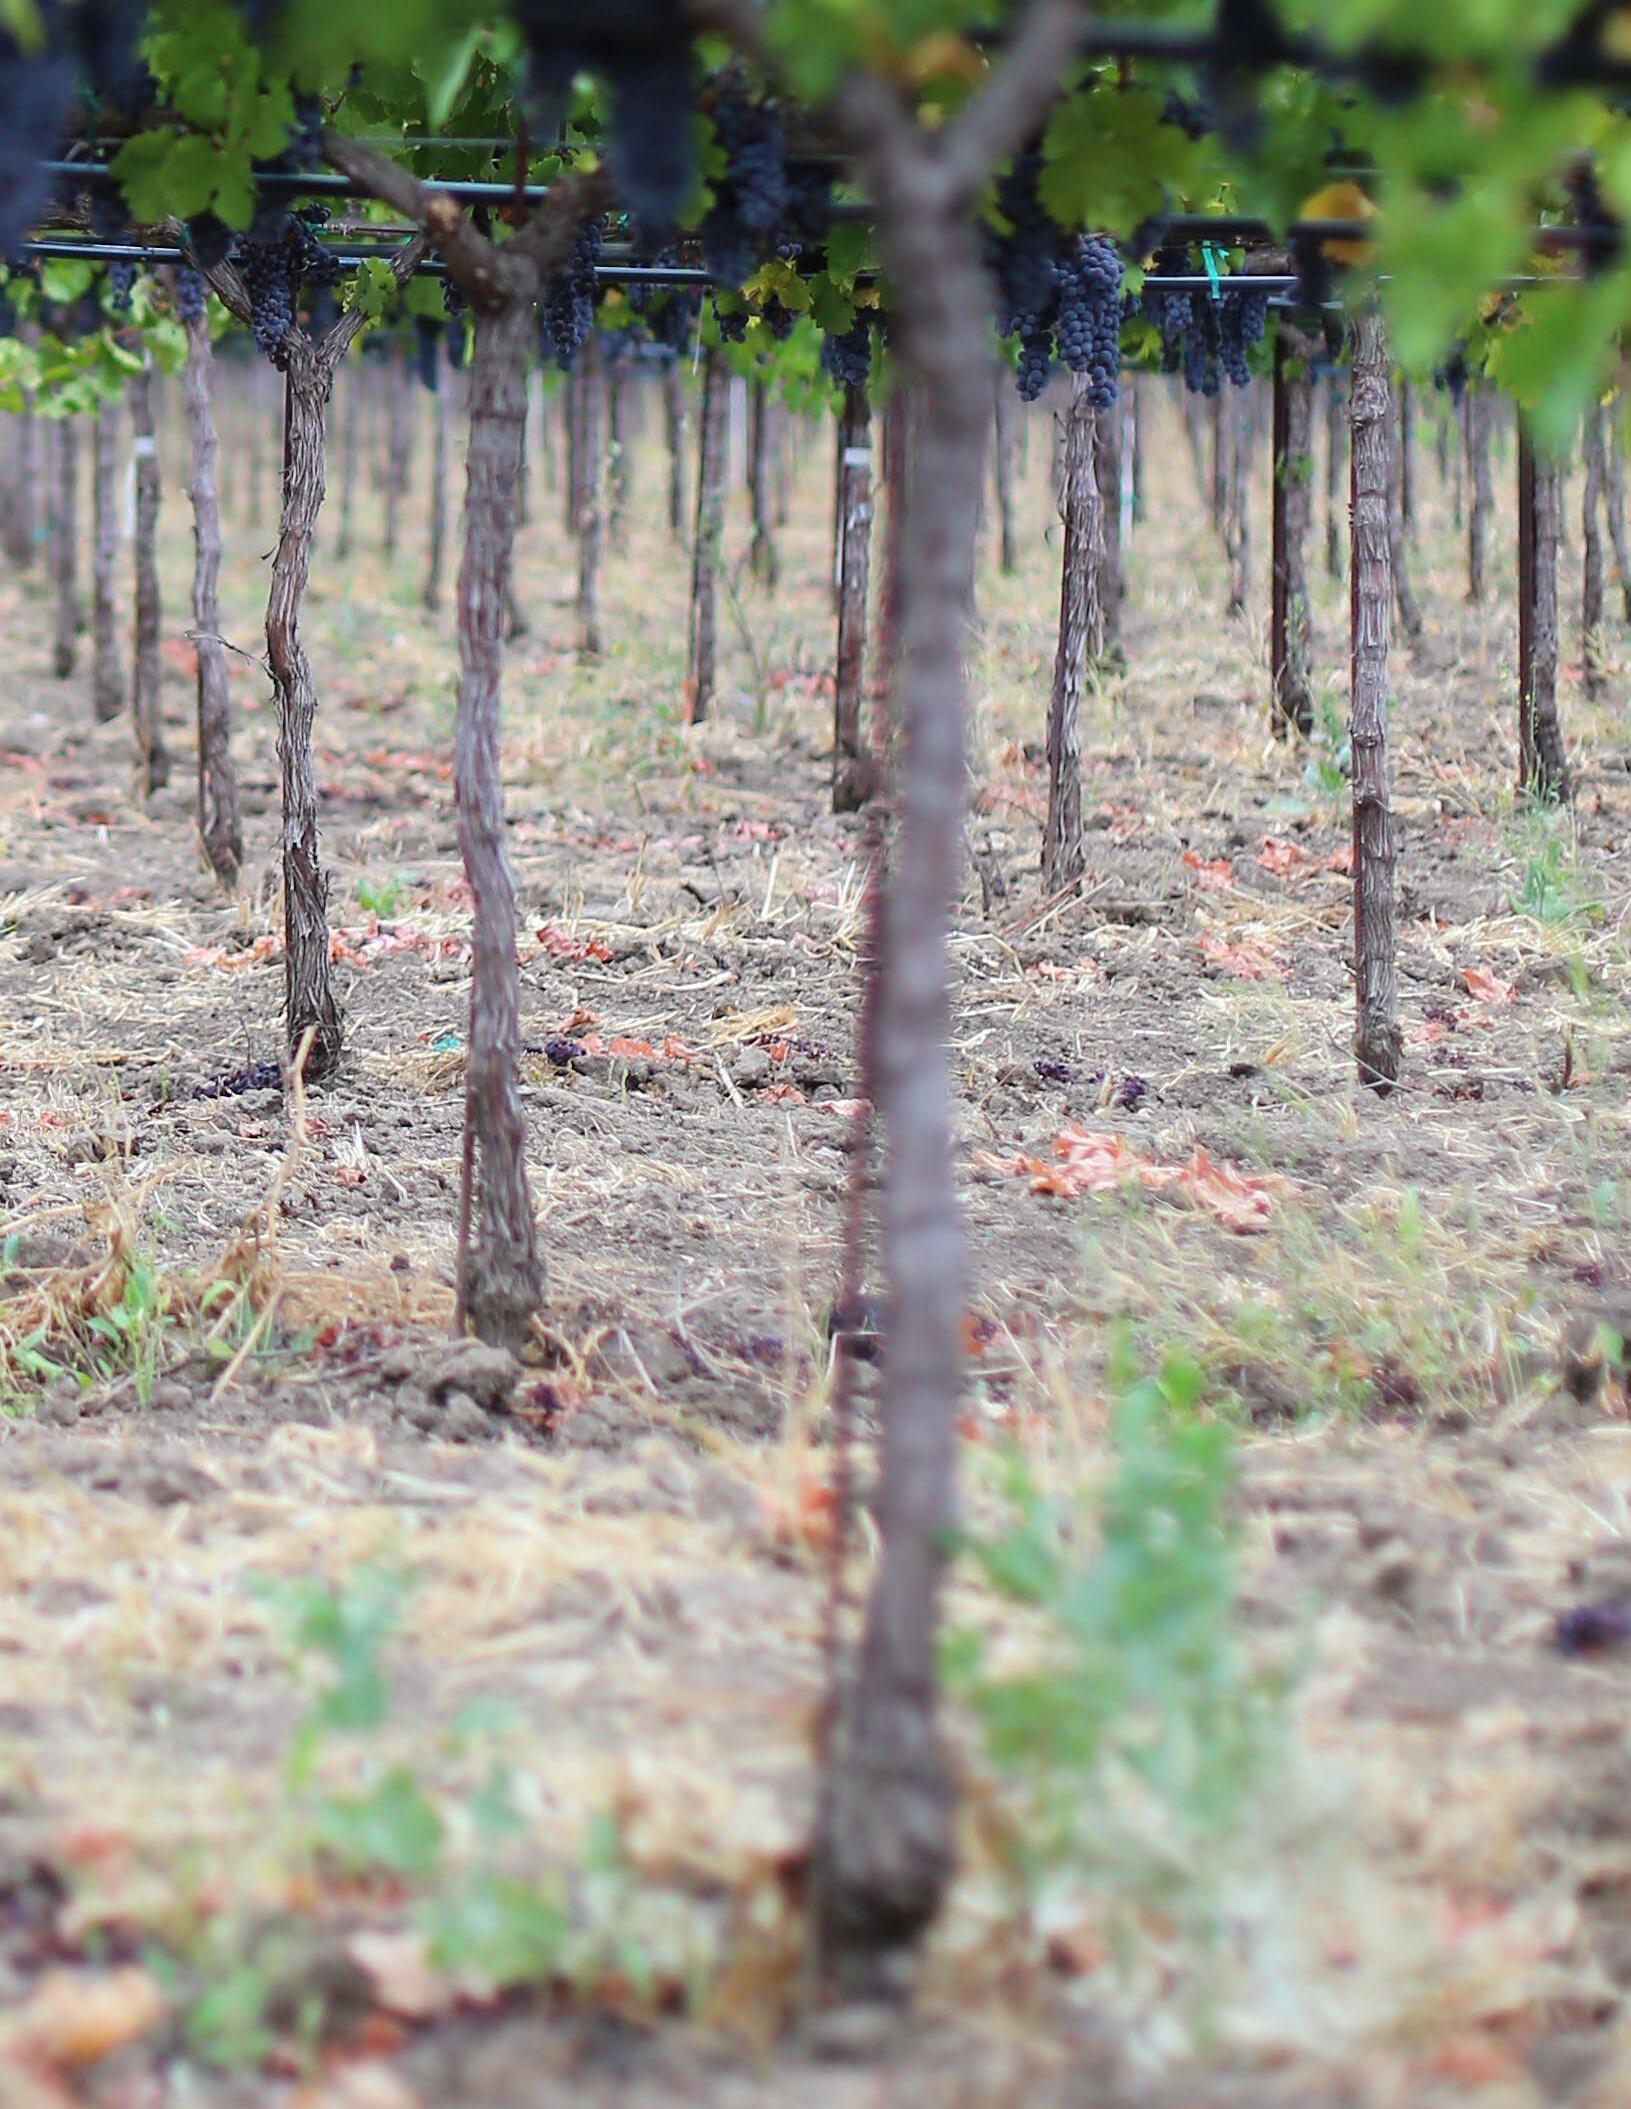
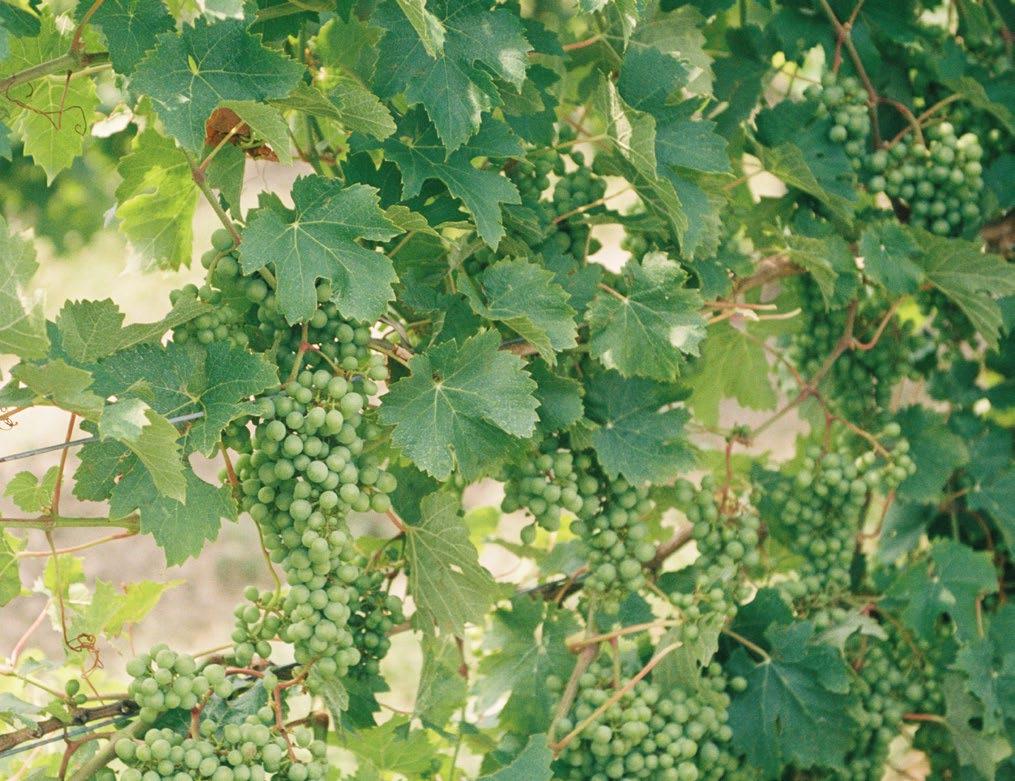
The ETS Grape Maturity Monitoring Panels provide sets of analyses requested to monitor fruit maturity. They include the traditional measurements of juice solids (Brix) and acidity (Titratable Acidity and pH), enhanced by the addition of a more accurate determination of fermentable sugars (glucose + fructose) and malic acid, as the degradation of this organic acid is a well-known marker of ripening.
They also include berry size parameters (volume and weight), as well as a less familiar measurement: sugar per berry. Sugar per berry is a calculation based on the average berry volume as measured by Dyostem®, the tool of choice to determine sugar on a per-berry basis. The Dyostem® also provides an assessment of berry volume variability expressed as a Coefficient of Variation (%) and a histogram of the berry volume distribution is provided in our reports.
Monitoring Sugar per Berry, starting shortly after veraison, allows growers to determine the duration and rate of sugar loading. During this phase, vines synthesize and actively transport sugar into berries. At the end of this phase, Brix usually keeps increasing due to berry dehydration, however, and simply monitoring Brix cannot determine when the sugar loading phase stops. Conversely, when this point is reached, the actual quantity of sugar accumulated in each berry remains unchanged (see Fig 1).
The duration of the sugar loading phase, the time at which this phase ends, as well as the Brix achieved at that time, are all important indicators of wine growing conditions. Excessive or insufficient vigor, water availability and resistance to heat stress all have an impact. Vines under often desired moderate hydric stress conditions typically reach between 21 and 23
Brix at the end of sugar loading. In most cases vines with excessive vigor see their sugar loading stop before these levels are reached, as vegetative growth may compete with sugar synthesis and accumulation. Such vines also often poorly resist heat waves and tend to “shut down” more easily, which can prompt a sudden end of sugar accumulation in berries. At the other end of the spectrum, vines under excessive water stress, subject to nutrient deficiencies or diseased, also have difficulty reaching typical Brix levels at the end of sugar loading (see Fig 2).
Furthermore, the end of sugar loading triggers a variety of maturity events influencing the development of grape aroma compounds and phenolics. It is often used as an indication of when to start grape phenolics measurements (see Vineyard Decisions – Grape Phenolic Panel p. 27).
Working Together: ETS is proud to be partnered with Fruition Sciences and Vivelys (Dyostem ®), to help you better characterize vineyards, closely monitor grape ripening, and make the most informed harvest decisions.

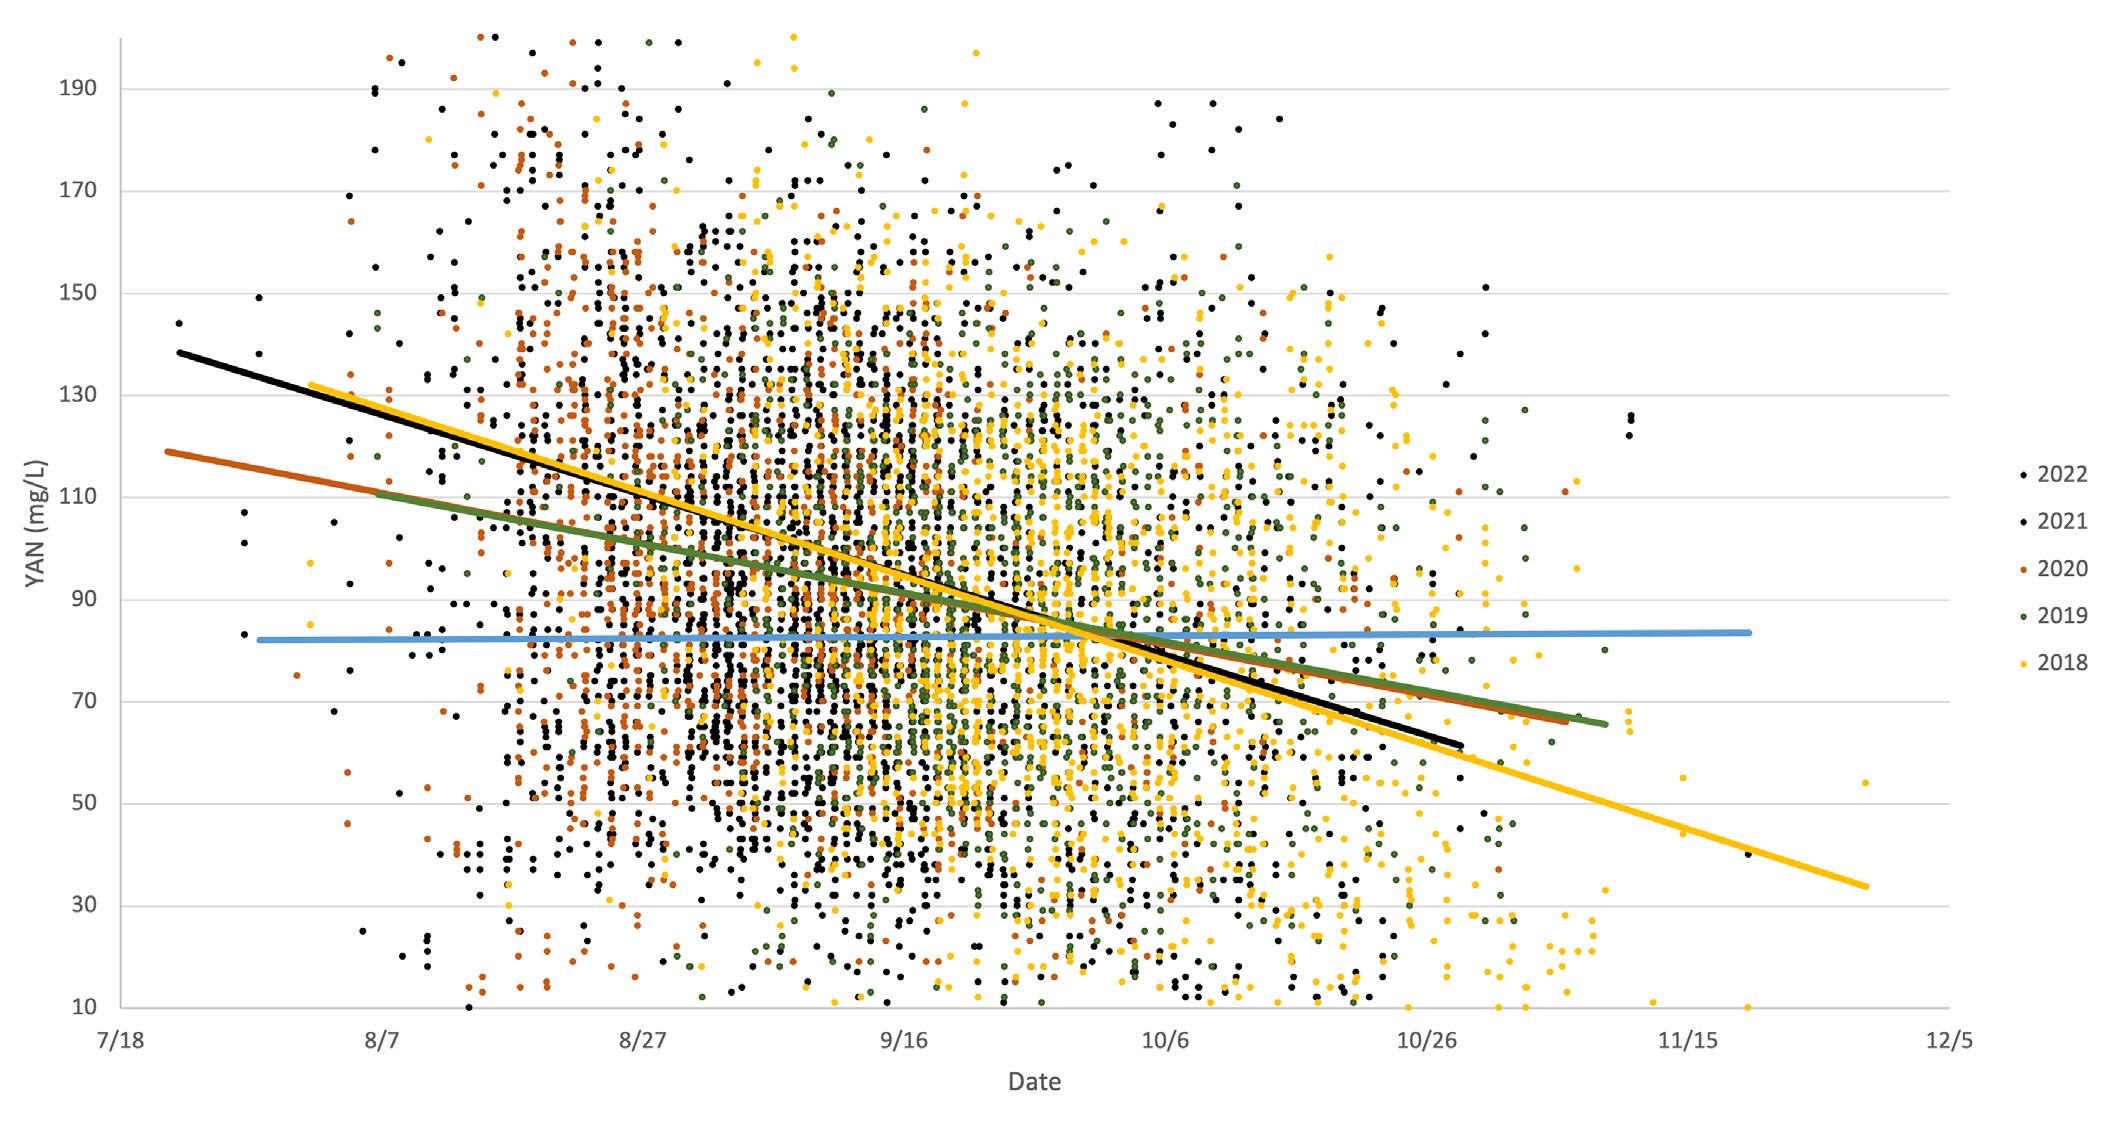
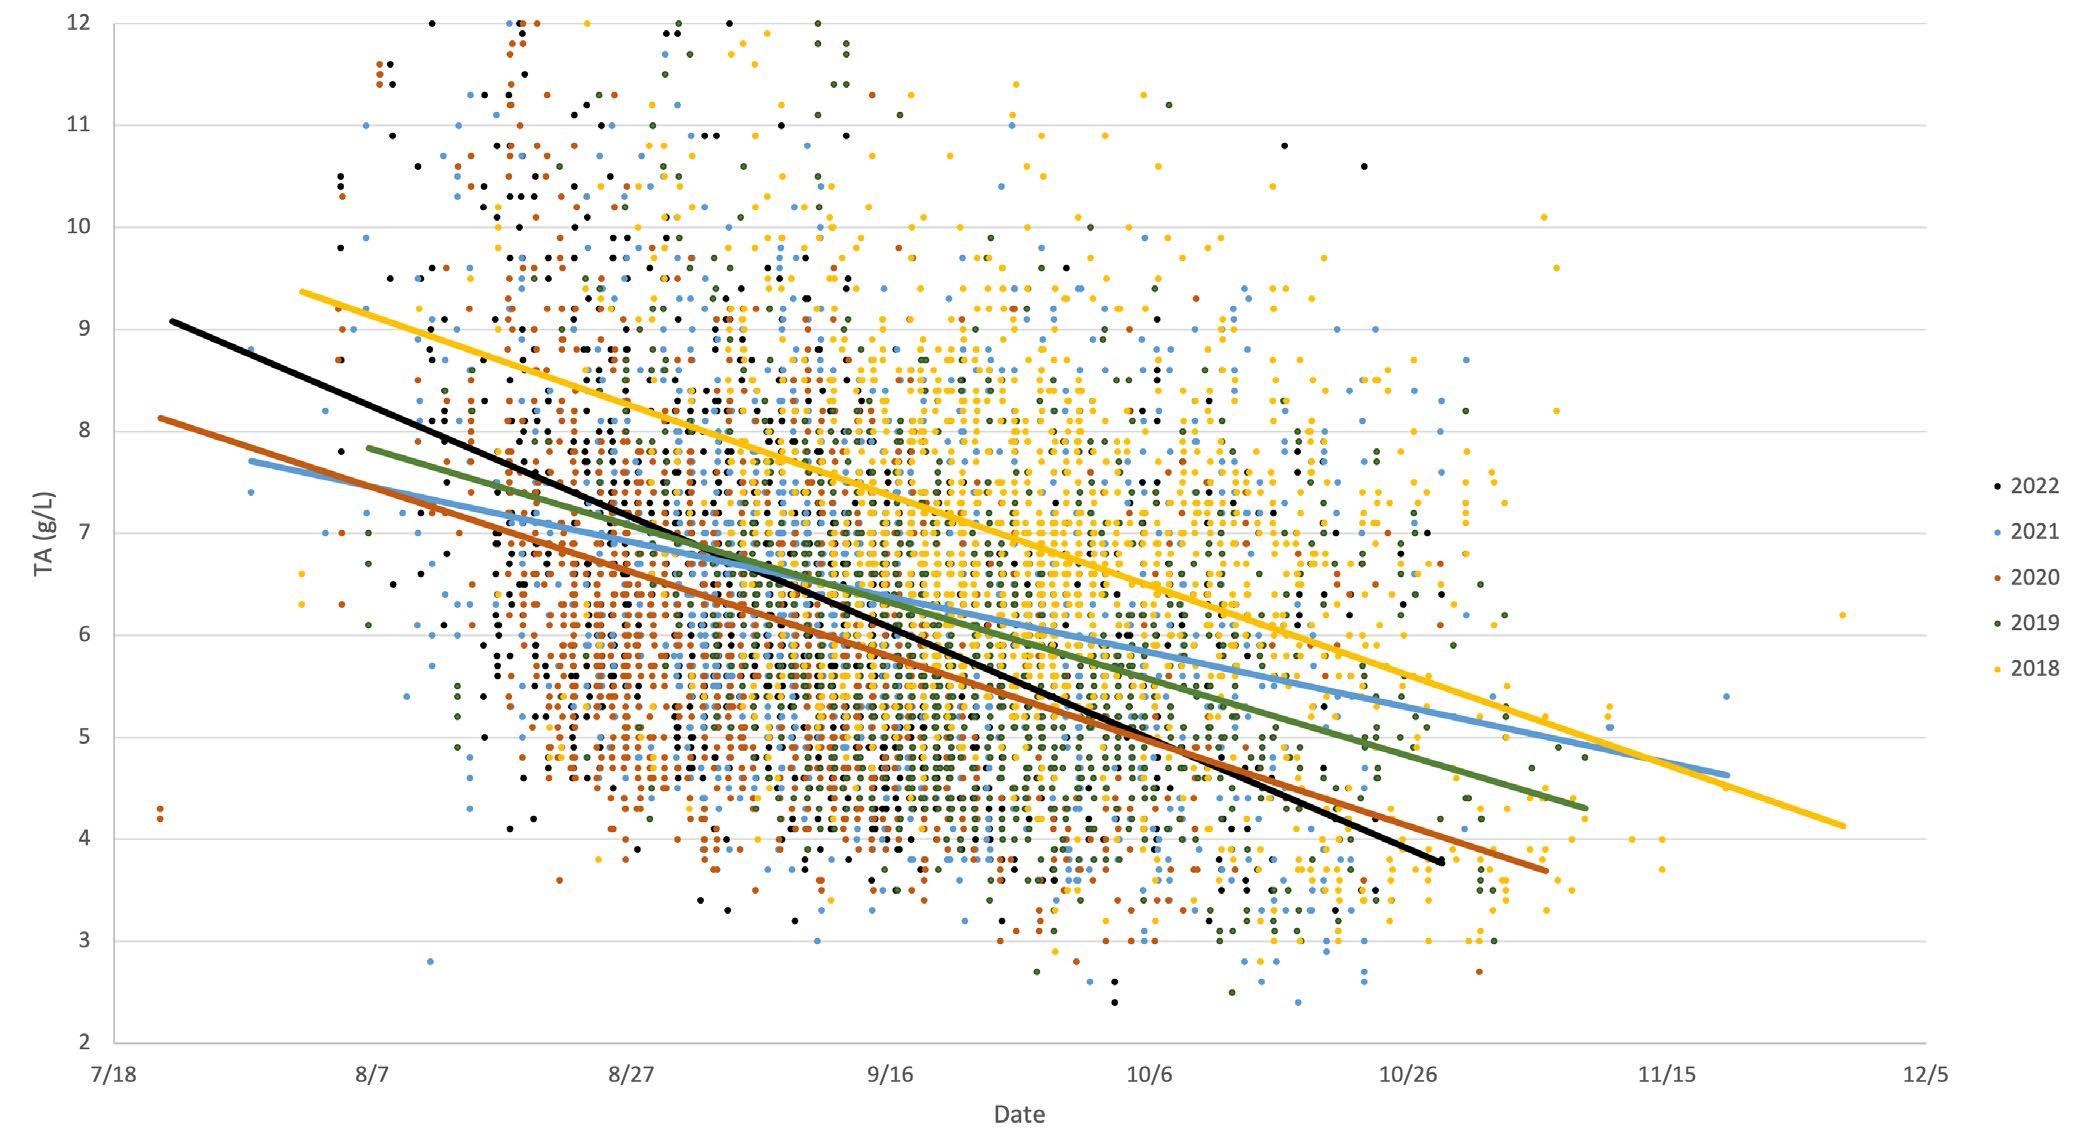
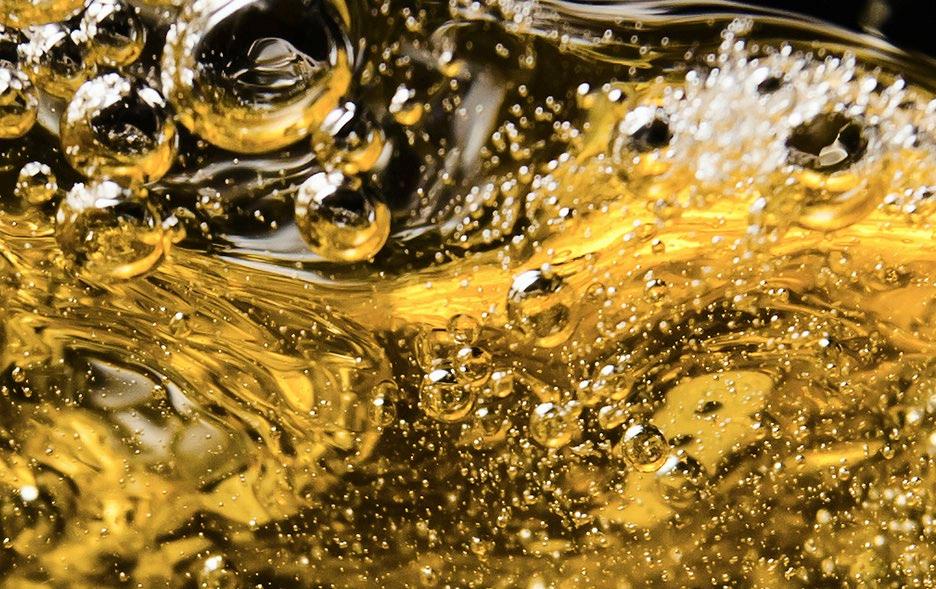
Winemakers rely on juice chemistry analysis for a more complete picture of must composition at harvest that goes beyond traditional TA, pH, and °Brix. This is critical as juice chemistry is often different from vintage to vintage. Combining modern tools gives vital insights to make informed vineyard management decisions, choose harvest dates, predict/ adjust wine composition and facilitate fermentations.
A thorough analytical picture gives winemakers the ability to better predict wine composition, and plan appropriate winemaking strategies in response to changing must compositions. Whether you analyze the freerun juice, monitor mid-fermentation chemistry, or do both, it is important to understand the analytical results in context within the fermentation process stage.
Analyzing juice pre-fermentation provides data that gives winemakers the opportunity to identify anything unusual about the current vintage, and to compare differences in composition from vintage to vintage. These insights affect winemaking decisions including acid adjustments and fermentation strategy.
Clients sometimes ask why they see a difference in the concentration of acids, or potential alcohol vs. final alcohol, when comparing their juice samples to mid- to end-stage fermentation samples.
It is not unusual to observe differences between the levels of acids, potassium and sugar/potential alcohol in different samples from the same vineyard. Variations can occur depending on the vineyard sampling strategy and how representative the samples are of the vineyard.
How juice samples are prepared matters, e.g. how thoroughly each grape sample is crushed and mixed. In white winemaking, the differences in composition between free run juices and the different press fractions are well known.
In red winemaking, free-run juices obtained after filling tanks may not reflect the actual content of the tank, since components such as acids and potassium can initially be sequestered at high levels in grape tissue next to the skin. As the grape tissue breaks down during cold soak, fermentation, and maceration, the resulting extraction of acids and potassium from the tissue into the juice can contribute to the observed differences.
Likewise, the sugar in raisins or shriveled grapes may take a long time to release during red winemaking, causing an underestimate of fermentable sugar and therefore potential alcohol. Mid-point analysis on the fermenting wine (analyzing glucose+fructose and ethanol) may give a more accurate picture of fermentable sugar and potential alcohol.
All of these factors can contribute to the differences observed between juice samples and the final wine composition.
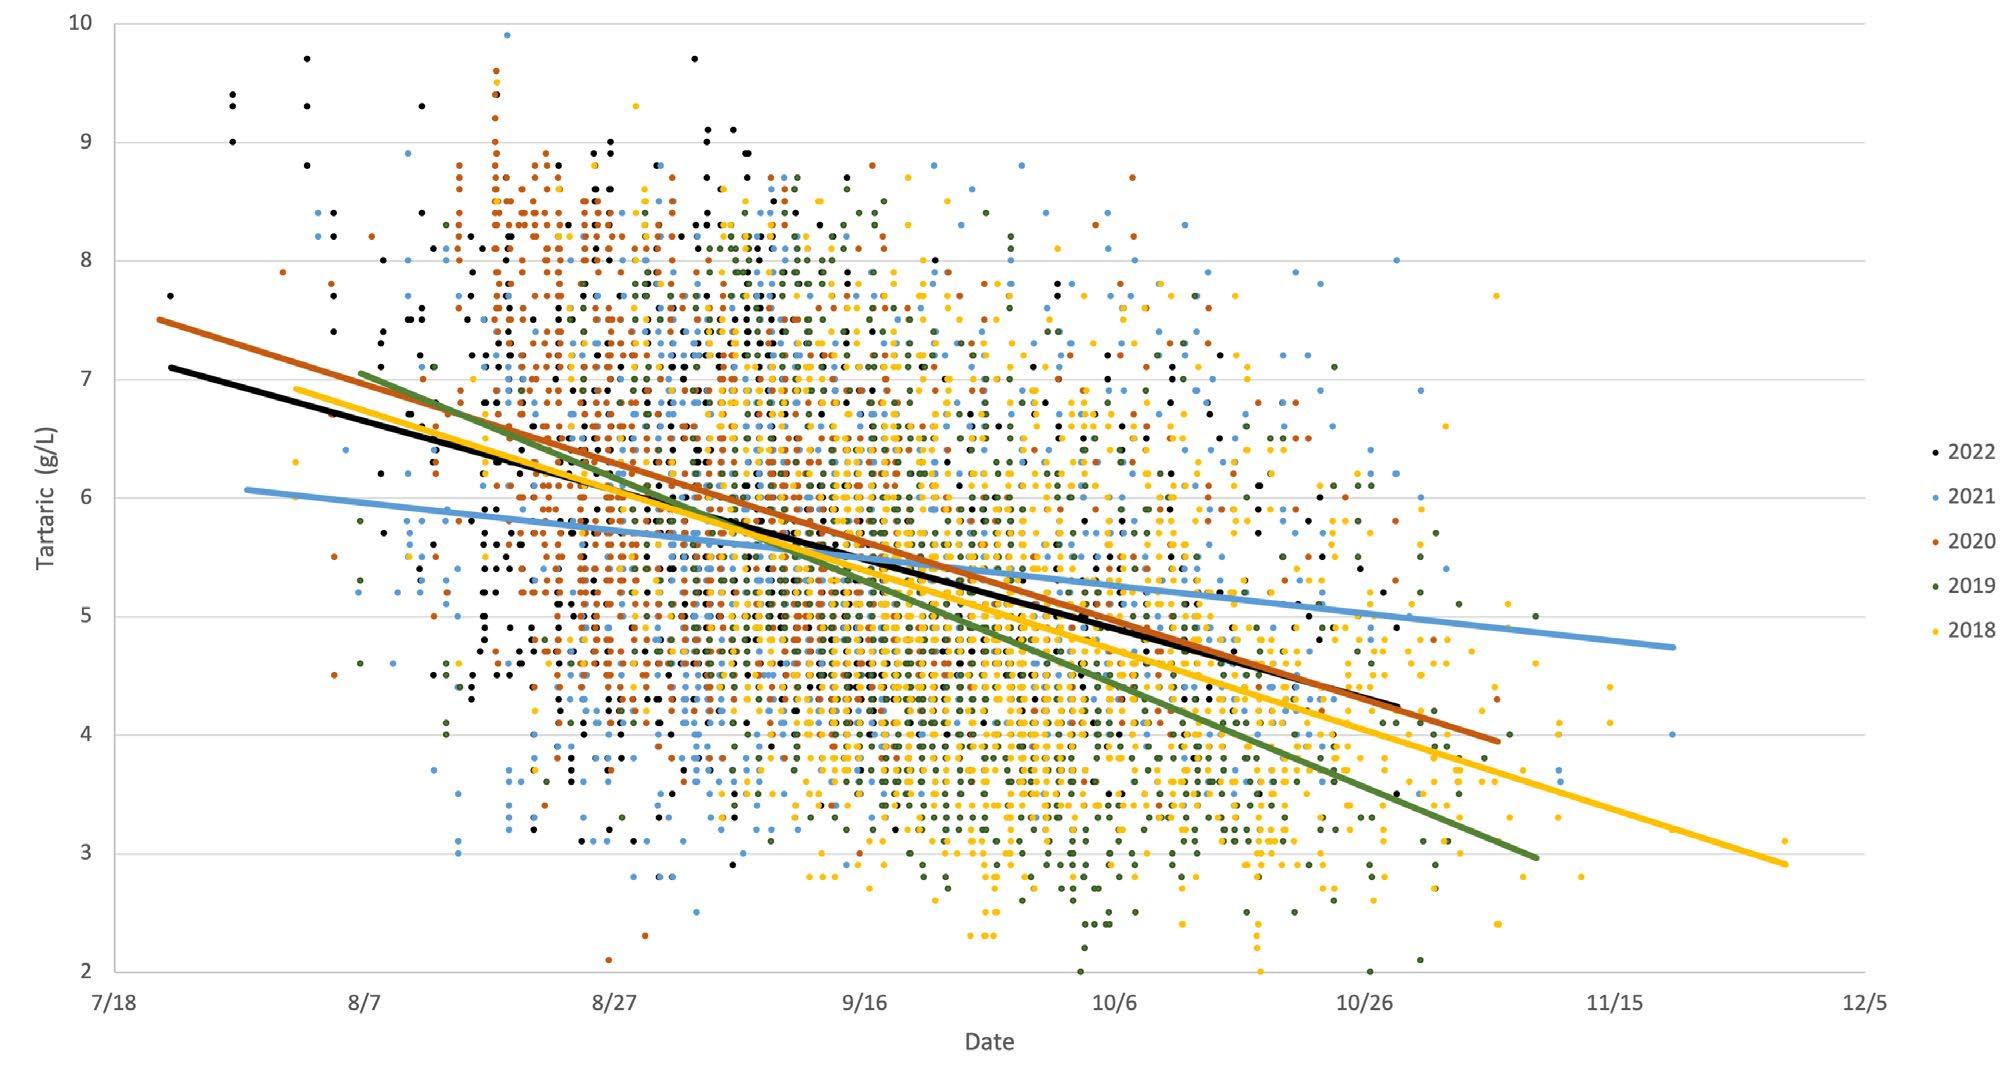
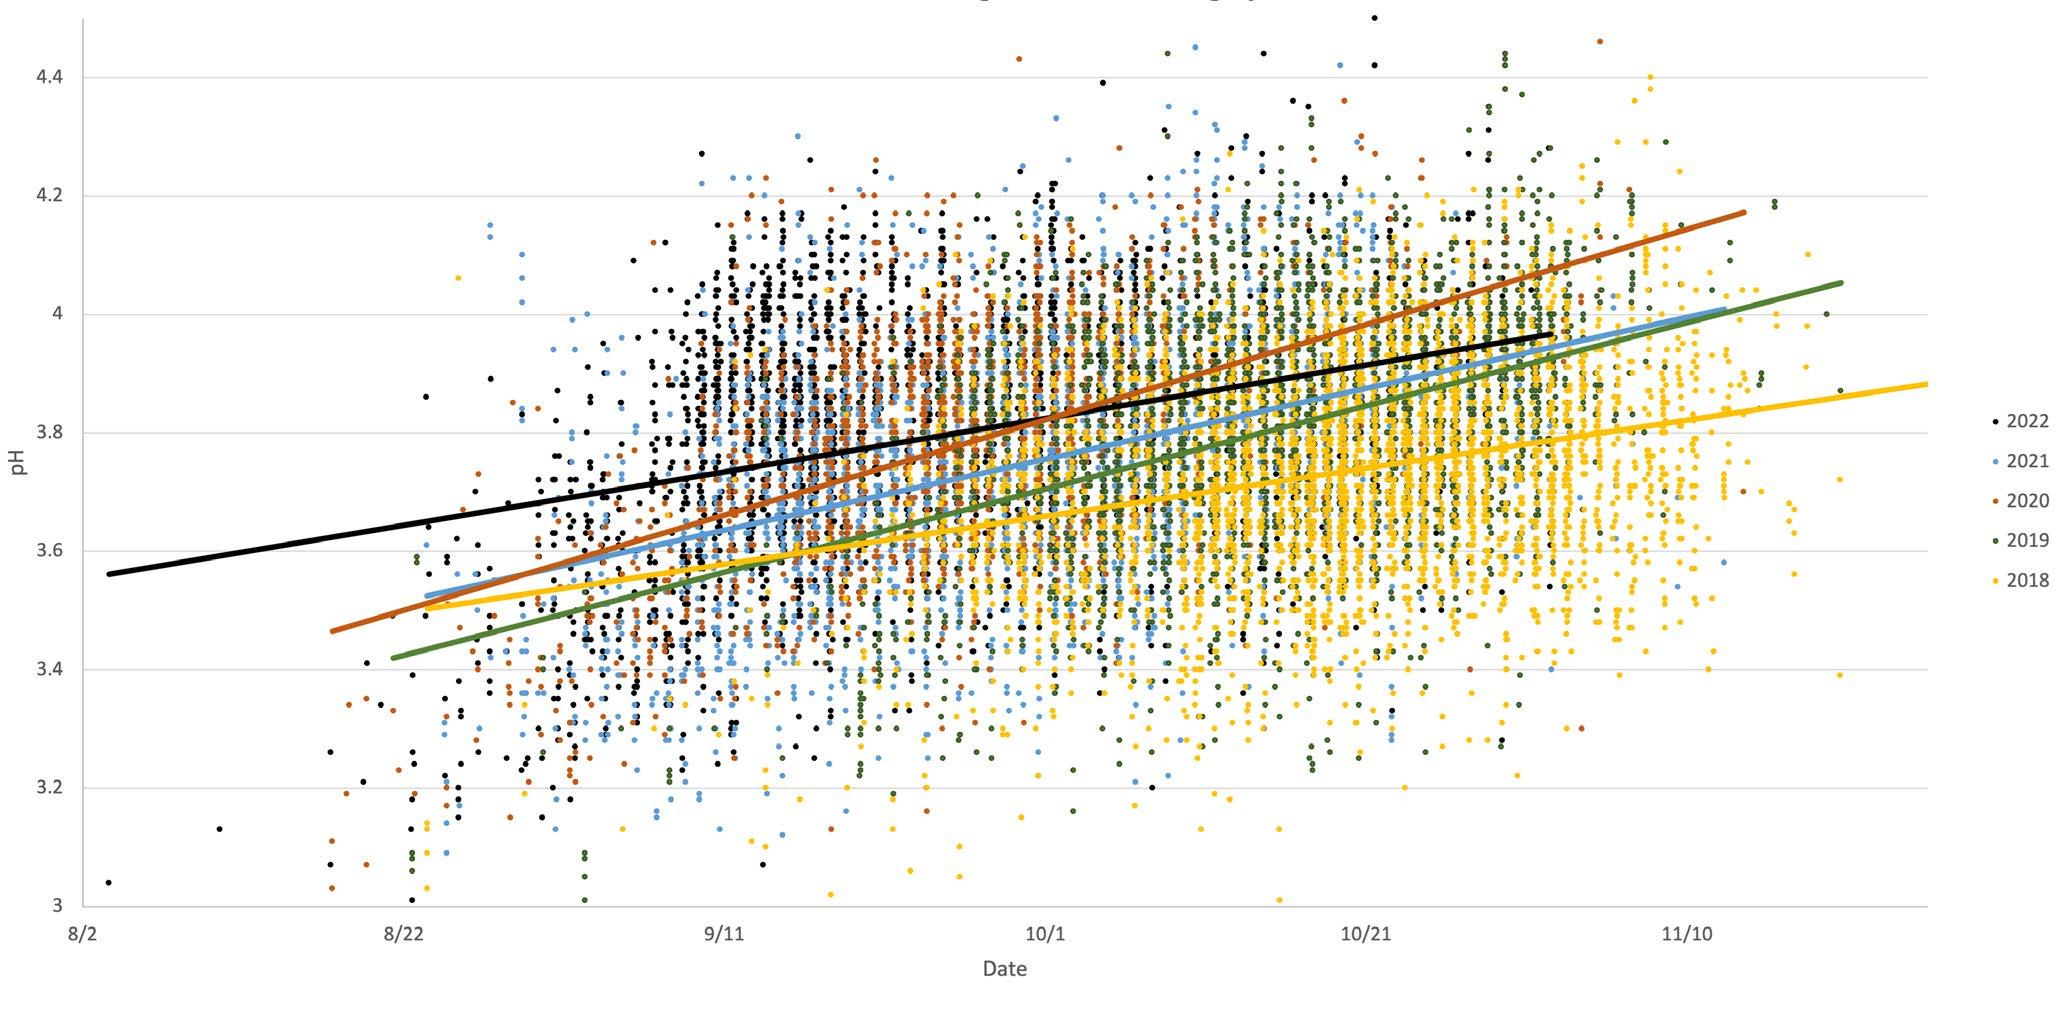
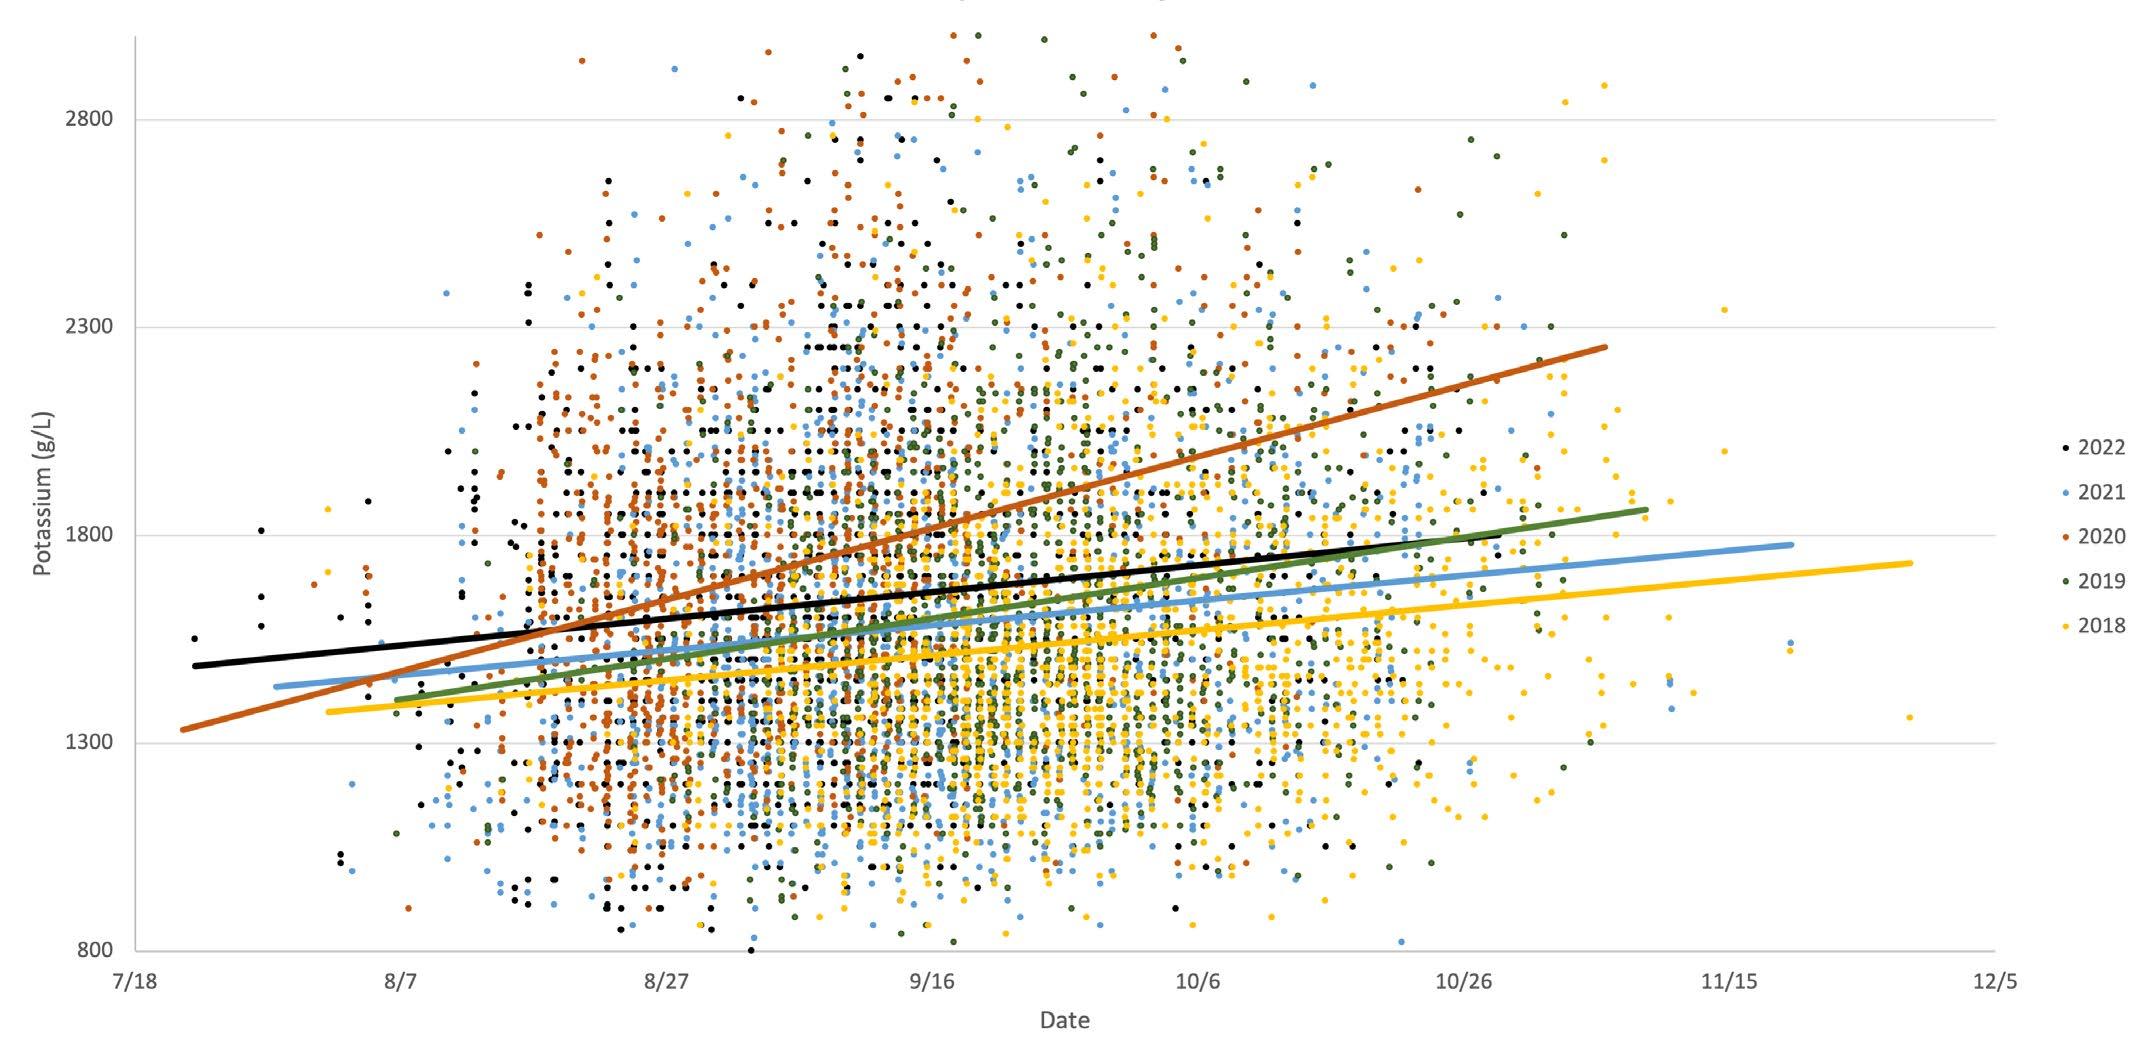
USING JUICE ANALYSIS TO PREDICT WINE COMPOSITIONCALIFORNIA GLOBAL DATA (AVERAGE OF ALL VARIETAL JUICE PANELS)
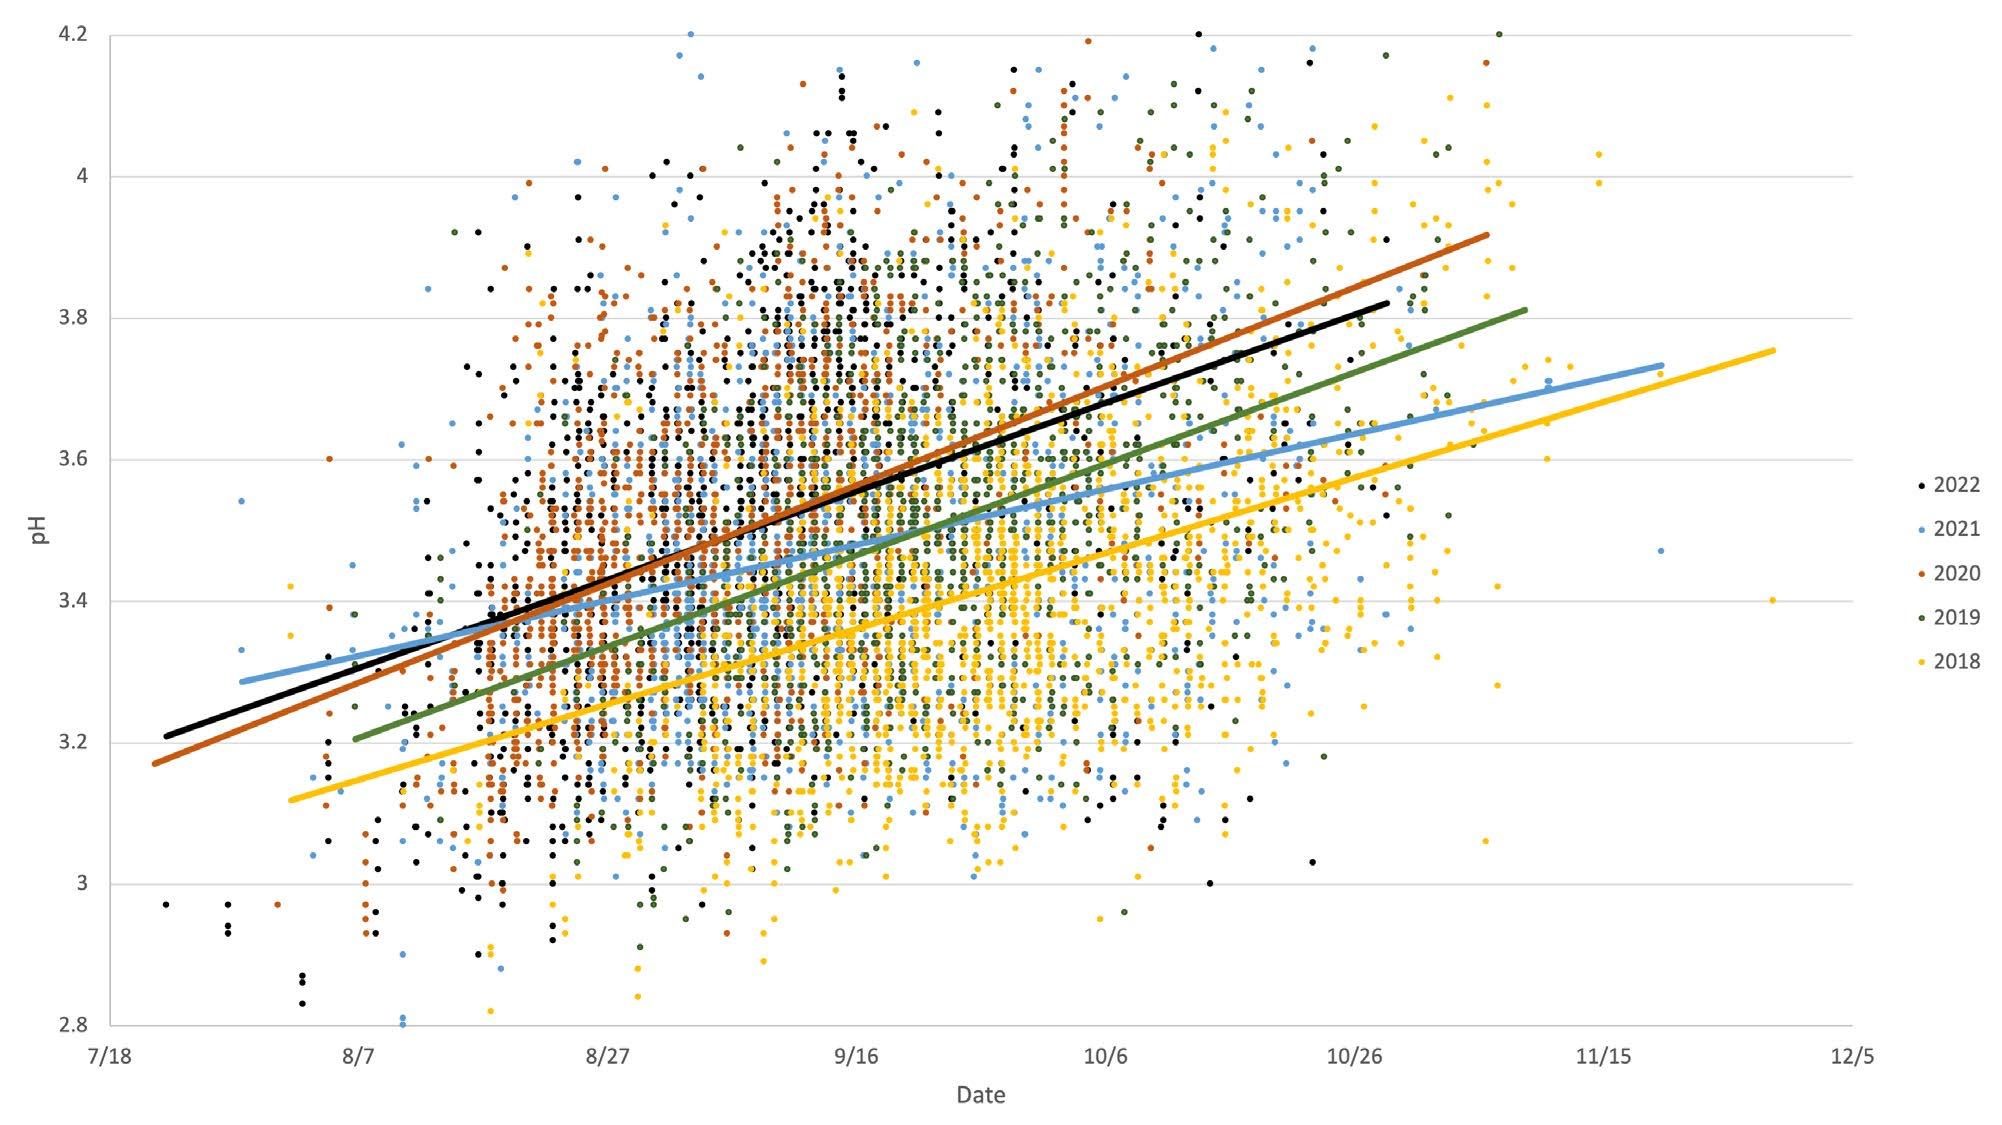
CALIFORNIA RED GLOBAL DATA (AVERAGE OF ALL RED VARIETAL JUICE PANELS)
CALIFORNIA WHITE GLOBAL DATA (AVERAGE OF ALL WHITE VARIETAL JUICE PANELS)
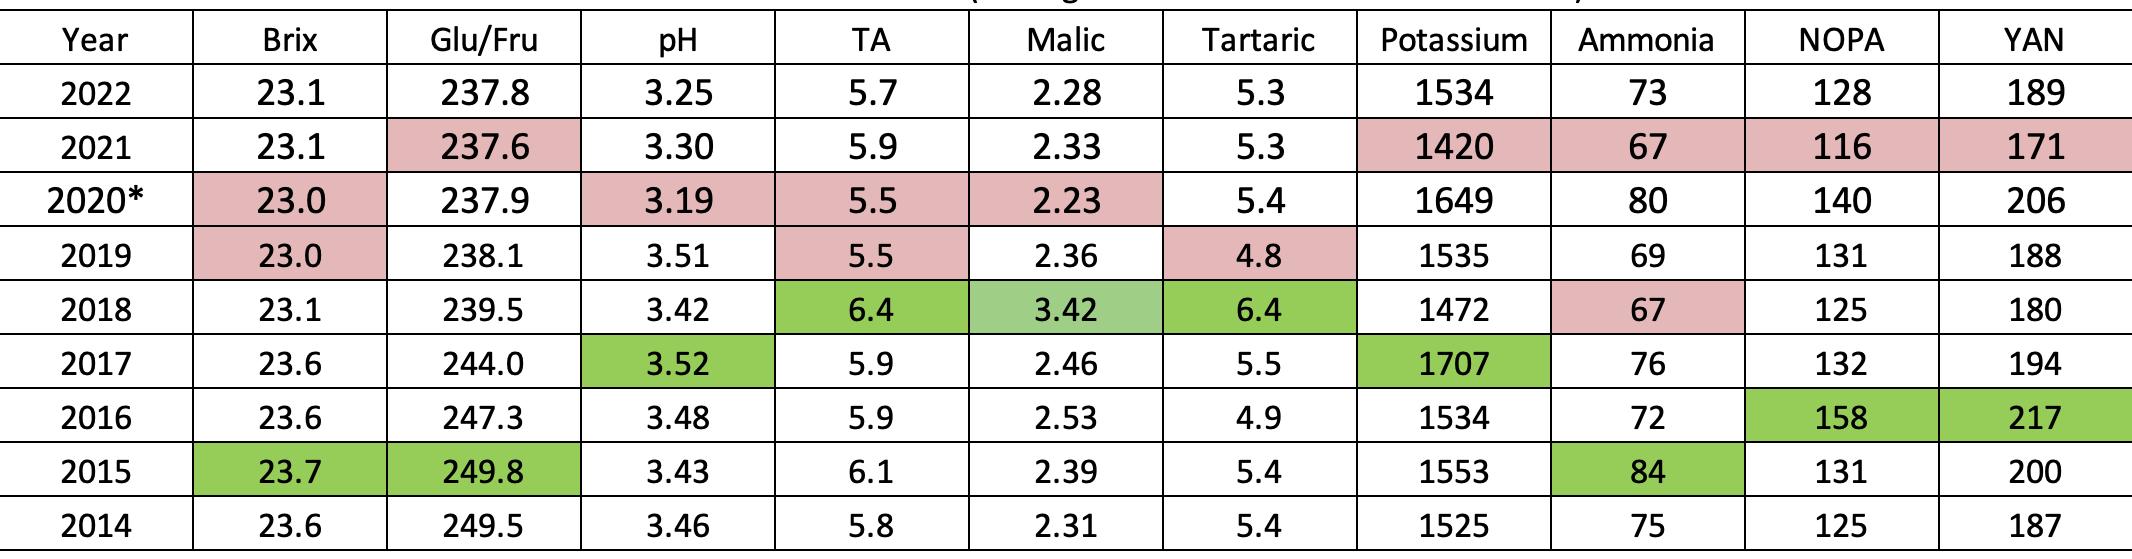
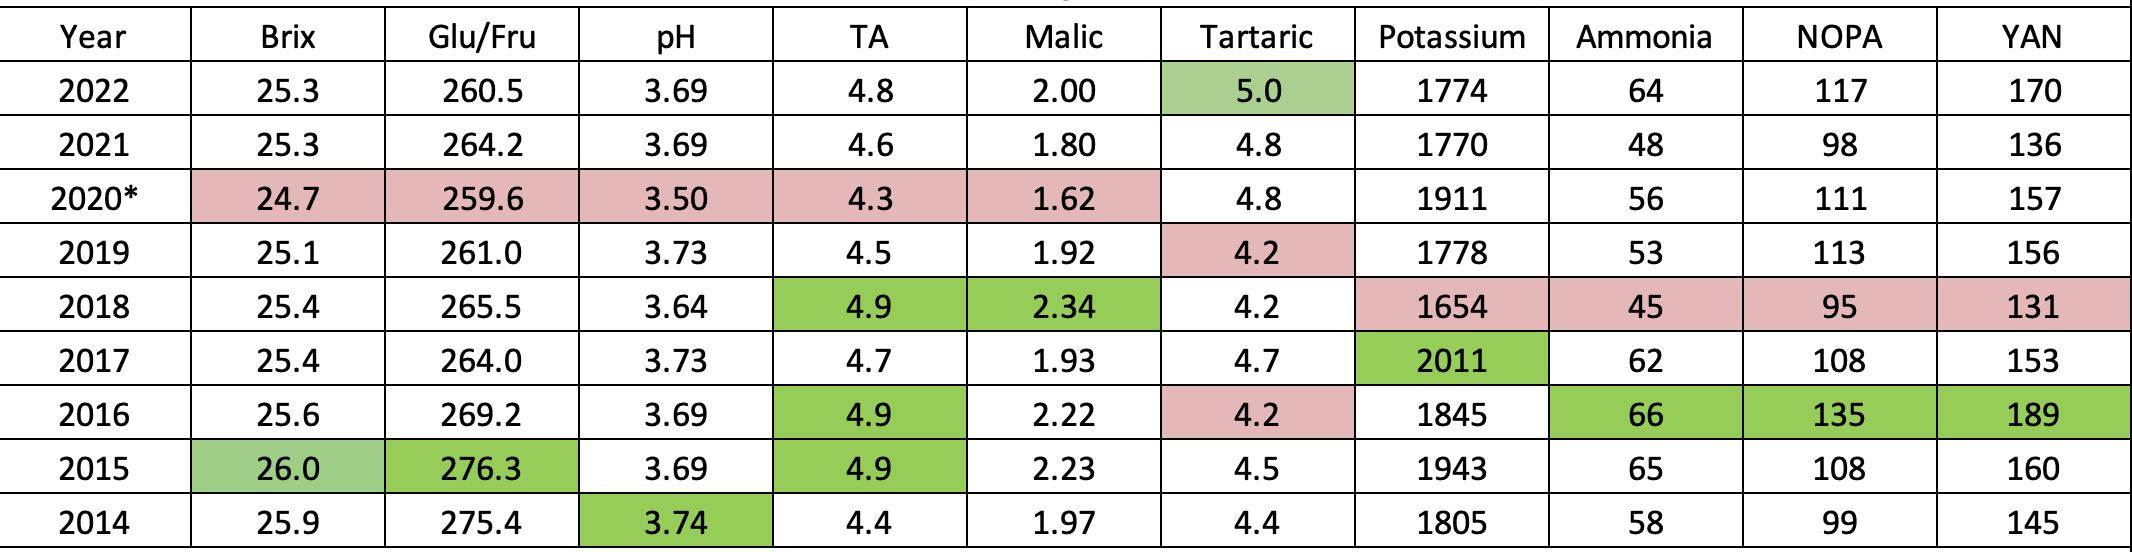
*2020 vintage juice panels do not necessarily reflect “normal” harvesting times
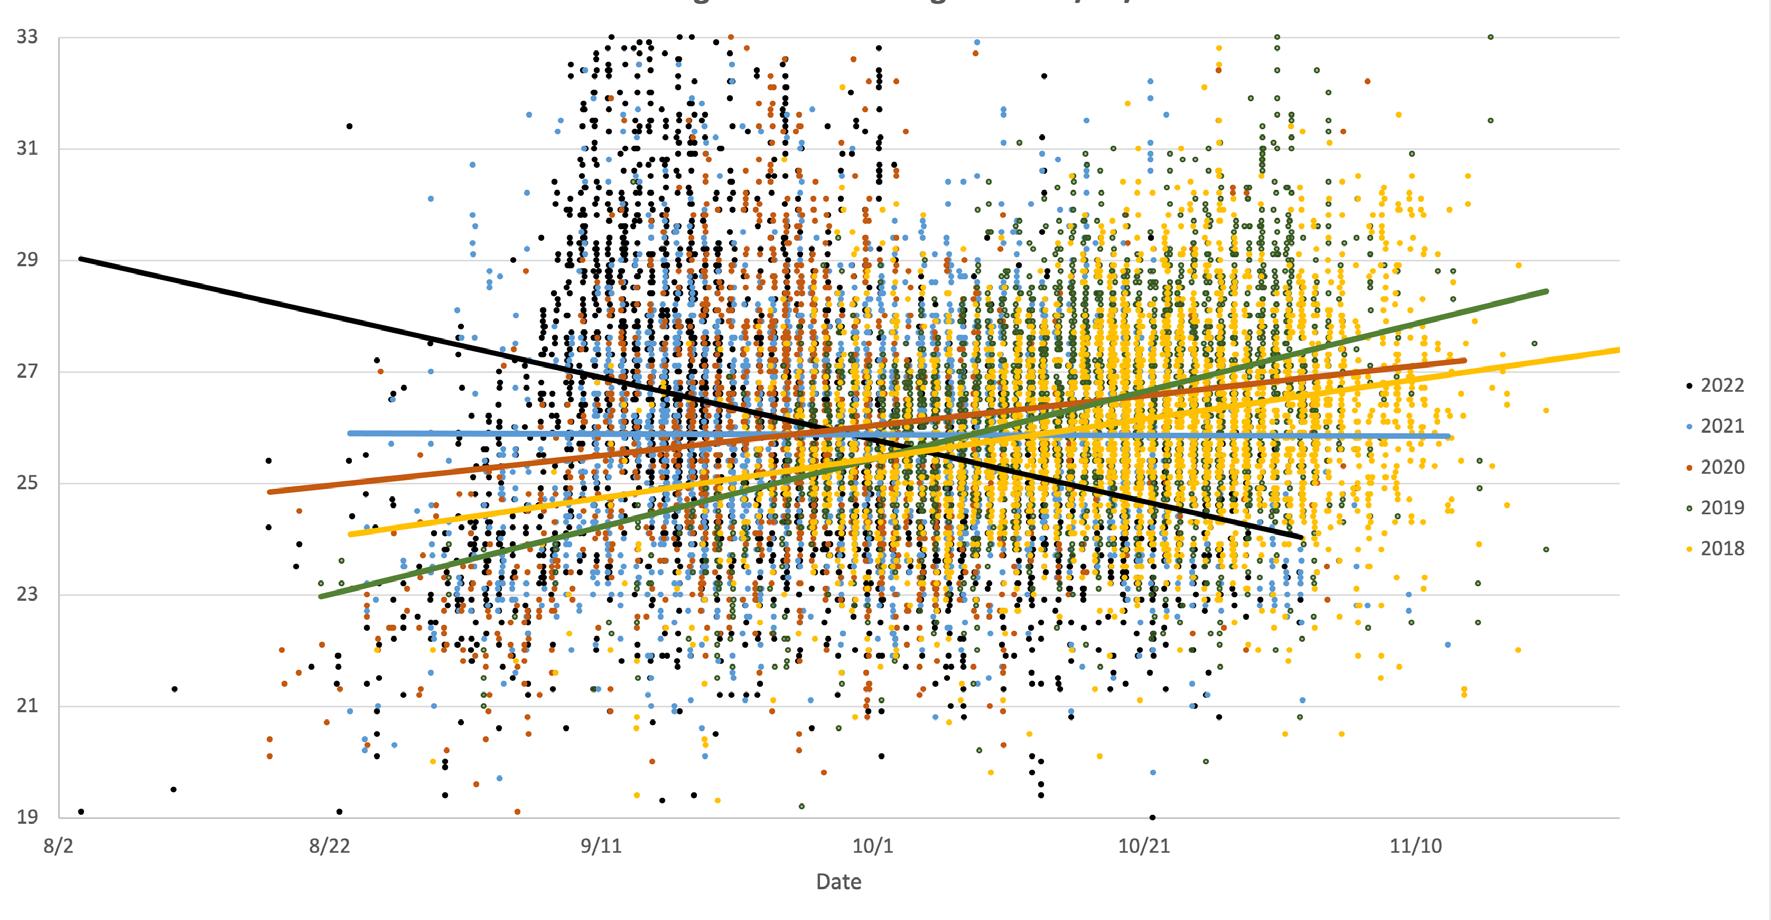
The 2022 vintage was challenging due to the high temperatures observed in many wine producing regions. There were multiple consecutive day events with temperatures exceeding 100 degrees.
The high temperature in many vineyards resulted in severe sunburn on grapes. Elevated volatile acidity levels (0.3-1.6 g/L) were observed on a large number of sunburn impacted grape samples. Interestingly, the malic acid content on these grapes was intact and no microbial cause was determined for the volatile acidity production. There has been research published indicating high temperature and drought stress can result in accumulation of acetic acid in some plants. This hasn’t been demonstrated in grape, but is a likely explanation.
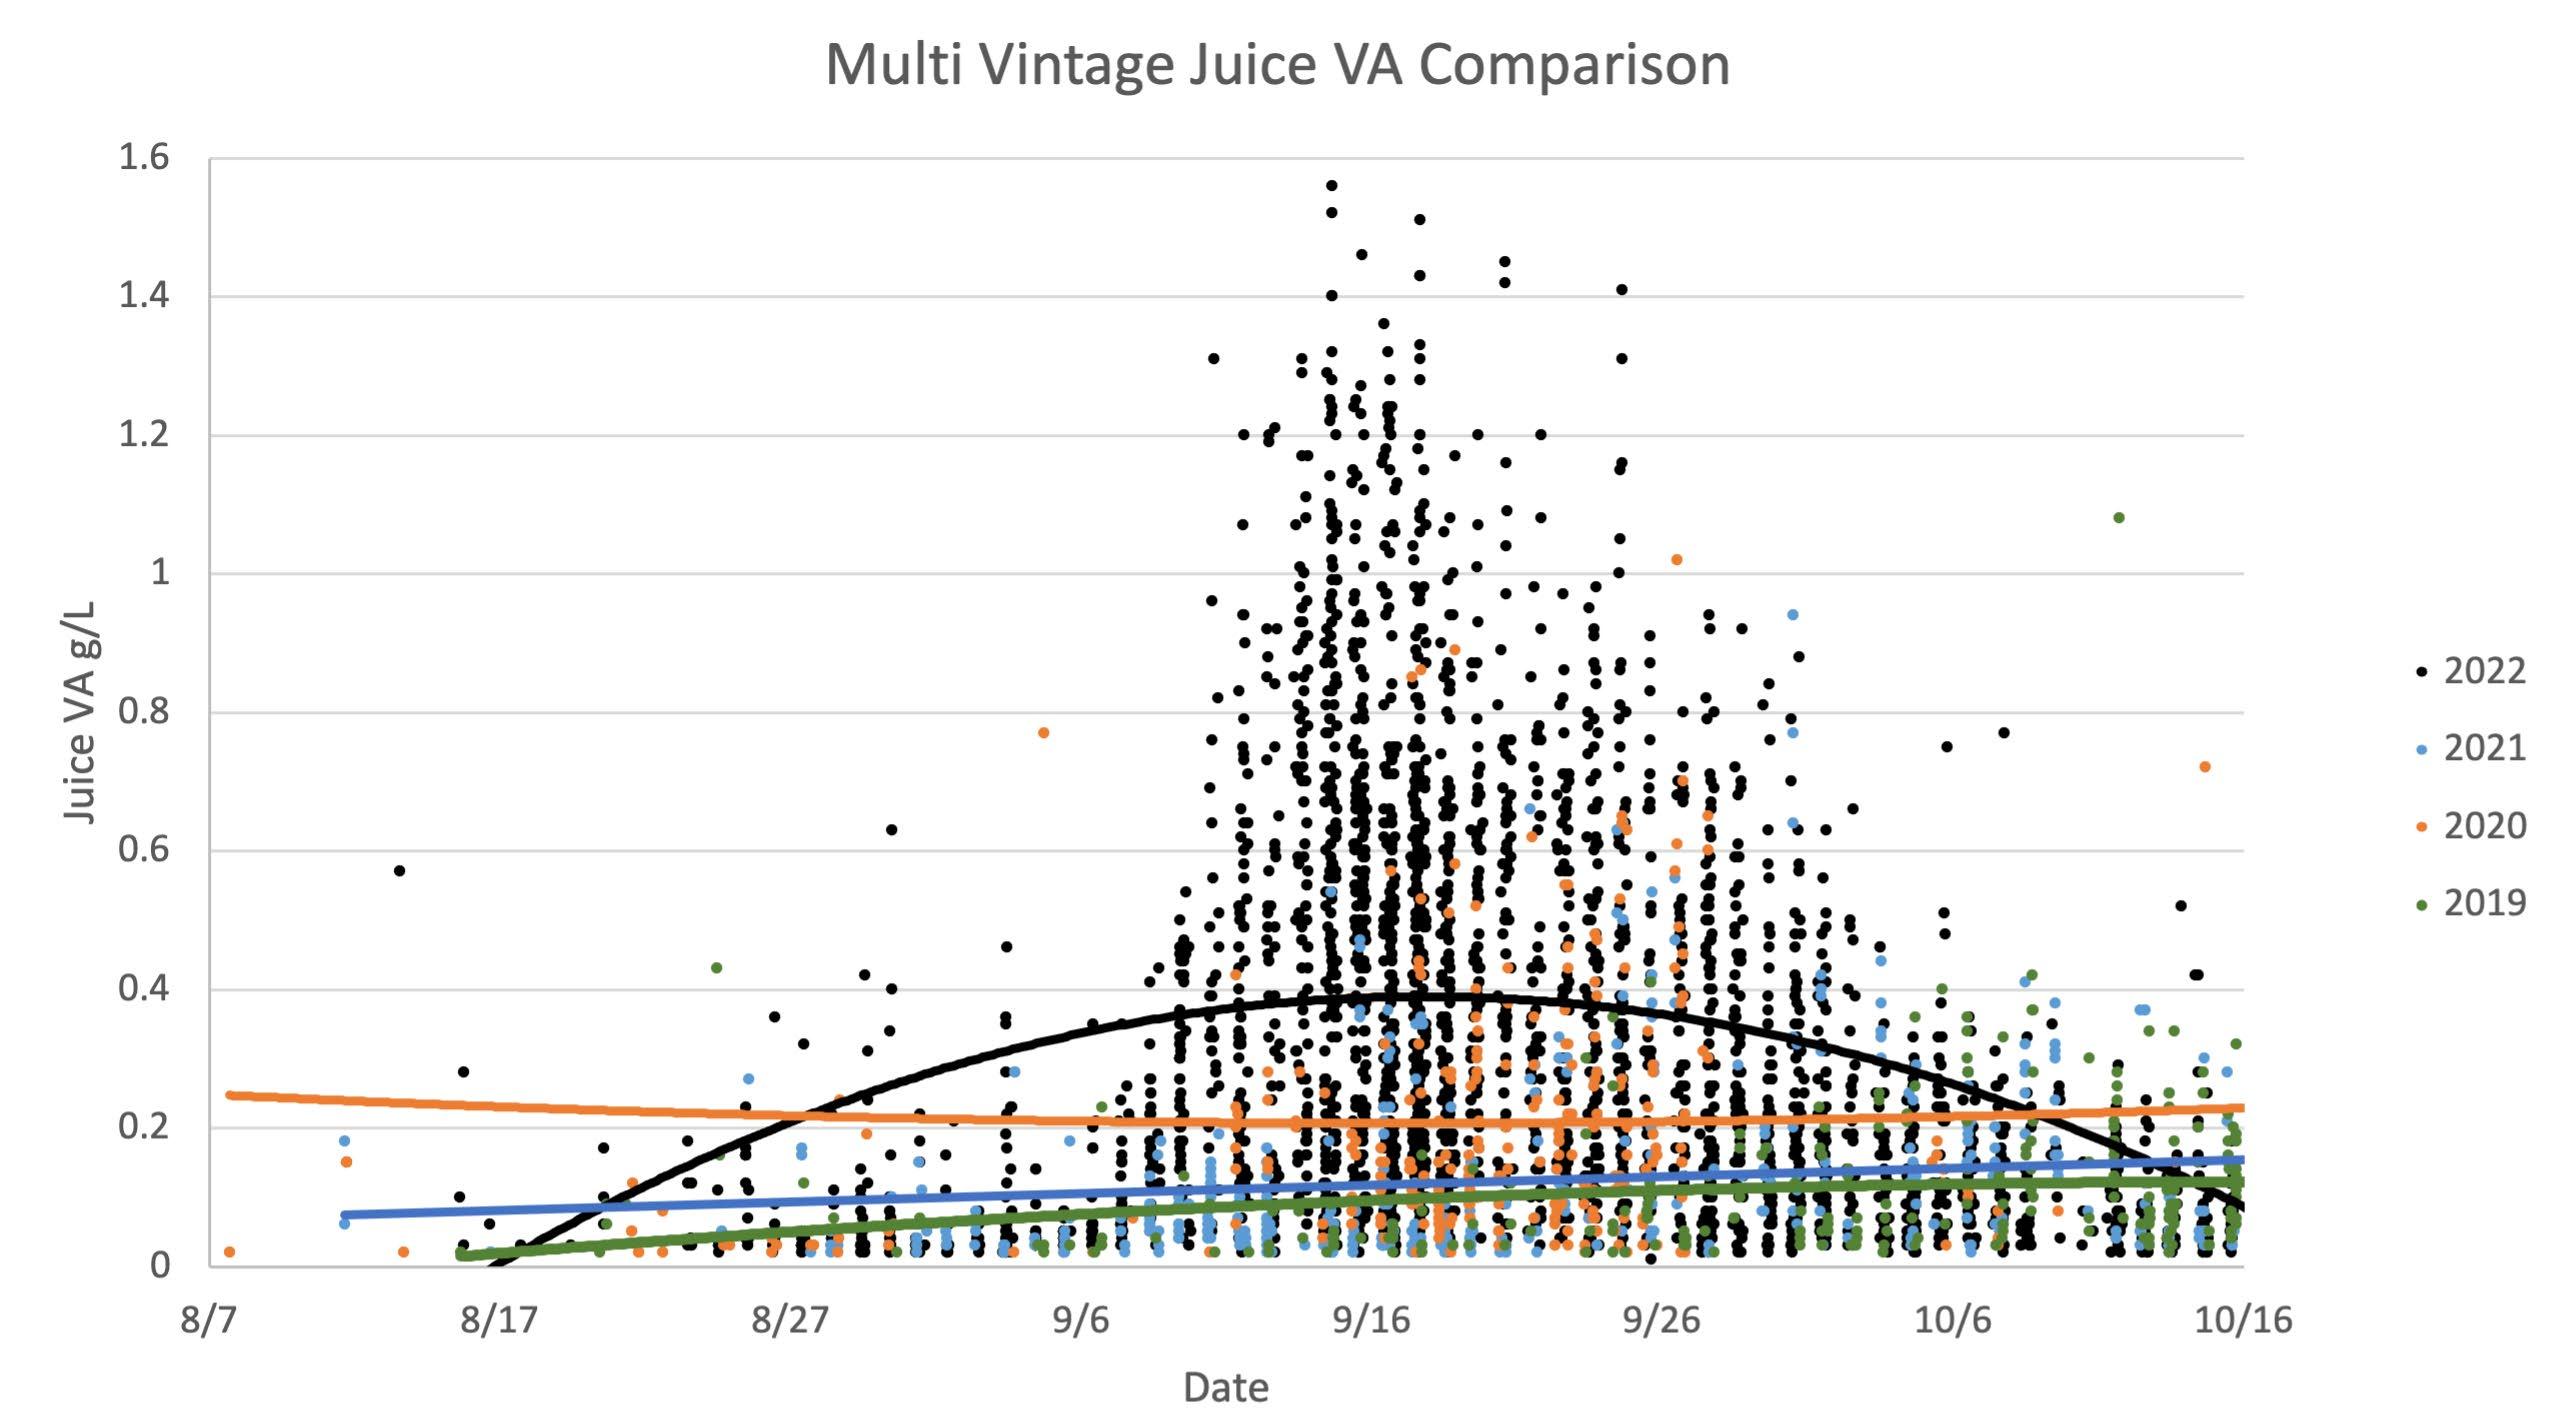
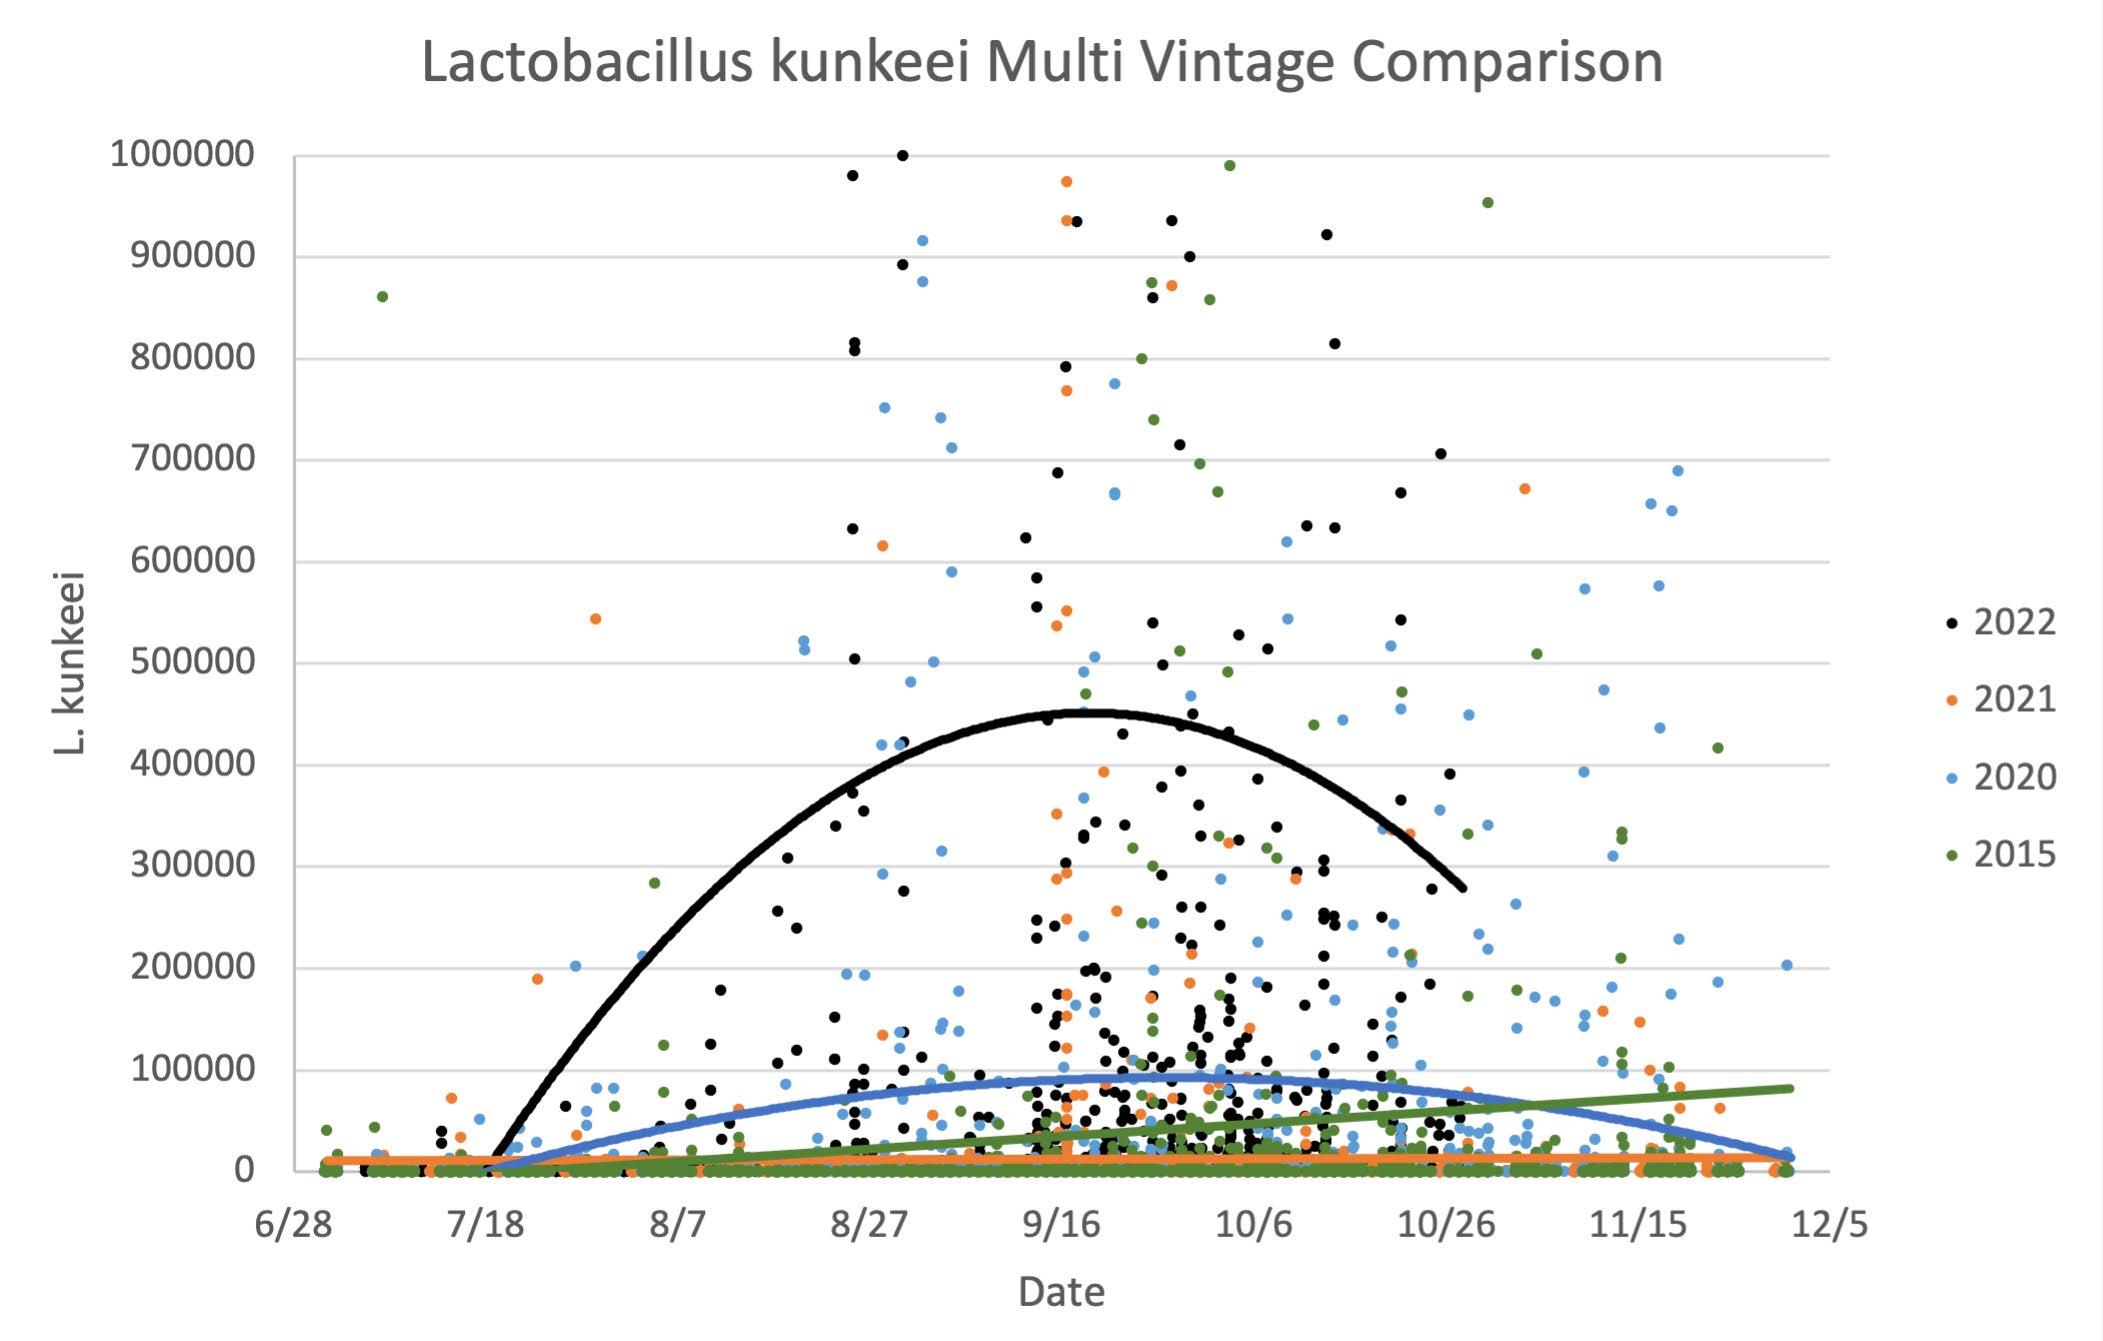
In contrast, a large number of samples were observed with elevated volatile acidity (3.2-7.6 g/L), and there was no malic acid present indicating the samples had completed malolactic fermentation. These samples also had high levels of Lactobacillus kunkeei. More than 50 juice/berry samples were determined to have populations of L. kunkeei exceeding 10 million cells/ mL. Malolactic fermentation completed on these samples prior to the start of primary fermentation.
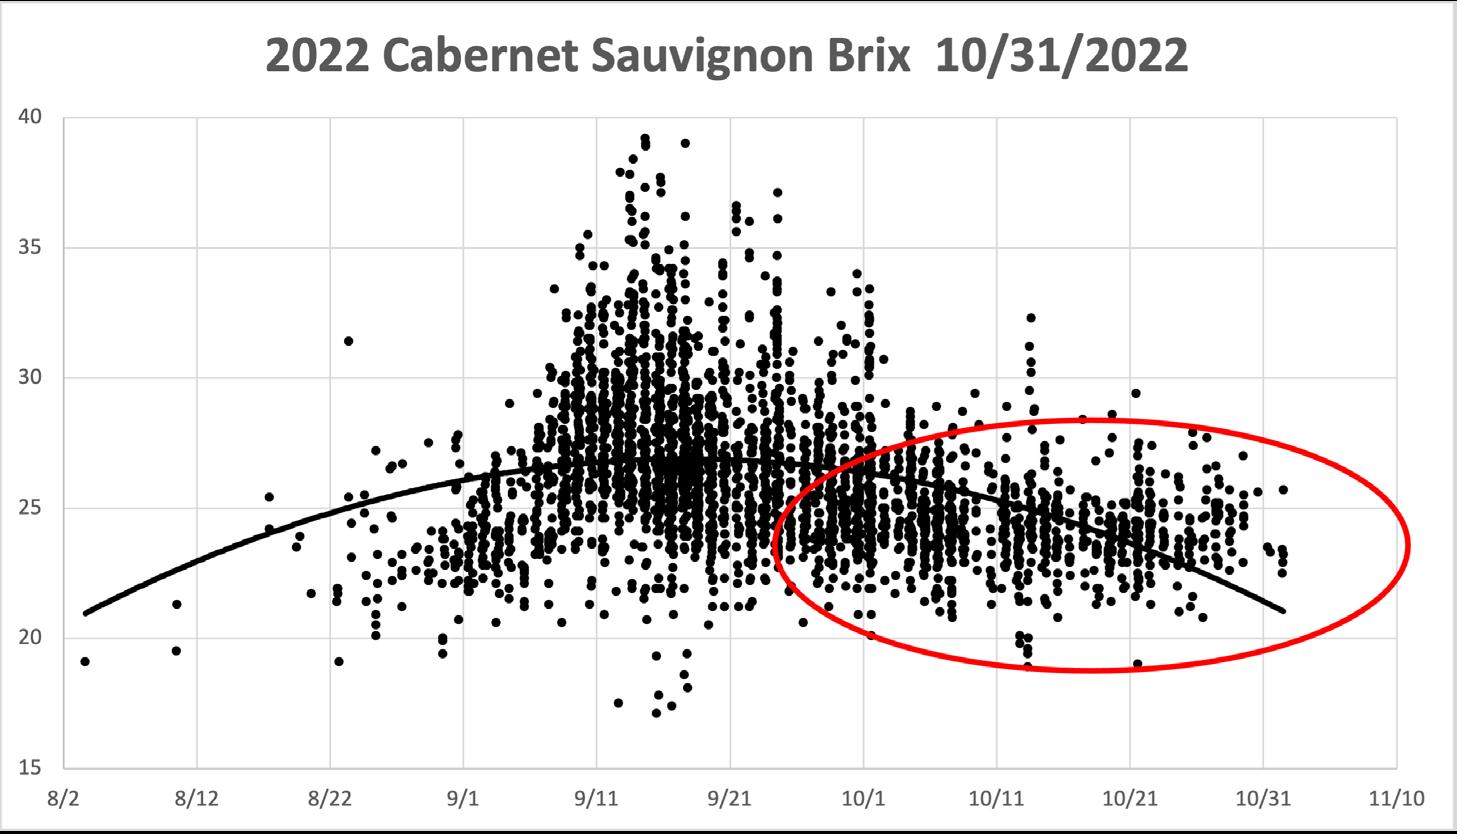
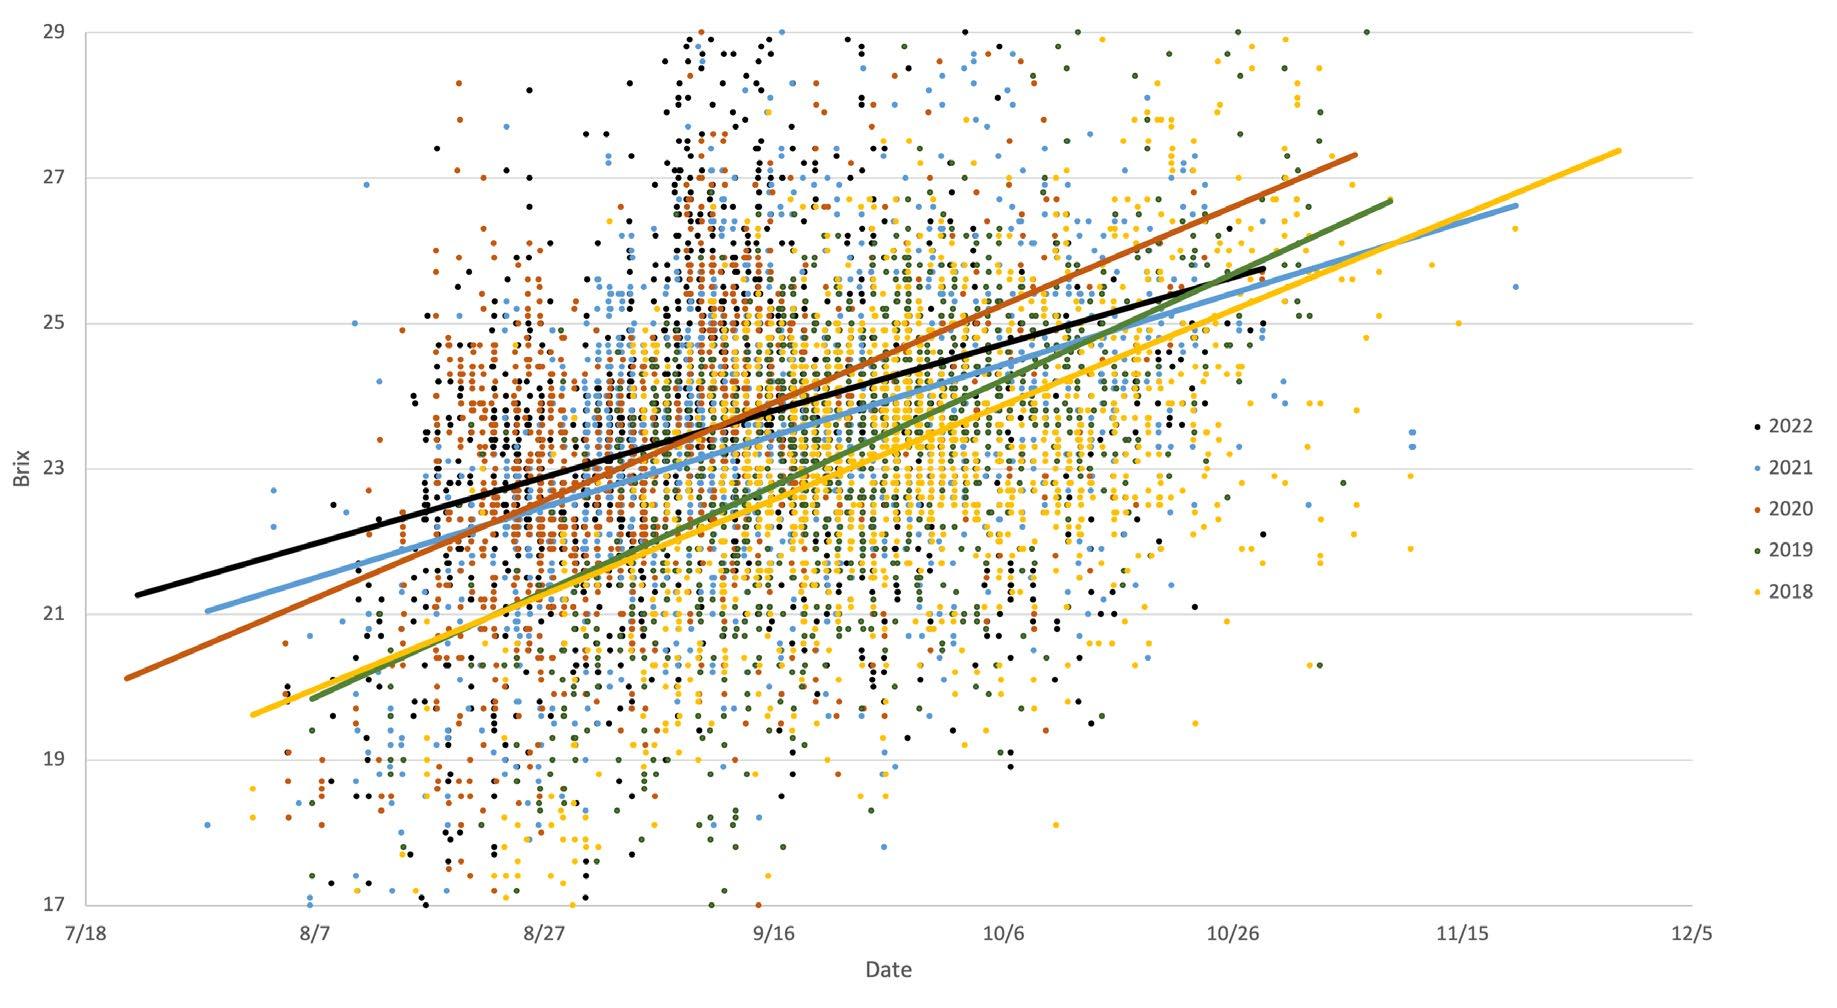
Brix accumulation increased rapidly early in the season due to warm temperatures before the heat spike/sunburn event. The early sugar accumulation yielded some unusual juice panel data, for example red grapes with a pH of 3.2 and Brix at 28-30. A final interesting observation was an unusual cessation of brix accumulation late in the season. Once the grapes reached approximately 2325 Brix, no further increase in Brix due to dehydration was observed, even with extended time on the vine before being harvested. There are research papers indicating a double high temperature event can result in changes in the epicuticular wax matrix structure, resulting in reduced water loss from the grapes.
Juice chemistry is the foundation for the resulting wine. Producing wines with specific targets for ethanol and acid balance, while avoiding fermentation related problems, requires a thorough understanding of the juice chemistry.
The ETS Juice Panel provides detailed information to winemaking teams about the important chemistry factors in juices that will effect winemaking:
The sum of glucose + fructose measures the two main sugars present in juice that can be fermented by yeast. This analysis provides a sound basis for estimates of potential ethanol in the wine. This additional analysis is an important supplement to °Brix testing when final ethanol predictions are critical.
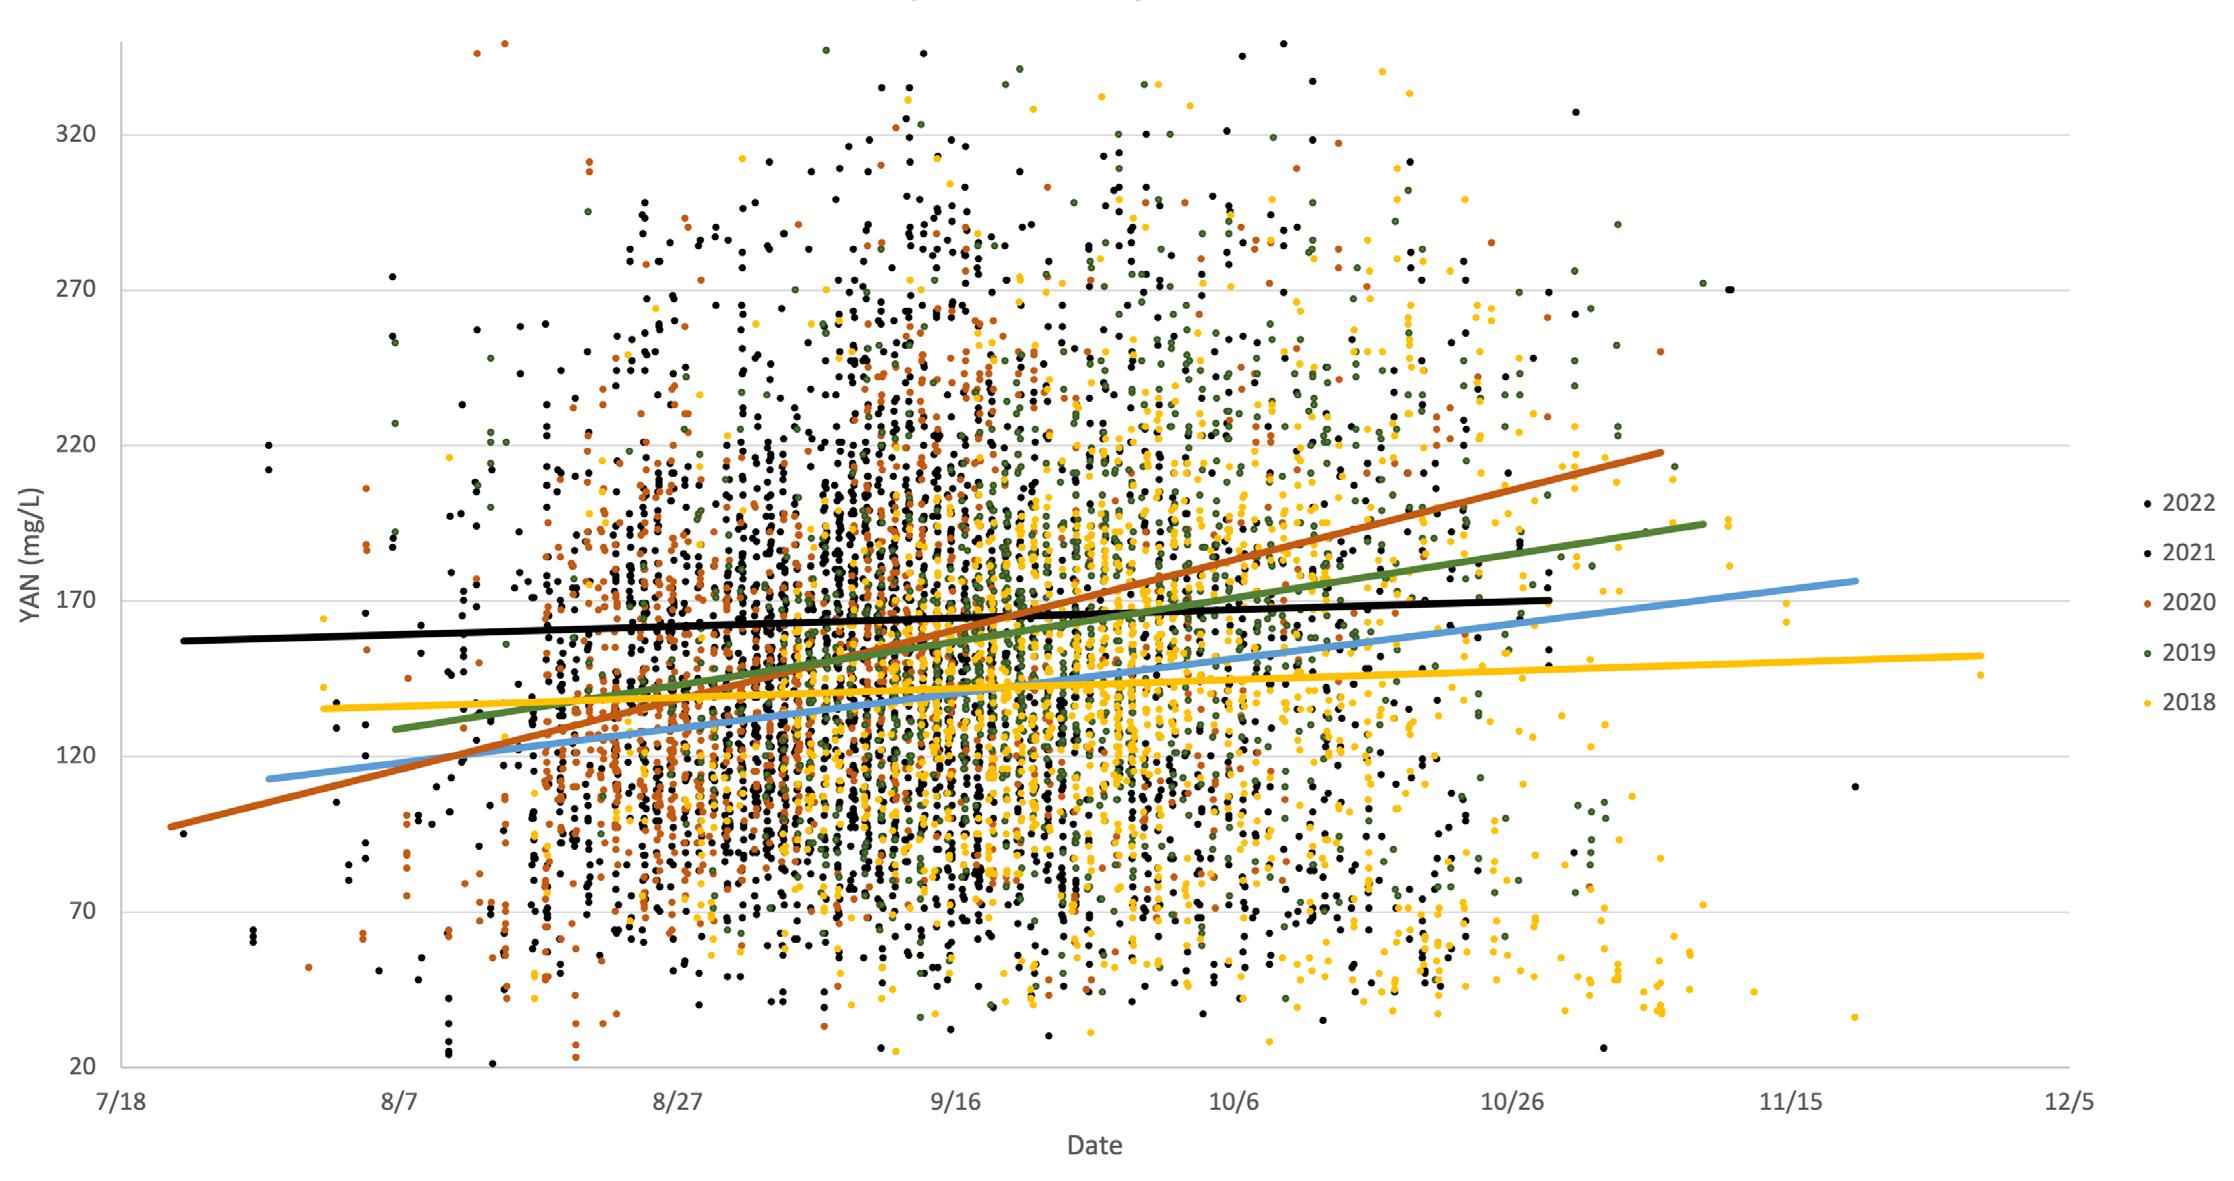
Yeast assimilable nitrogen includes both alpha amino nitrogen (NOPA) and ammonia. Sluggish and stuck fermentations, coupled with sulfide formation, have become increasingly common and are often associated with deficiencies of yeast assimilable nitrogen in the must. Knowledge of nitrogen status is critical for effective fermentation management.
The acid composition of must is a complex balance of free hydrogen ions, acids, acid salts, and cations. Concentrations of these various components and their interactions influence many winemaking parameters. Acids are key to flavor, balance, as well as chemical and microbial stability in the final product.
The 2022 harvest provided a unique set of growing circumstances with a heat wave during the end of August and beginning of September. This heat wave was most likely partly responsible for volatile acidity issues not normally encountered. Volatile acidity issues were widely observed beginning with fruit in the vineyard, fruit coming into wineries, during cold soaks, and throughout the fermentation process.
Based on discussions with our partners across the winemaking industry, ETS will now include volatile acidity in our juice panel moving forward. The Juice Panel has been, since its creation, the preeminent analytical toolkit for juice chemistry.
We are happy to be able to add volatile acidity to the Juice Panel without any significant price increase. The Juice Panel price represents an approximate 50% discount compared to running these tests individually and provides a complete picture regarding the chemistry of grapes and juices for winemaking.
Because the must components are in a state of flux from cold soak to post malolactic fermentation, many winemakers prefer to make incremental adjustments rather than rely on one initial or massive adjustment. Winemakers who are targeting a certain TA and pH or ethanol level, for instance, often check their wine chemistry again at the fermentation midpoint. These midpoint numbers are used to make ongoing and final fermentation adjustments.
It’s important to note that in ripe fruit, glucose + fructose numbers often appear higher than the corresponding °Brix results. This is because °Brix is measured as a percentage by weight, meaning brix values are greatly influenced by the density of juice. Glucose + Fructose is measured as weight by volume and is independent of juice density. A must with 23.3 °Brix will not have 23.3% by volume fermentable sugar.
Sugar concentration increases rapidly in grapes as they mature. This increase is usually due to sugar movement from the leaves to the fruit. During the final stages of berry development, berry dehydration may also contribute significantly to the final sugar concentration. Rates of sugar accumulation do vary from vintage to vintage.
°Brix is a measure of soluble solids in juice and must. The soluble solids in grape juice are primarily sugars. Organic acids, however, have a significant impact on brix, especially with unripe grapes. °Brix is used as an estimate of sugar concentration and often as a predictor of potential alcohol, but is not a true measure of fermentable sugar. Two juices with identical °Brix may have very different final alcohol concentrations due to varying amounts of fermentable sugars. Observations over the last five vintages indicate that the amount of glucose + fructose per degree brix varies slightly from vintage to vintage. This can have a significant
impact on potential ethanol predictions based solely on Brix. That said, many people use Brix to monitor maturity or sugar accumulation
The sum of glucose + fructose measures the two main sugars present in juice that can be fermented by yeast. This analysis provides a sound basis for estimates of potential ethanol in the wine. This additional analysis is an important supplement to °Brix testing when final ethanol predictions are critical.
°Brix is not a true measure of fermentable sugar. Two juices with identical °Brix may have very different final alcohol concentrations due to varying amounts of fermentable sugars.
Sluggish and stuck fermentations, coupled with sulfide formation, have become increasingly common and are often associated with deficiencies of yeast assimilable nitrogen in the must. However, excessive concentrations of certain nitrogen compounds have been associated with microbial spoilage and other fermentation problems.
Knowledge of nitrogen status is critical for effective fermentation management. Nitrogen compounds are essential macronutrients for yeast, and are required for cell growth, multiplication, and yeast activity.
As with other juice chemistry components, YAN values can fluctuate vintage to vintage due to changes in ammonia and/ or NOPA. Monitoring during harvest enables comparison with past vintages.
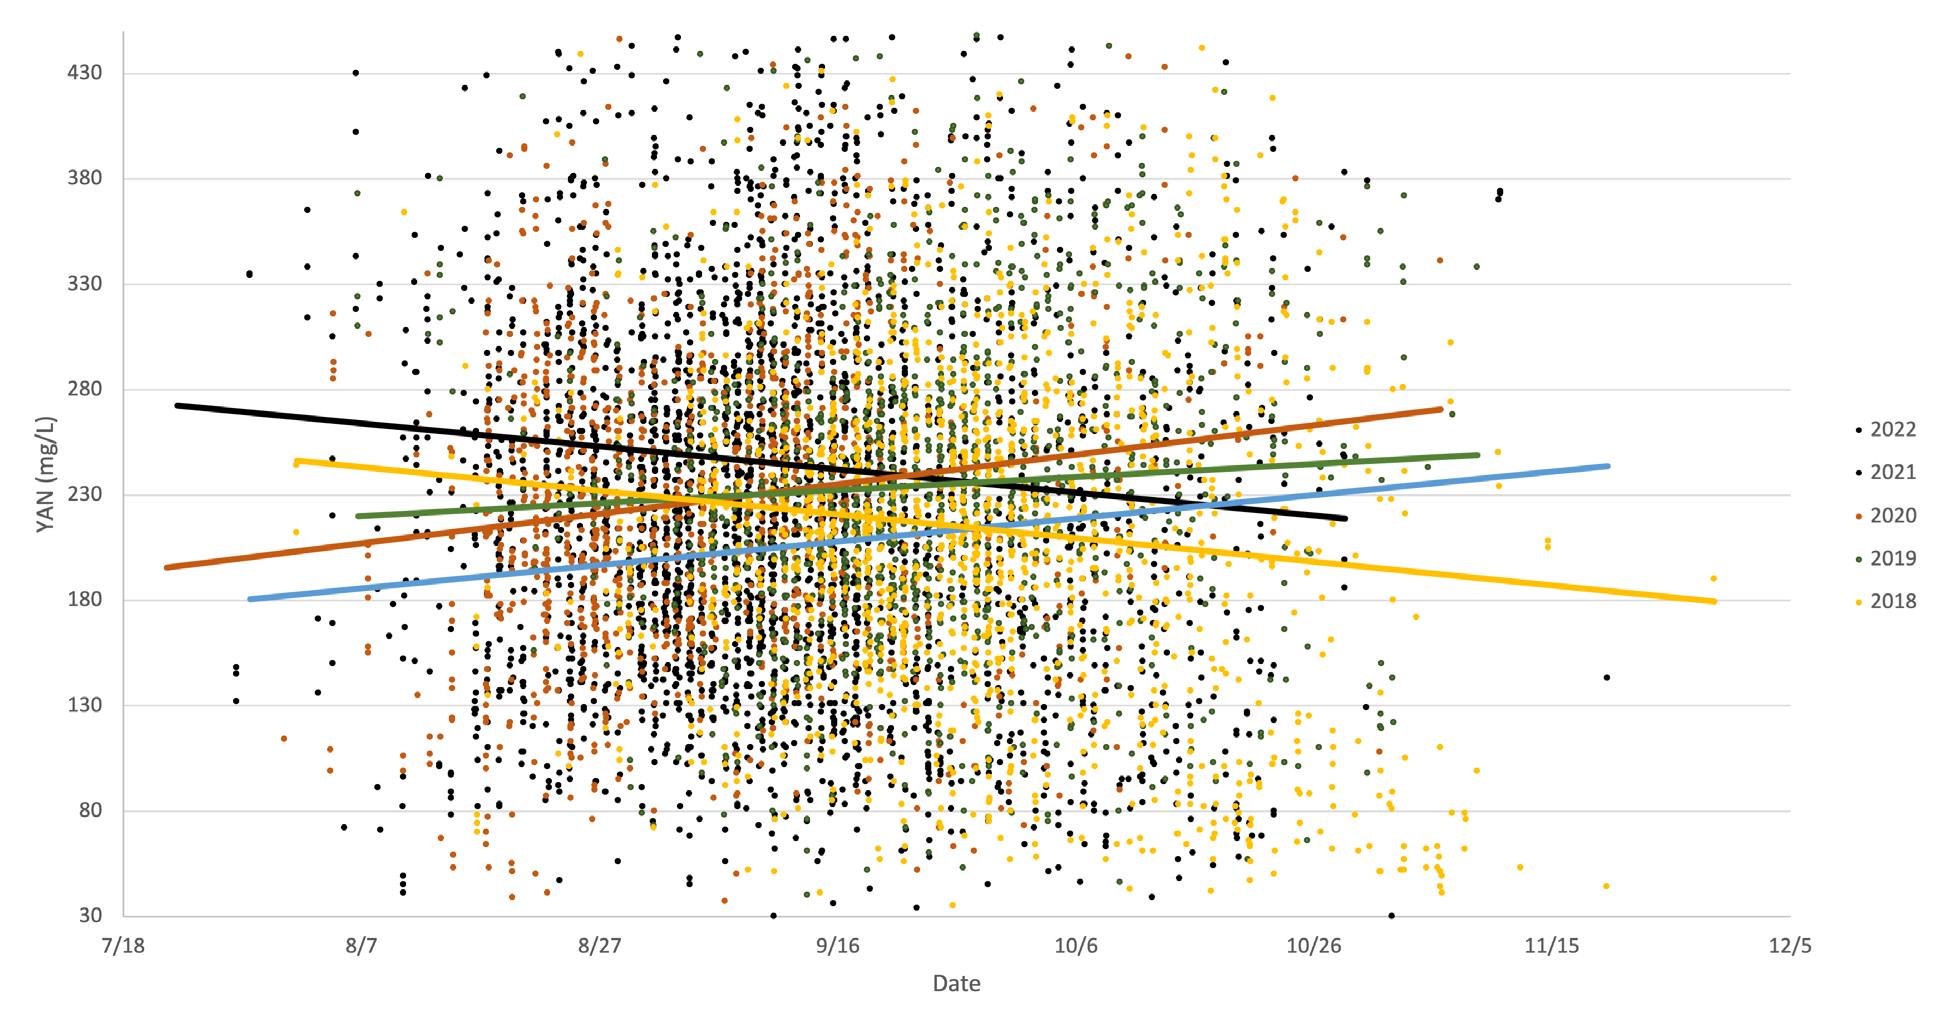
Ammonia and NOPA can change independently of each other resulting in different ratios of these two YAN components.
Yeast assimilable nitrogen includes both alpha amino nitrogen (NOPA) and ammonia. Analysis of only alpha amino nitrogen or only ammonia nitrogen does not provide an accurate indication of total nitrogen status for a given must.
Ammonia is the form of nitrogen nutrition most easily assimilated by yeast. Wineries routinely supplement nitrogen deficient musts with diammonium phosphate at the start of or during fermentation to provide adequate nitrogen levels. Additional ammonia analysis and adjustments during fermentation may also be beneficial in minimizing the risk of stuck fermentations and sulfide formation. Ammonia
results are expressed as mg NH3 per liter. These values may be expressed as nitrogen equivalents by multiplying NH3 results by 0.82. Monitoring ammonia trends is important to understand changes in the levels of this rapidly available nitrogen compound.
Alpha amino nitrogen, otherwise referred to as “Nitrogen by OPA”, or NOPA, is determined using a method specific for alpha amino groups. It is a measurement of primary amino acids usable by yeast. NOPA does not include proline, which is
not utilized by yeast, or ammonia. NOPA results are expressed as mg nitrogen per liter. NOPA generally trends upward and is usually the largest component of the YAN.
The acid composition of must is a complex balance of free hydrogen ions, acids, acid salts, and cations. Concentrations of these various components and their interactions influence many winemaking parameters.
The principal objective of acid management is to achieve and maintain a pH favorable to optimum wine balance and stability.
Vintage variations in any of the components that impact acid balance can result in unexpected changes in the final pH and TA of a wine. Monitoring the parameters that contribute to pH and TA is an important preview to how the vintage will affect overall acid balance in the wine.
Tartaric acid is one of the two major organic acids found in grapes. It accumulates in grape tissue early during development and declines during ripening due to berry growth and dilution. Tartaric acid is not usually metabolized in grapes. It is present in grapes, must, and wine as a free acid and weak acid-salt complex. Tartaric acid-salts may precipitate, primarily as potassium bitartrate and calcium tartrate.
Both the formation and solubility of salts are affected by a balance of components that are in flux throughout the early life of a wine. An increase in the ratio of the free tartaric acid to the tartaric acid salts will cause a decrease in pH. This will affect the flavor, balance, and stability of the final product.
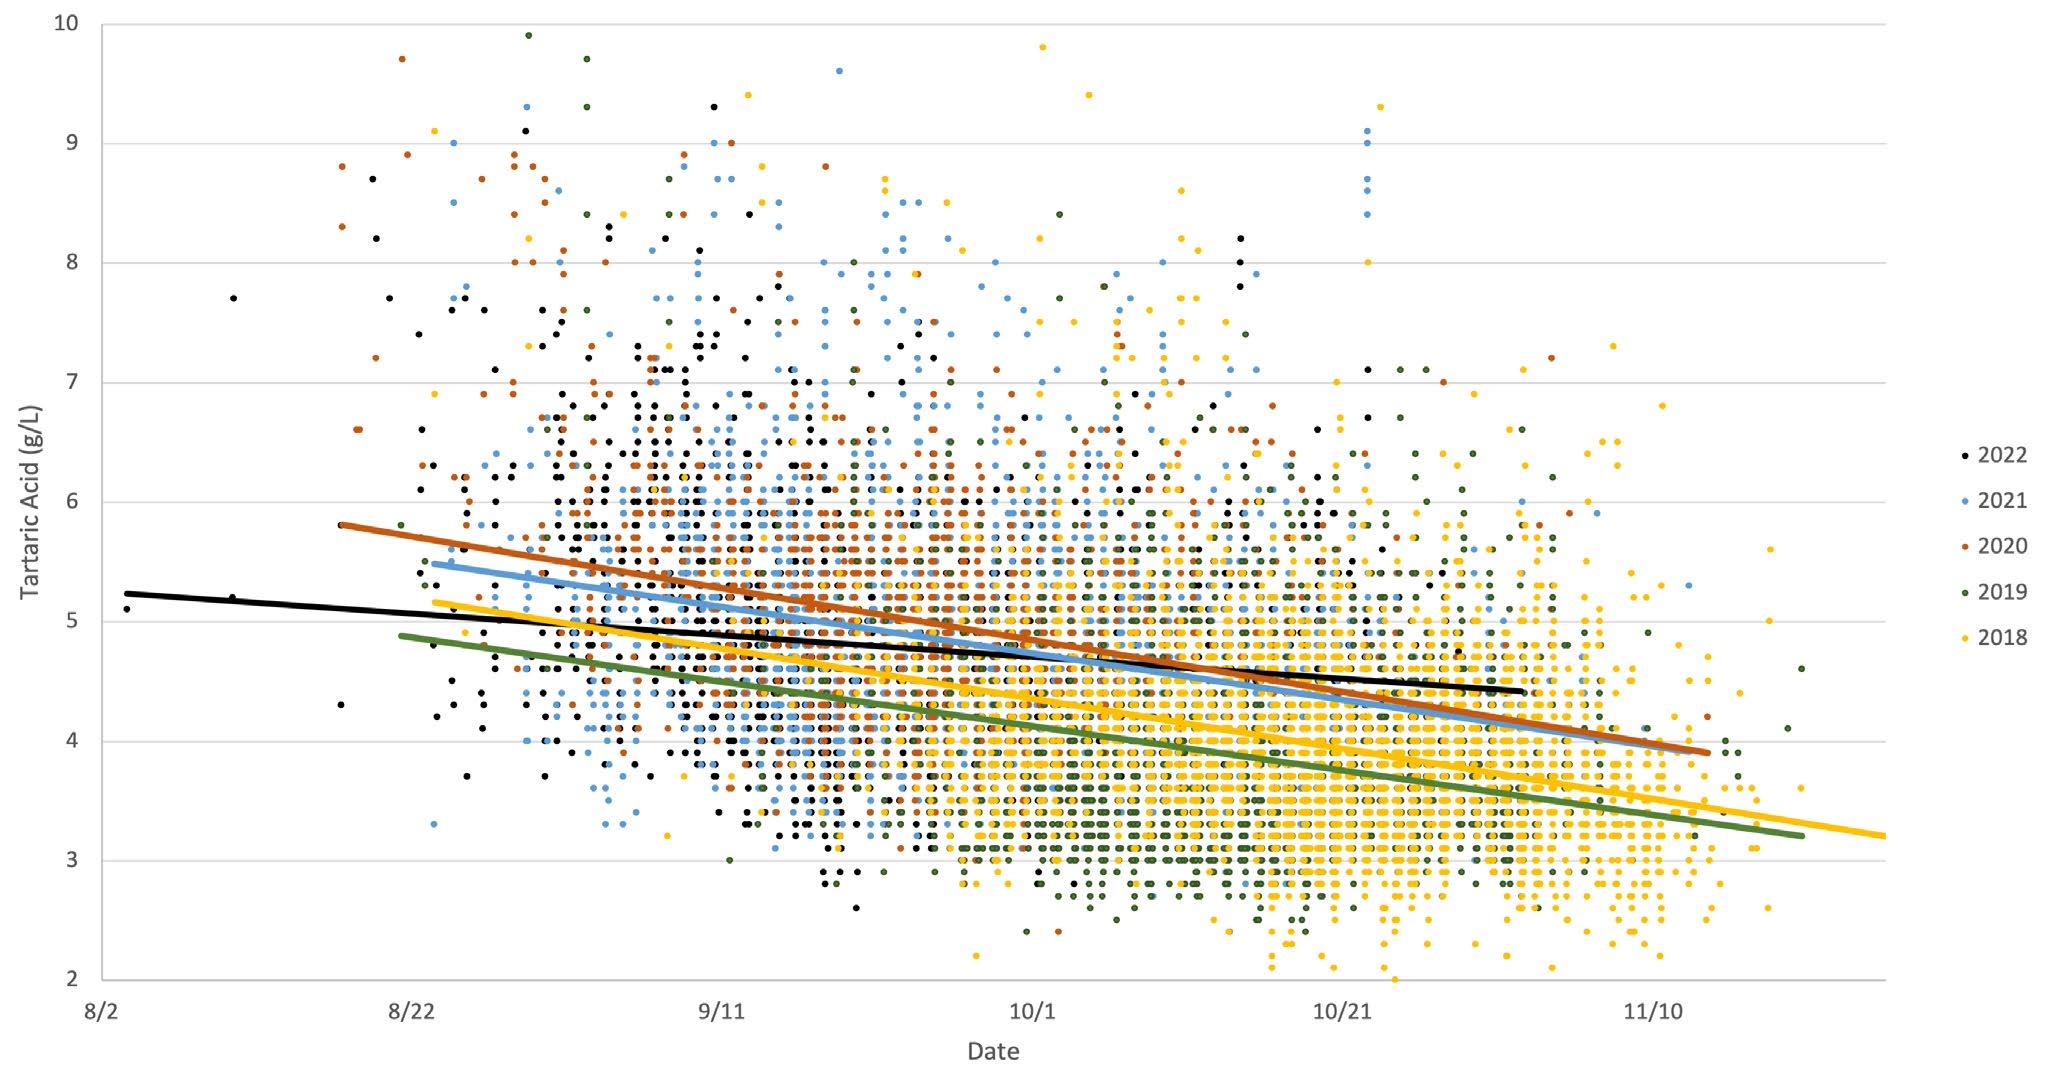
Tartaric acid is commonly used to adjust the acid balance of juices and wines. Understanding tartrate interactions is important in designing appropriate acidification strategies.
pH is a measure of free hydrogen ions in solution (which corresponds to the chemical definition of acidity) and is used as a gauge of wine acidity.
Wine color, potassium bitartrate stability (cold stability), calcium stability, and molecular SO2 level are directly related
to wine pH. pH is also critical in relationship to microbial stability, interactions of phenolic compounds, and color expression.
Malic acid accumulates early in berry development and declines during ripening due to dilution and respiration. Viticultural practices and grape cluster environments may directly affect respiration rates of malic acid. Malic acid levels affect pH and titratable acidity.
Malic acid is converted to lactic acid during malolactic fermentation, causing the loss of an acid group. The effect of this acid reduction on pH depends upon the initial amount
of malic acid and buffer capacity of the wine. Malolactic fermentation in wines containing low levels of malic acid and high buffer capacity will have little impact on wine pH. Malolactic conversion in wines with high malic acid and low buffer capacity can result in a substantial pH increase. Malic acid tends to be higher in cooler vintages.
Titratable acidity (TA) measures total available hydrogen ions in solution. This measurement includes both the free hydrogen ions and the undissociated hydrogen ions from acids that can be neutralized by sodium hydroxide.
TA is the most widely used measurement of acidity in wine. Although generally considered a simple parameter, titratable
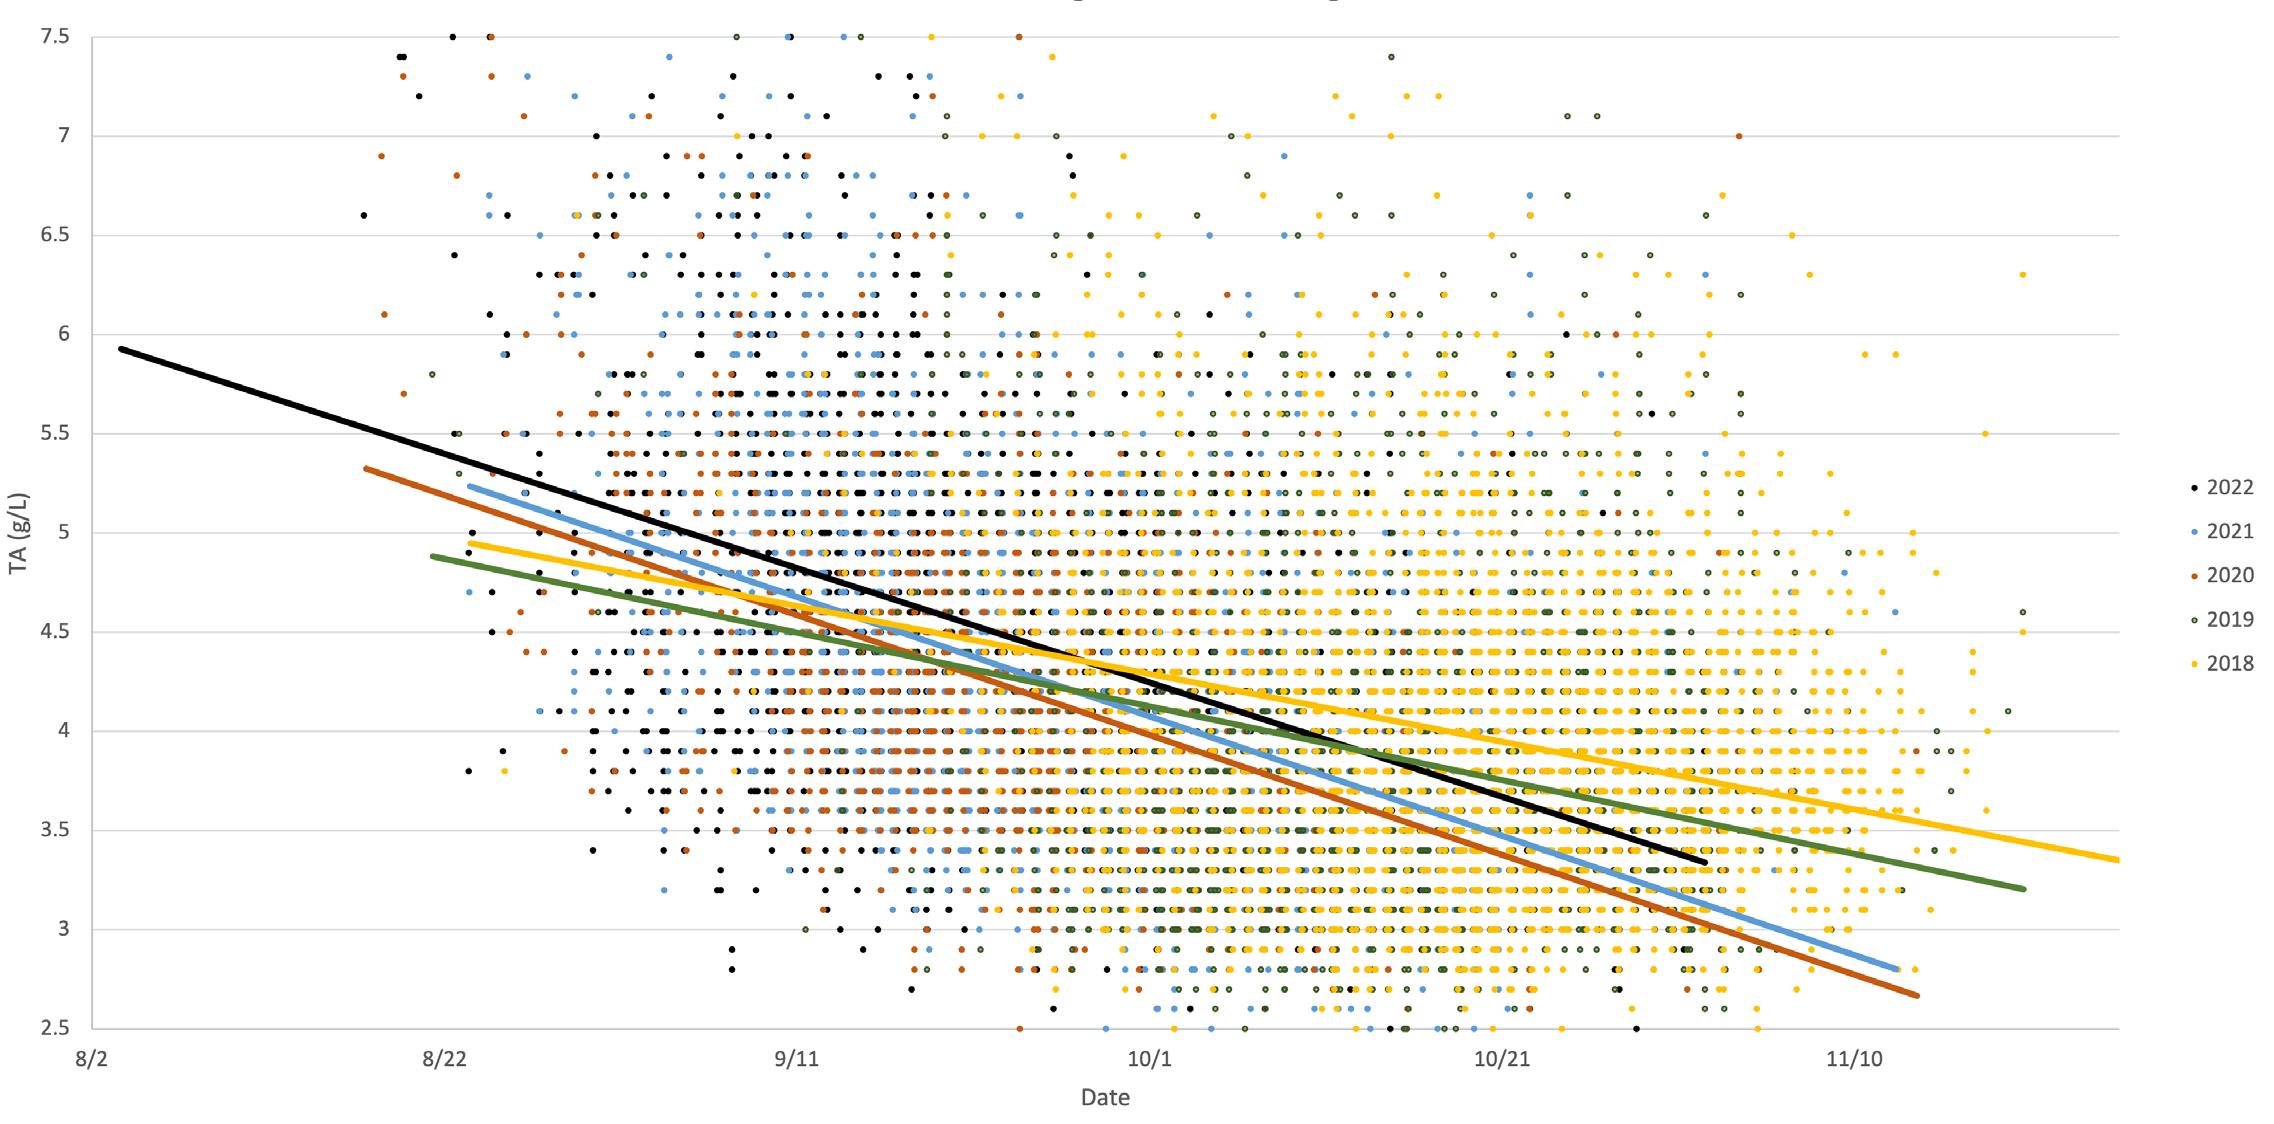
acidity is actually a reflection of complex interactions between the hydrogen ions, organic acids, organic acid-salts, and cations in solution. Often there is no direct correlation between TA and pH. Two musts with similar titratable acidity may have very different pH values.
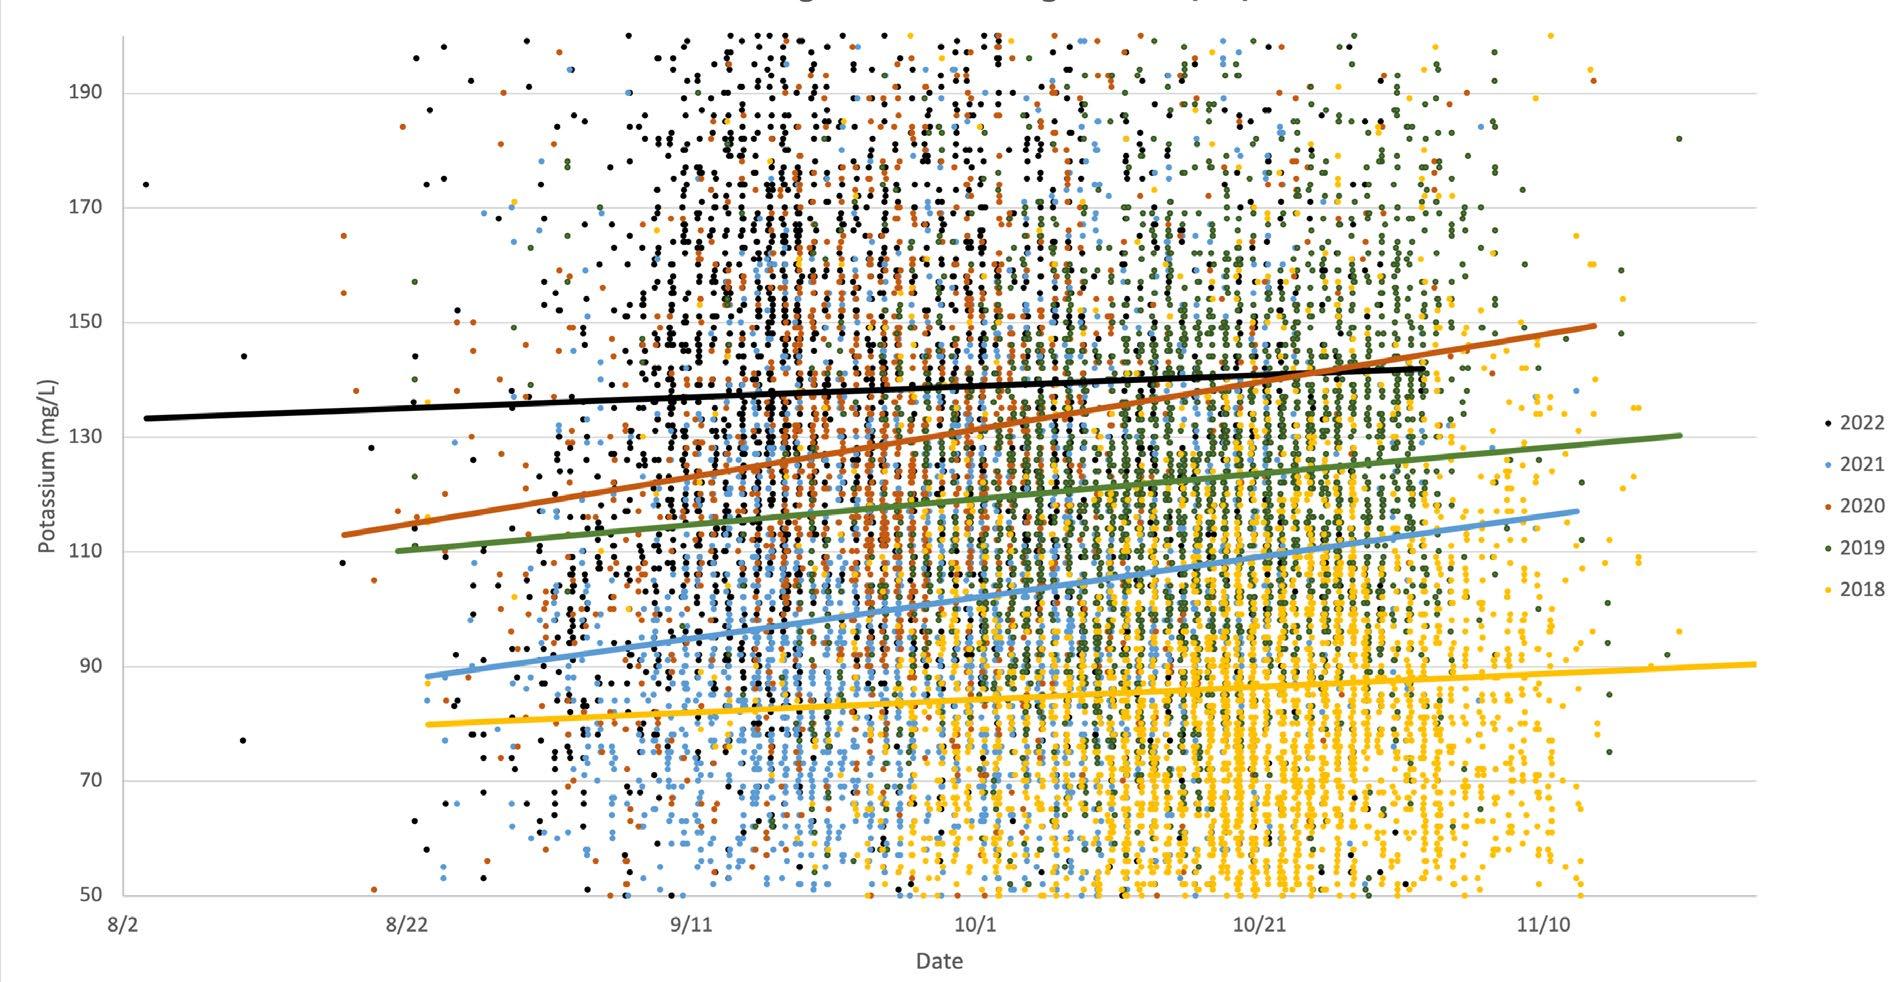
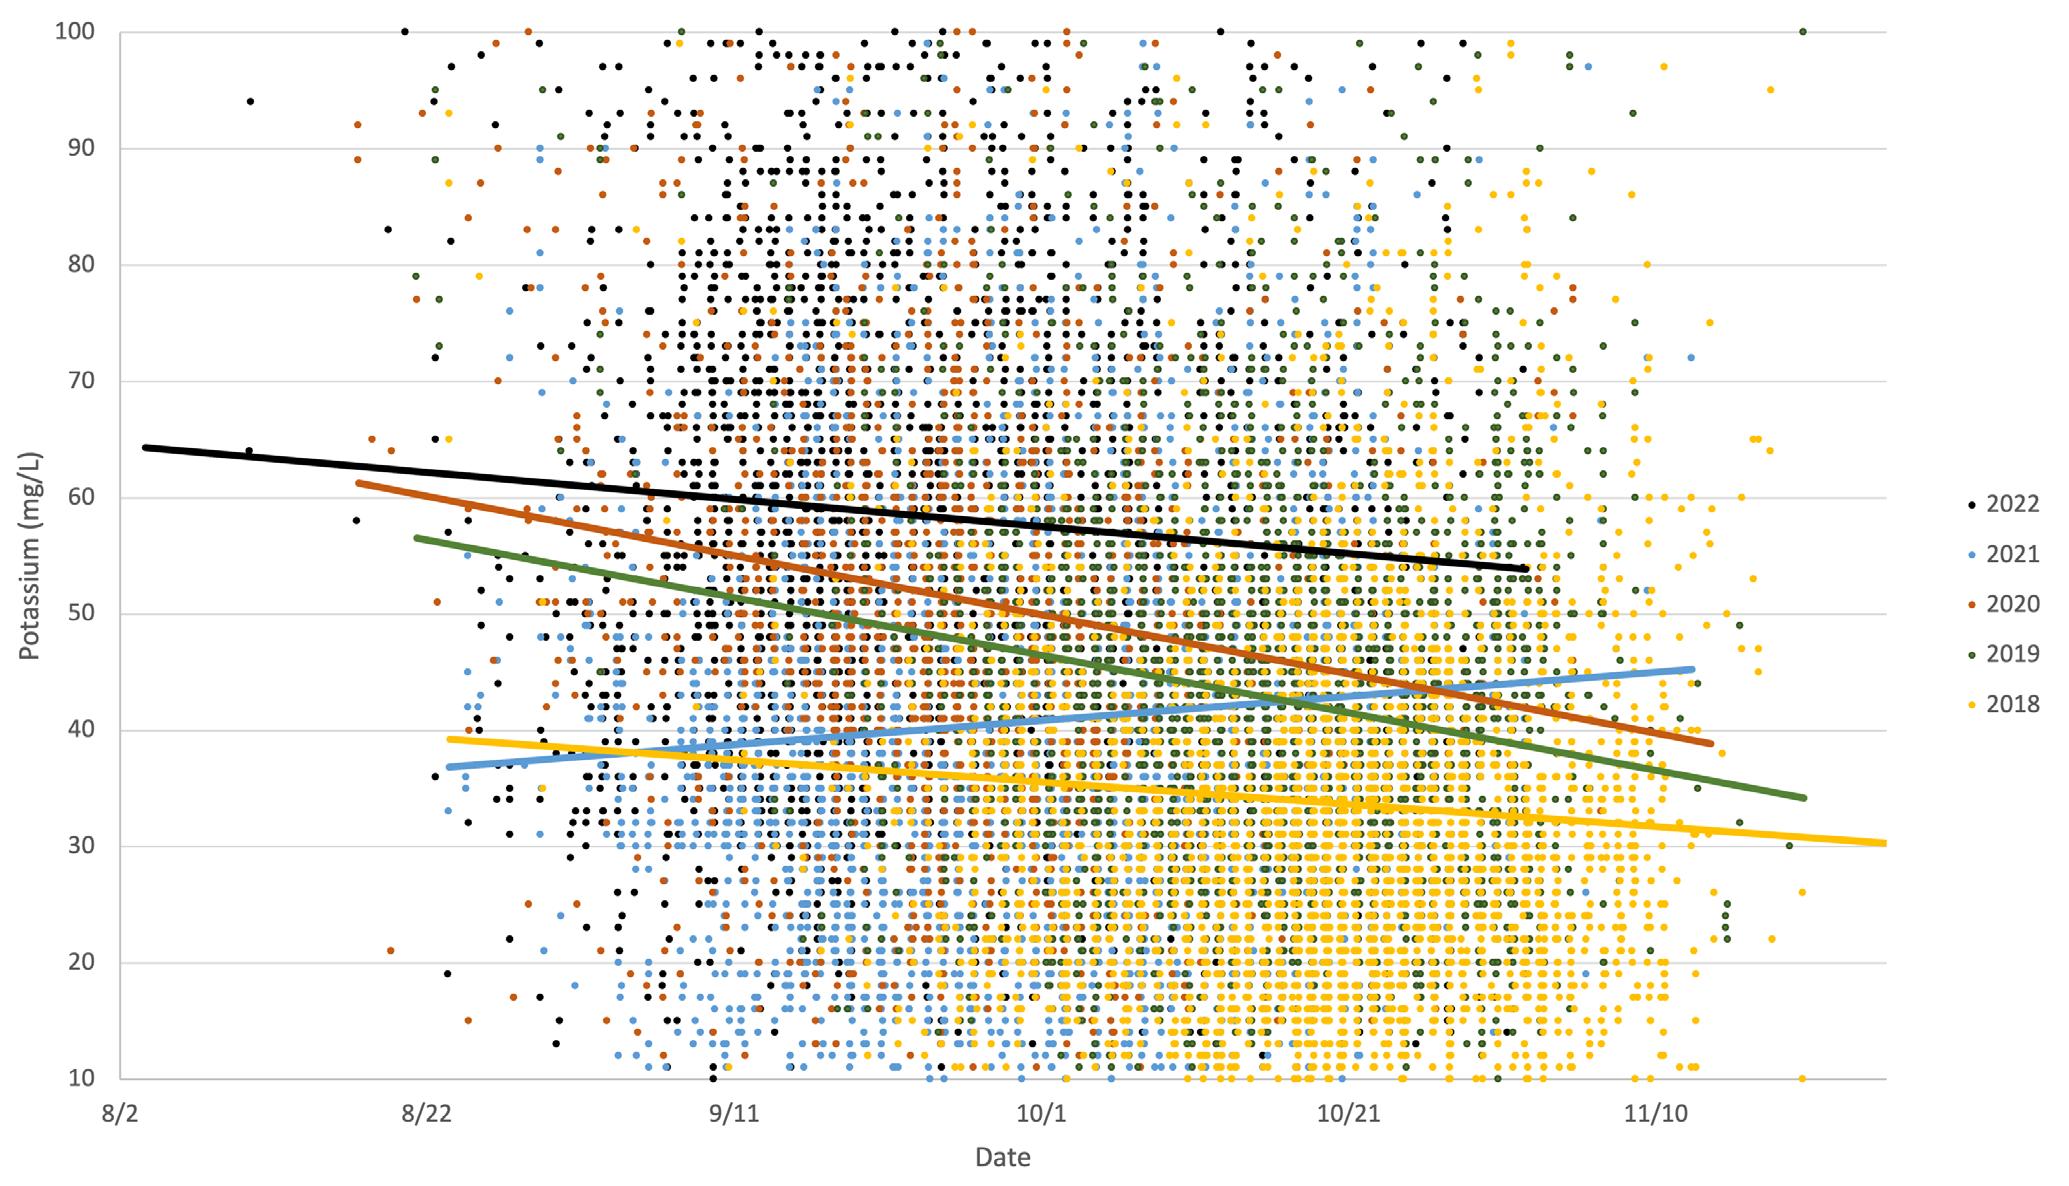
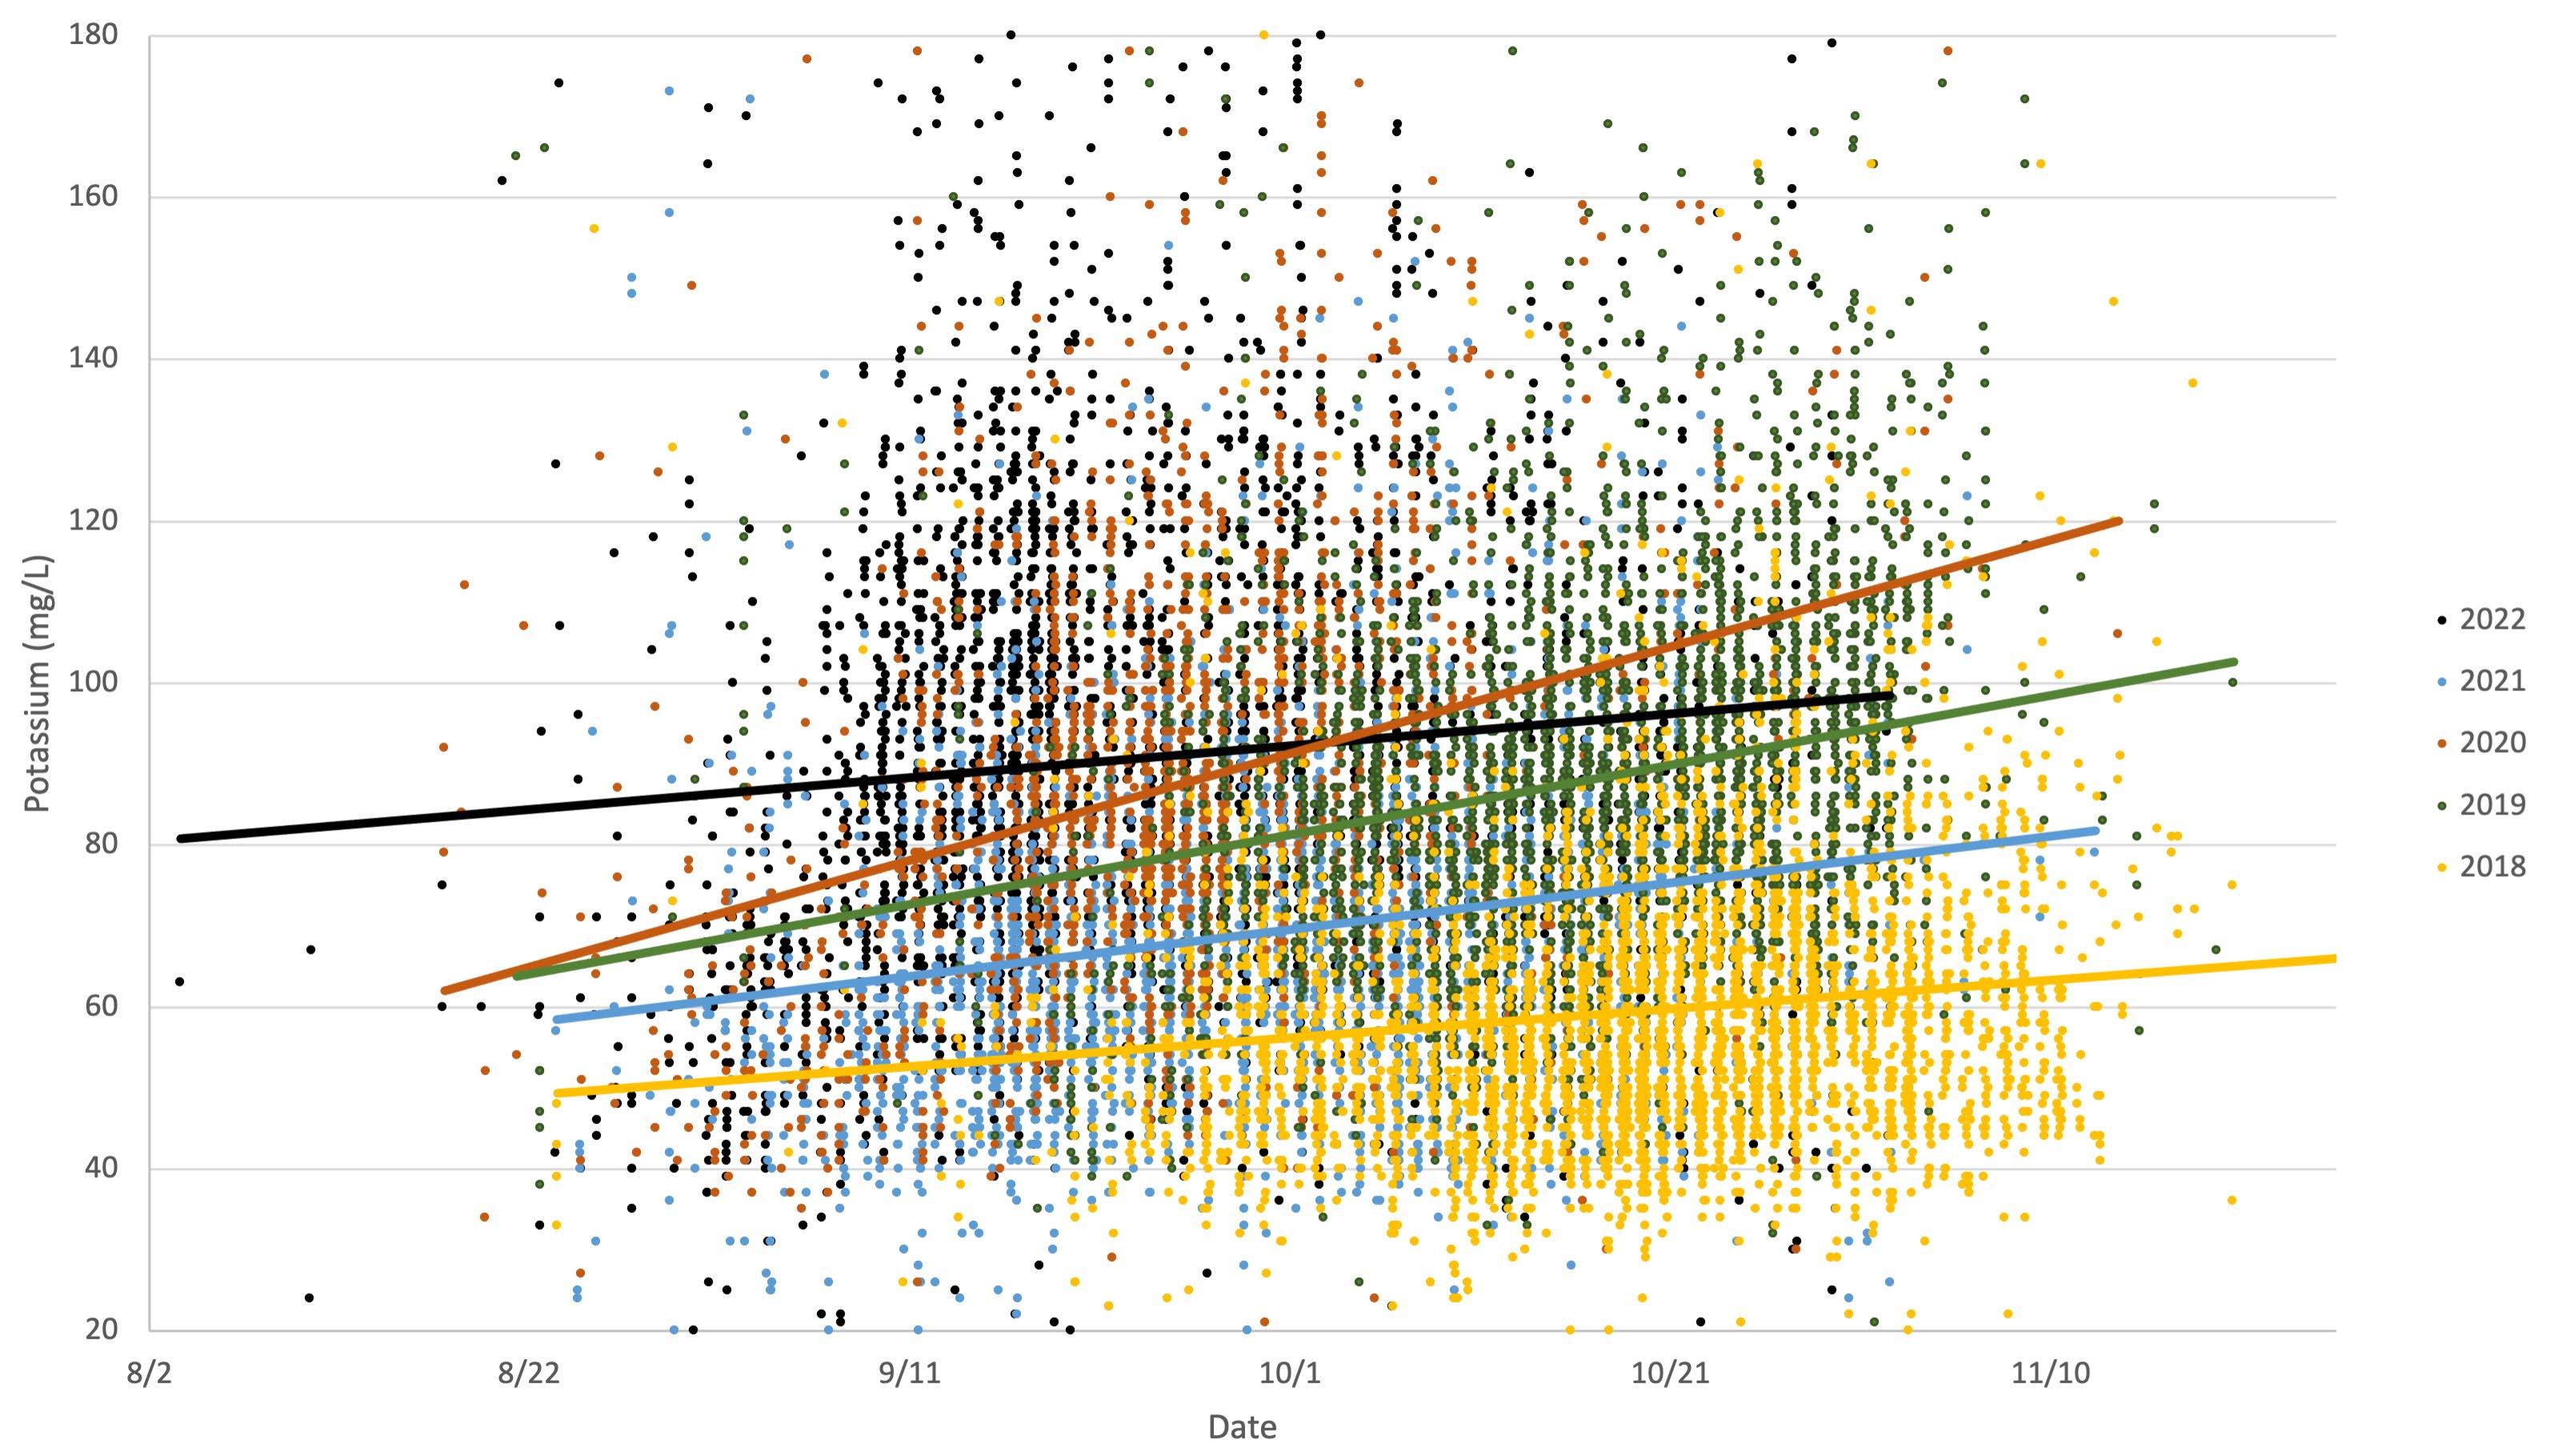
Potassium is the primary cation present in grape tissue. Potassium concentration in the berry is a function of root uptake and translocation. Both are strongly affected by viticultural factors including choice of rootstock, potassium fertilization, and canopy management.
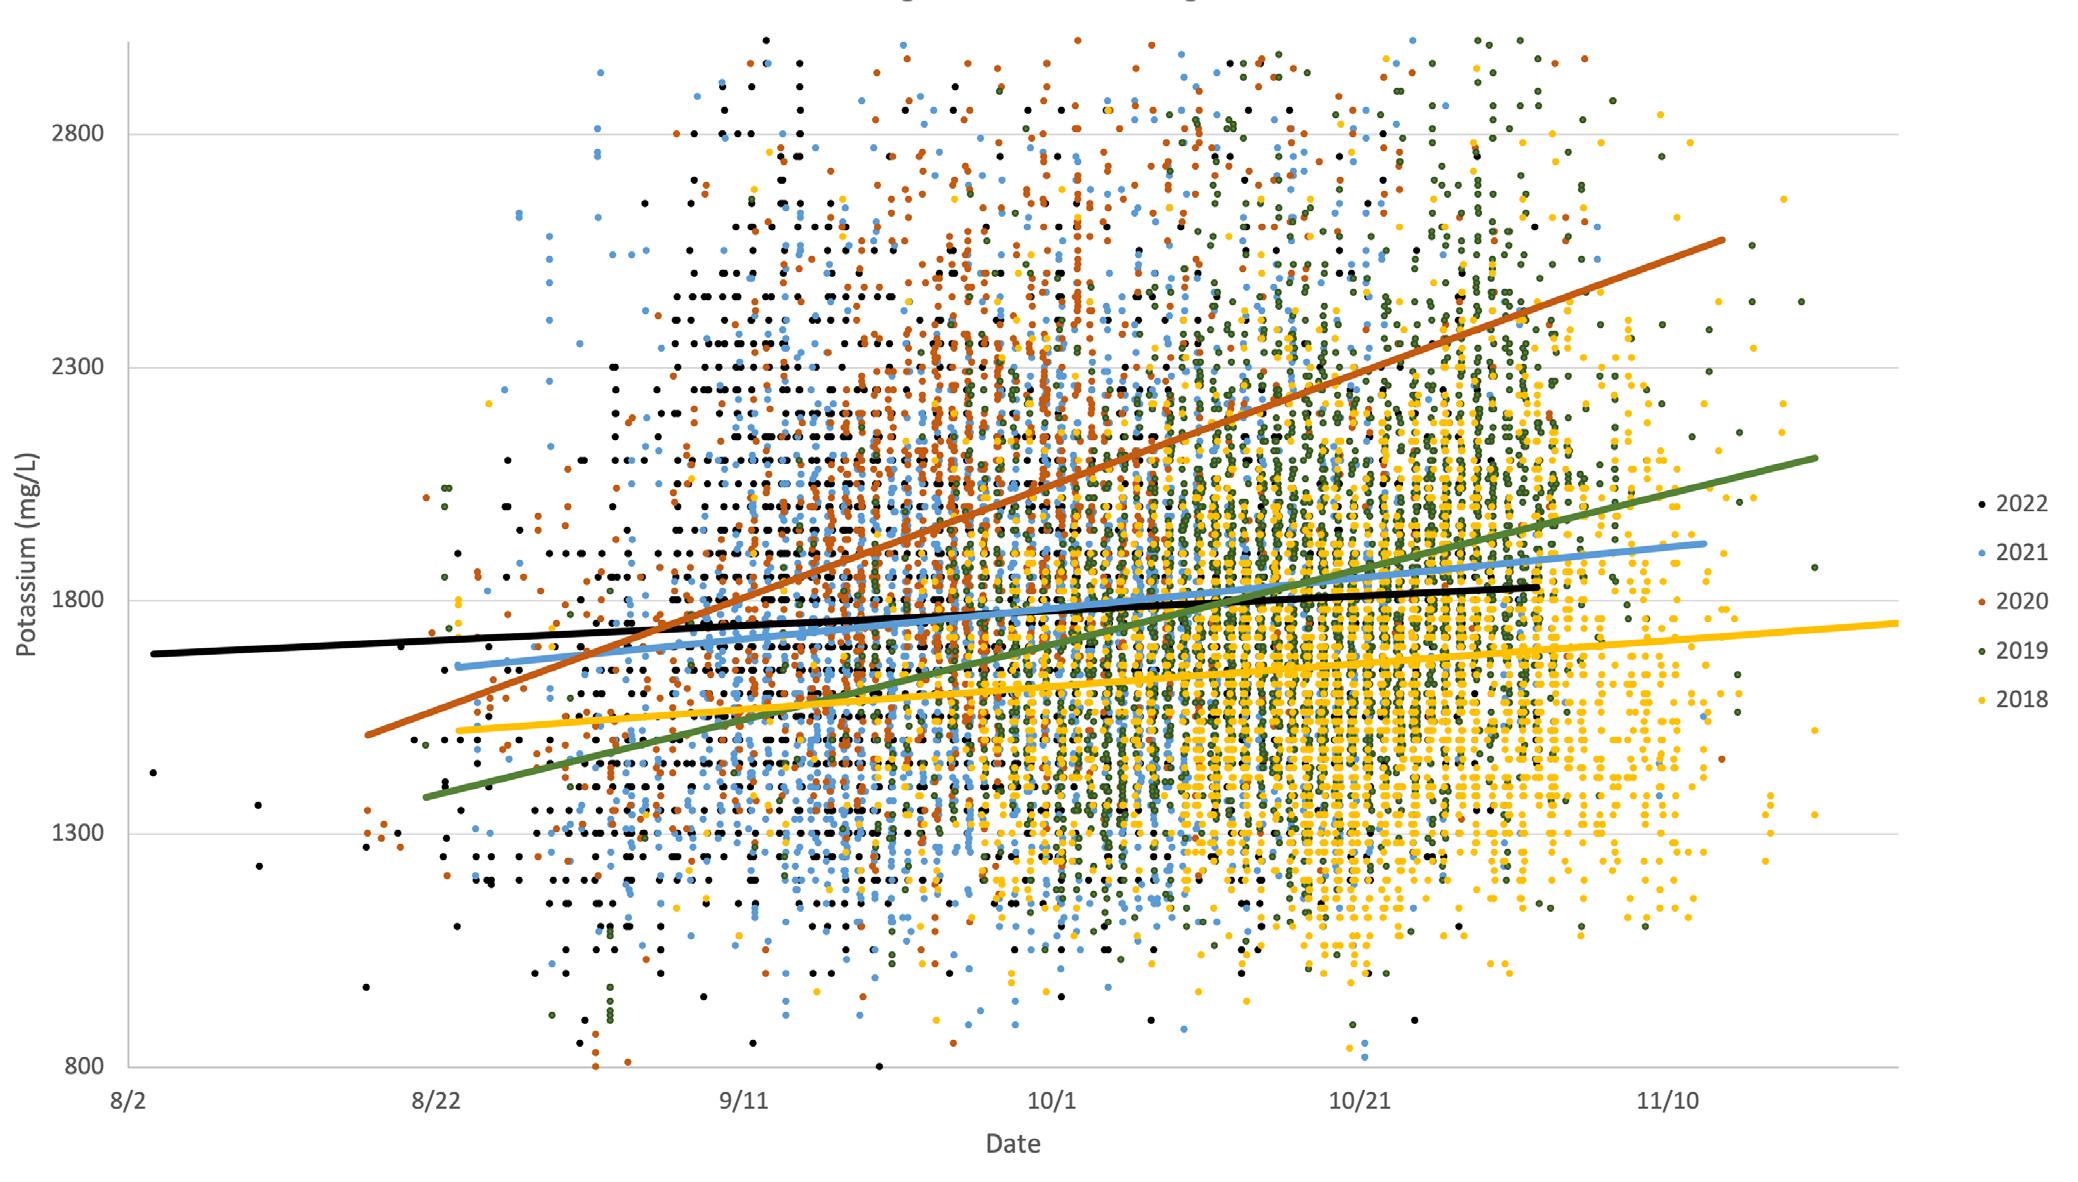
Potassium moves into cells in exchange for hydrogen ions from organic acids. Potassium concentration is highest
near the grape skin. Crushing, skin contact, and pressing all influence potassium levels. Potassium is a critical factor in pH, acid salt formation, tartrate precipitation, and buffer capacity. Decreases in juice potassium are associated with decreased juice pH. In the 2022 vintage, potassium levels were elevated to start, and had a much slower rate of accumulation, possibly due to the sunburn/heat stress.
Conclusions
Juice chemistry is the foundation for the resulting wine. Producing wines with specific targets for ethanol and acid balance, while avoiding fermentation-related problems, requires a thorough understanding of the juice chemistry. Individual components of the juice can and do change from vintage to vintage. Winemakers aware of these changes will be able to adjust their winemaking process, where necessary, to achieve their targeted wine styles.
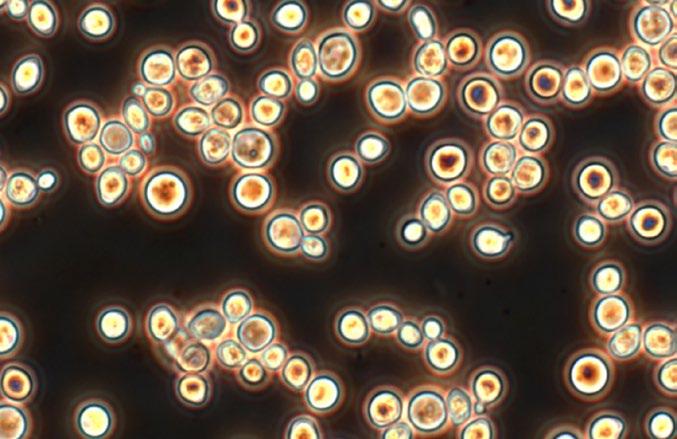
Acetic acid bacteria are commonly associated with grapes and the winery environment. The three groups of commonly detected acetic acid bacteria are Gluconobacter, Gluconacetobacter and Acetobacter. Both Gluconacetobacter and Acetobacter can generate acetic acid from ethanol in the presence of oxygen. The presence of these organisms can cause elevated volatile acidity in wines exposed to air.
Hanseniaspora (Kloeckera) is a wild apiculate yeast that is often present at high levels on incoming fruit. Hanseniaspora can initiate fermentation in the must and produce high levels of volatile acids, including acetic acid and ethyl acetate. It has been associated with acid rot in grapes infected by Botrytis cinerea. Population levels usually decline as alcohol concentration increases.
Pichia is a wild yeast that is often present at high levels on incoming fruit. Pichia can initiate fermentation, resulting in production of high levels of volatile acids, including acetic acid and ethyl acetate. These yeast have been associated with films formed in barrels and tanks during storage.
HANSENIASPORA PICHIAIdentifying and quantifying yeast and bacteria that can cause spoilage during the winemaking process is the first step in preventing these spoilage problems.
Using Scorpions to see the full picture of spoilage microbes in the juice from incoming fruit gives the winemaker better situational awareness for potential problems that can occur during the cold soak process, in stuck or sluggish fermentations, or later during wine aging.
Volatile acidity, measured as acetic acid, can be formed throughout the winemaking process. Both acetic acid bacteria and strains of wild yeast – particularly Hanseniaspora and Pichia – are commonly linked to volatile acidity production prior to and in the early stages of fermentation.
Elevated VA levels often occur during the cold soak process, or between cold soak and fermentation during red wine production. The VA-producing spoilage microorganisms grow quickly during this time, producing increasing levels of acetic acid until fermentation conditions inhibit their growth.
Production of high levels of volatile acidity prior to fermentation can also cause problems later in the production process, including possible impacts on the fermentation performance and wine sensory attributes.
Large numbers of Acetic Acid bacteria on incoming fruit can carry through the fermentation and cause problems with VA production when exposed to air during barrel aging.
In addition to causing sensory impacts, large populations of wild yeast can deplete the YAN in the must, resulting in a YAN deficiency for the Saccharomyces cerevisiae driving the fermentation. Winemakers who detect high levels of Hanseniaspora or Pichia in a must usually recheck YAN before yeast inoculation, and supplement YAN if necessary.
Likewise, if the Scorpions assay detects heterofermentative lactic acid bacteria, such as Lactobacillus brevis, L. kunkeei, L. hilgardii, L. fermentum, and Oenococcus oeni, in a juice, winemakers usually increase their monitoring of malic acid and microbe levels if the fermentation becomes sluggish or stuck. Early identification of the presence of these bacteria and recognizing the risk they pose to difficult fermentations is key to preventing VA formation in stuck fermentations.
COMING INTO THE WINERY ON FRUIT IS ONE OF THE MOST IMPORTANT ENTRY ROUTES FOR SPOILAGE ORGANISMS THAT CAN CAUSE STUCK AND SLUGGISH FERMENTATIONS AND VA PROBLEMS.
MANY WINERIES AROUND THE WORLD USE GRAPE CONCENTRATE IN THE PRODUCTION OF THEIR WINES. ALTHOUGH GRAPE CONCENTRATE IS NOT THE ONLY SOURCE OF ZYGOSACCHAROMYCES YEAST, IT IS CERTAINLY A COMMON SOURCE FOR ZYGOSACCHAROMYCES TO BE INTRODUCED INTO THE WINERY.
The primary species of Zygosaccharomyces typically associated with grape concentrate are Zygosaccharomyces bailii and Zygosaccharomyces bisporus.
Recently, a different species, Zygosaccharomyces rouxii, was isolated from a fermenting concentrate sample provided by a client. In response to this finding, we modified the design of the Zygosaccharomyces Scorpions primer/probe combination to detect more species. The new Zygosaccharomyces Scorpions diagnostic detects an additional 7 species of Zygosaccharomyces for a total of 9 species.
Zygosaccharomyces bailii
Zygosaccharomyces bisporus
Zygosaccharomyces rouxii
Zygosaccharomyces lentus
Zygosaccharomyces mellis
Zygosaccharomyces kombuchaensis
Zygosaccharomyces parabailii
Zygosaccharomyces pseudobailii
Zygosaccharomyces pseudorouxii
Several providers of commercial yeast to the wine industry are offering strains of non-Saccharomyces yeast for use in the winemaking process. These yeasts can be used as bioprotective agents to reduce the impact of indigenous non-Saccharomyces strains as well as a way to reduce SO2 use prior to fermentation. In addition, these yeast strains may provide improvements via increased aroma complexity, wine structure and mouthfeel.
In response to the increased use of these yeast strains by our clients, ETS has developed a series of PCR-based diagnostics to detect the presence of the individual strains; Metschnikowia pulcherrima, Lachancea (Kluyveromyces) thermotolerans, Torulapsora delbrueckii, and Pichia kluyveri.
The PCR-based diagnostics can be used to determine implant success with the individual strains. They can also be used with the ETS Juice Yeast Scorpion Panel to look at the efficacy of these strains at reducing levels of Hanseniaspora uvarum and Pichia membranifaciens, commonly observed in must samples. The diagnostics can be requested for individual yeast species, or as a complete panel.
NON-SACCHAROMYCES YEAST PANEL
• Metschnikowia pulcherrima
• Lachancea (Kluyveromyces) thermotolerans
• Torulapsora delbrueckii
• Pichia kluyveri
INDIVIDUAL YEAST ANALYSES
• Metschnikowia pulcherrima
• Lachancea (Kluyveromyces) thermotolerans
• Torulapsora delbrueckii
• Pichia kluyveri
ETS has received an increasing number of requests to develop a method for determining the efficacy of bentonite fining in juice or during fermentation. Traditional Heat Stability tests can be difficult to perform on juice and fermenting samples. ETS has developed methods to directly quantify two proteins produced by Vitis vinifera in response to biotic and abiotic stress. These proteins, chitinase and thaumatin-like protein (TLP), are very resilient and persist through the fermentation process. Both proteins have been implicated in
haze formation although chitinase may play a larger role in heat stability issues. ETS has developed Enzyme-Linked Immunosorbent Assays (ELISA) to detect the individual proteins. Extensive testing last year indicates a linear response between addition of bentonite and removal of both chitinase and TLP. The ELISA based analyses are applicable to monitoring bentonite fining of juice, as well as bentonite fining during fermentation.
The two components commonly associated with “VA taints”, Acetic Acid and Ethyl Acetate, can be formed by both yeast and bacteria - and in the case of bacteria, can be formed with or without oxygen present.
is strictly speaking a measure of the volatile acids in wine, although in the real world the contribution of volatile acids other than acetic acid is negligible. VA is a normal component of wines at moderate levels (normal concentrations range from 0.3-0.9 g/L of acetic acid), but very quickly becomes undesirable as levels rise. The sensory threshold is around 0.9-1.0 g/L, depending on the style of wine, and the U.S. government sets legal limits of 1.2 g/L in white wine and 1.4 g/L in red wine.
Although not an acid, ethyl acetate is considered by some to be a component of VA. As an ester formed by ethanol and acetic acid, it is often linked to increased production of VA. From a sensory point of view, ethyl acetate is often classified as a “VA taint”, and its “nail polish remover” odor is often a telltale sign of high VA. Similar to acetic acid, there is a fine line between complexity and spoilage: small amounts of ethyl acetate can contribute “fruitiness/sweetness” or other positive characteristics to a wine at low levels. Normal concentrations are usually less than 100 mg/L, while the sensory threshold is generally 130-150 mg/L, depending on the wine style.
Acetic Acid can be produced prior to fermentation by Acetic Acid Bacteria and wild yeast in compromised fruit.
It’s unusual to see alcohol present in juice before fermentation, but if clusters experience fungal rot or other types of damage (such as bird or insect damage), wild yeast in the vineyard can begin fermenting the juice that is leaked out. Acetic Acid bacteria can then convert the alcohol to acetic acid, causing “sour rot” and leading to high VA levels before fermentation has even begun.
Ethyl Acetate is often produced in the early stages of fermentation, and can be a particular problem in native fermentations with a slow start. Native yeast, especially Hanseniaspora, are the main Ethyl Acetate producers at this stage. Note that the Hanseniaspora can consume most or all of the YAN in the must very early in the fermentation, although they will only produce alcohol up to around 6%. High levels of Hanseniaspora and low YAN concentrations can contribute to stuck fermentations.
Acetic acid production in primary fermentation is generally caused by yeast, including Saccharomyces and other species, but can also be formed by bacteria.
The native yeasts Hanseniaspora and Pichia can drive fermentations up until around 6-7% alcohol, at which point they become stressed by the alcohol. Saccharomyces is more competitive as it is tolerant to and produces higher alcohol levels. In certain situations, the native yeasts respond to the changing fermentation conditions by producing elevated levels of acetic acid.
Bacteria, usually Lactobacillus, can also generate acetic acid from sugar and can often produce high levels of VA in stuck and sluggish fermentations. Oenococcus oeni, the bacteria used for inoculating most malolactic fermentations can also produce acetic acid from fructose. This frequently occurs at the end of malolactic fermentation if there is still fermentable sugar remaining in the wine.
Ethyl Acetate production during fermentation is significantly impacted by the yeast strain and fermentation temperature. Although Saccharomyces cerevisiae will produce ethyl acetate, research has indicated that some of the Saccharomyces bayanus strains are more likely to form ethyl acetate in cold fermentations.
The amount of fermentable sugar (glucose and fructose) in juice and the average conversion rate of sugar into alcohol can be used to predict the potential alcohol level in wines.
Our clients have reported that glucose + fructose values improve the quality of their predictions, but it is important to remember that yeast populations and fermentation conditions vary, and any prediction of potential alcohol is only an approximation. Alcohol conversion ratios can be variable, so it is possible your actual alcohol may be lower or higher than the estimate.
Many of our clients have found that the conversion rates observed for their own yeasts and fermentation conditions remain relatively constant, and they use their internally observed conversion rates to calculate potential alcohol content based on their glucose + fructose values.
With white wines, predictions are usually fairly accurate. With red wine, however, getting a truly representative juice sample can be a challenge and can affect potential alcohol predictions. A juice sample taken soon after a tank is filled may not take into account un-popped berries, unripe berries (less sugar and more acids), and raisins (sometimes an overlooked source of large amounts of sugar, acid, and potassium).
We suggest sampling after an initial 10°Brix drop, and analyzing the fermenting sample for glucose + fructose and alcohol simultaneously for a more accurate potential alcohol estimate. Proper sample preparation is key to accurate results. At ETS, juice samples are centrifuged before analysis, and then mixed by inversion to avoid stratification, ensuring the most accurate results. Particulates have a minimal impact on refractometry, but can have a large impact on densitometry results.
Predicting potential alcohol levels in finished wines sounds simple, but there is more than one way to measure “sugar”, and formulas to convert this sugar into potential alcohol often miss the mark.
The “old school” method was to multiply °Brix by 0.6. One degree Brix is defined as 1 gram of sucrose in 100 grams of aqueous solution. However, grape juice does not naturally contain sucrose, but rather glucose, fructose, and a variety of organic acids and other dissolved solids. So when used for grape juice, °Brix is actually just an approximation of dissolved sugar, not an accurate representation of the fermentable sugars, and using ºBrix for estimating potential alcohol adds an additional layer of uncertainty to alcohol predictions. Differences between ºBrix and actual fermentable sugar content are even more pronounced in high ºBrix fruit and in fruit affected by fungal growth.
How ºBrix is measured also has an influence. Differences exist between ºBrix by refractometry, densitometry (using either hydrometers or digital instruments), and other secondary measurements. The differences among the various measurement techniques are quite unpredictable depending on sample composition.
A more modern calculation that has proven to be more accurate uses glucose+fructose analysis, which provides a more accurate measurement of the levels of fermentable sugar compared to using ºBrix.
Note that in ripe fruit, glucose + fructose numbers often appear higher than the corresponding ºBrix results, because ºBrix is measured as a percentage by weight, meaning ºBrix values are greatly influenced by the density of the juice, while glucose + fructose is measured as weight by volume and is independent of juice density.
An official conversion rate formula used in Europe is: Potential Alcohol (% vol) = glucose + fructose (g/L) / 16.83. In practice, rounding the 16.83 conversion factor to 17 is common.
In the wine industry, a term like “sugar” can mean different things. Clients often request testing for “RS”, but this term can be very ambiguous.
°Brix is a measurement of the apparent concentration of sugar. It is commonly used for grape juice and must and is expressed as a percentage by weight (% w/w). One degree Brix is defined as 1 gram of sucrose in 100 grams of aqueous solution. When the solution contains dissolved solids other than pure sucrose, as is the case for grape juice and must, the °Brix is only an approximation of dissolved sugar.
In grape juice, Glucose + Fructose analysis measures the combined concentrations of the two main sugars present that can be consumed by yeast, also known as "fermentable sugars." Compared to °Brix, Glucose + Fructose can provide a better estimate of potential alcohol concentration after fermentation. In wine, “residual sugar” usually refers to the sum of Glucose + Fructose, an indication the amount of fermentable sugars remaining post fermentation, which is also an indication of ‘dryness’.
Sucrose is not captured by this test. If it has been used in the winemaking process (such as for chaptalization of must, secondary fermentation of sparkling wine or added as a sweetener) measurement of Glucose + Fructose alone is usually not adequate –instead see Glucose + Fructose (Inverted)
Historically, “Residual Sugar” was measured by the Reducing Sugar method. This test derives its name from the ability of most sugars in juice or wine to ‘reduce’ other compounds. The most common reducing sugars are glucose and fructose. However, the method does not distinguish between fermentable and non-fermentable sugars, or other ‘reducing’ compounds for that matter, and these other compounds may contribute to reported results.
Because of these limitations, the Reducing Sugar method is no longer the preferred choice to monitor completion of primary fermentation.
The Glucose and Fructose Panel provides the individual levels of glucose and fructose, in addition to their combined concentration. This test is often requested to investigate or remedy stuck or sluggish fermentations.
Inverted Glucose + Fructose provides the sum of the concentrations of glucose and fructose after “inversion” of the sample. Inversion is a process by which sucrose is broken apart into glucose and fructose, so that it can be measured and included in the reported results. Hence, this test is useful when “Residual Sugar” is required after chaptalization of must, secondary fermentation of sparklings or whenever sucrose has been used as a sweetener in wine, other alcohol beverages or spirits.
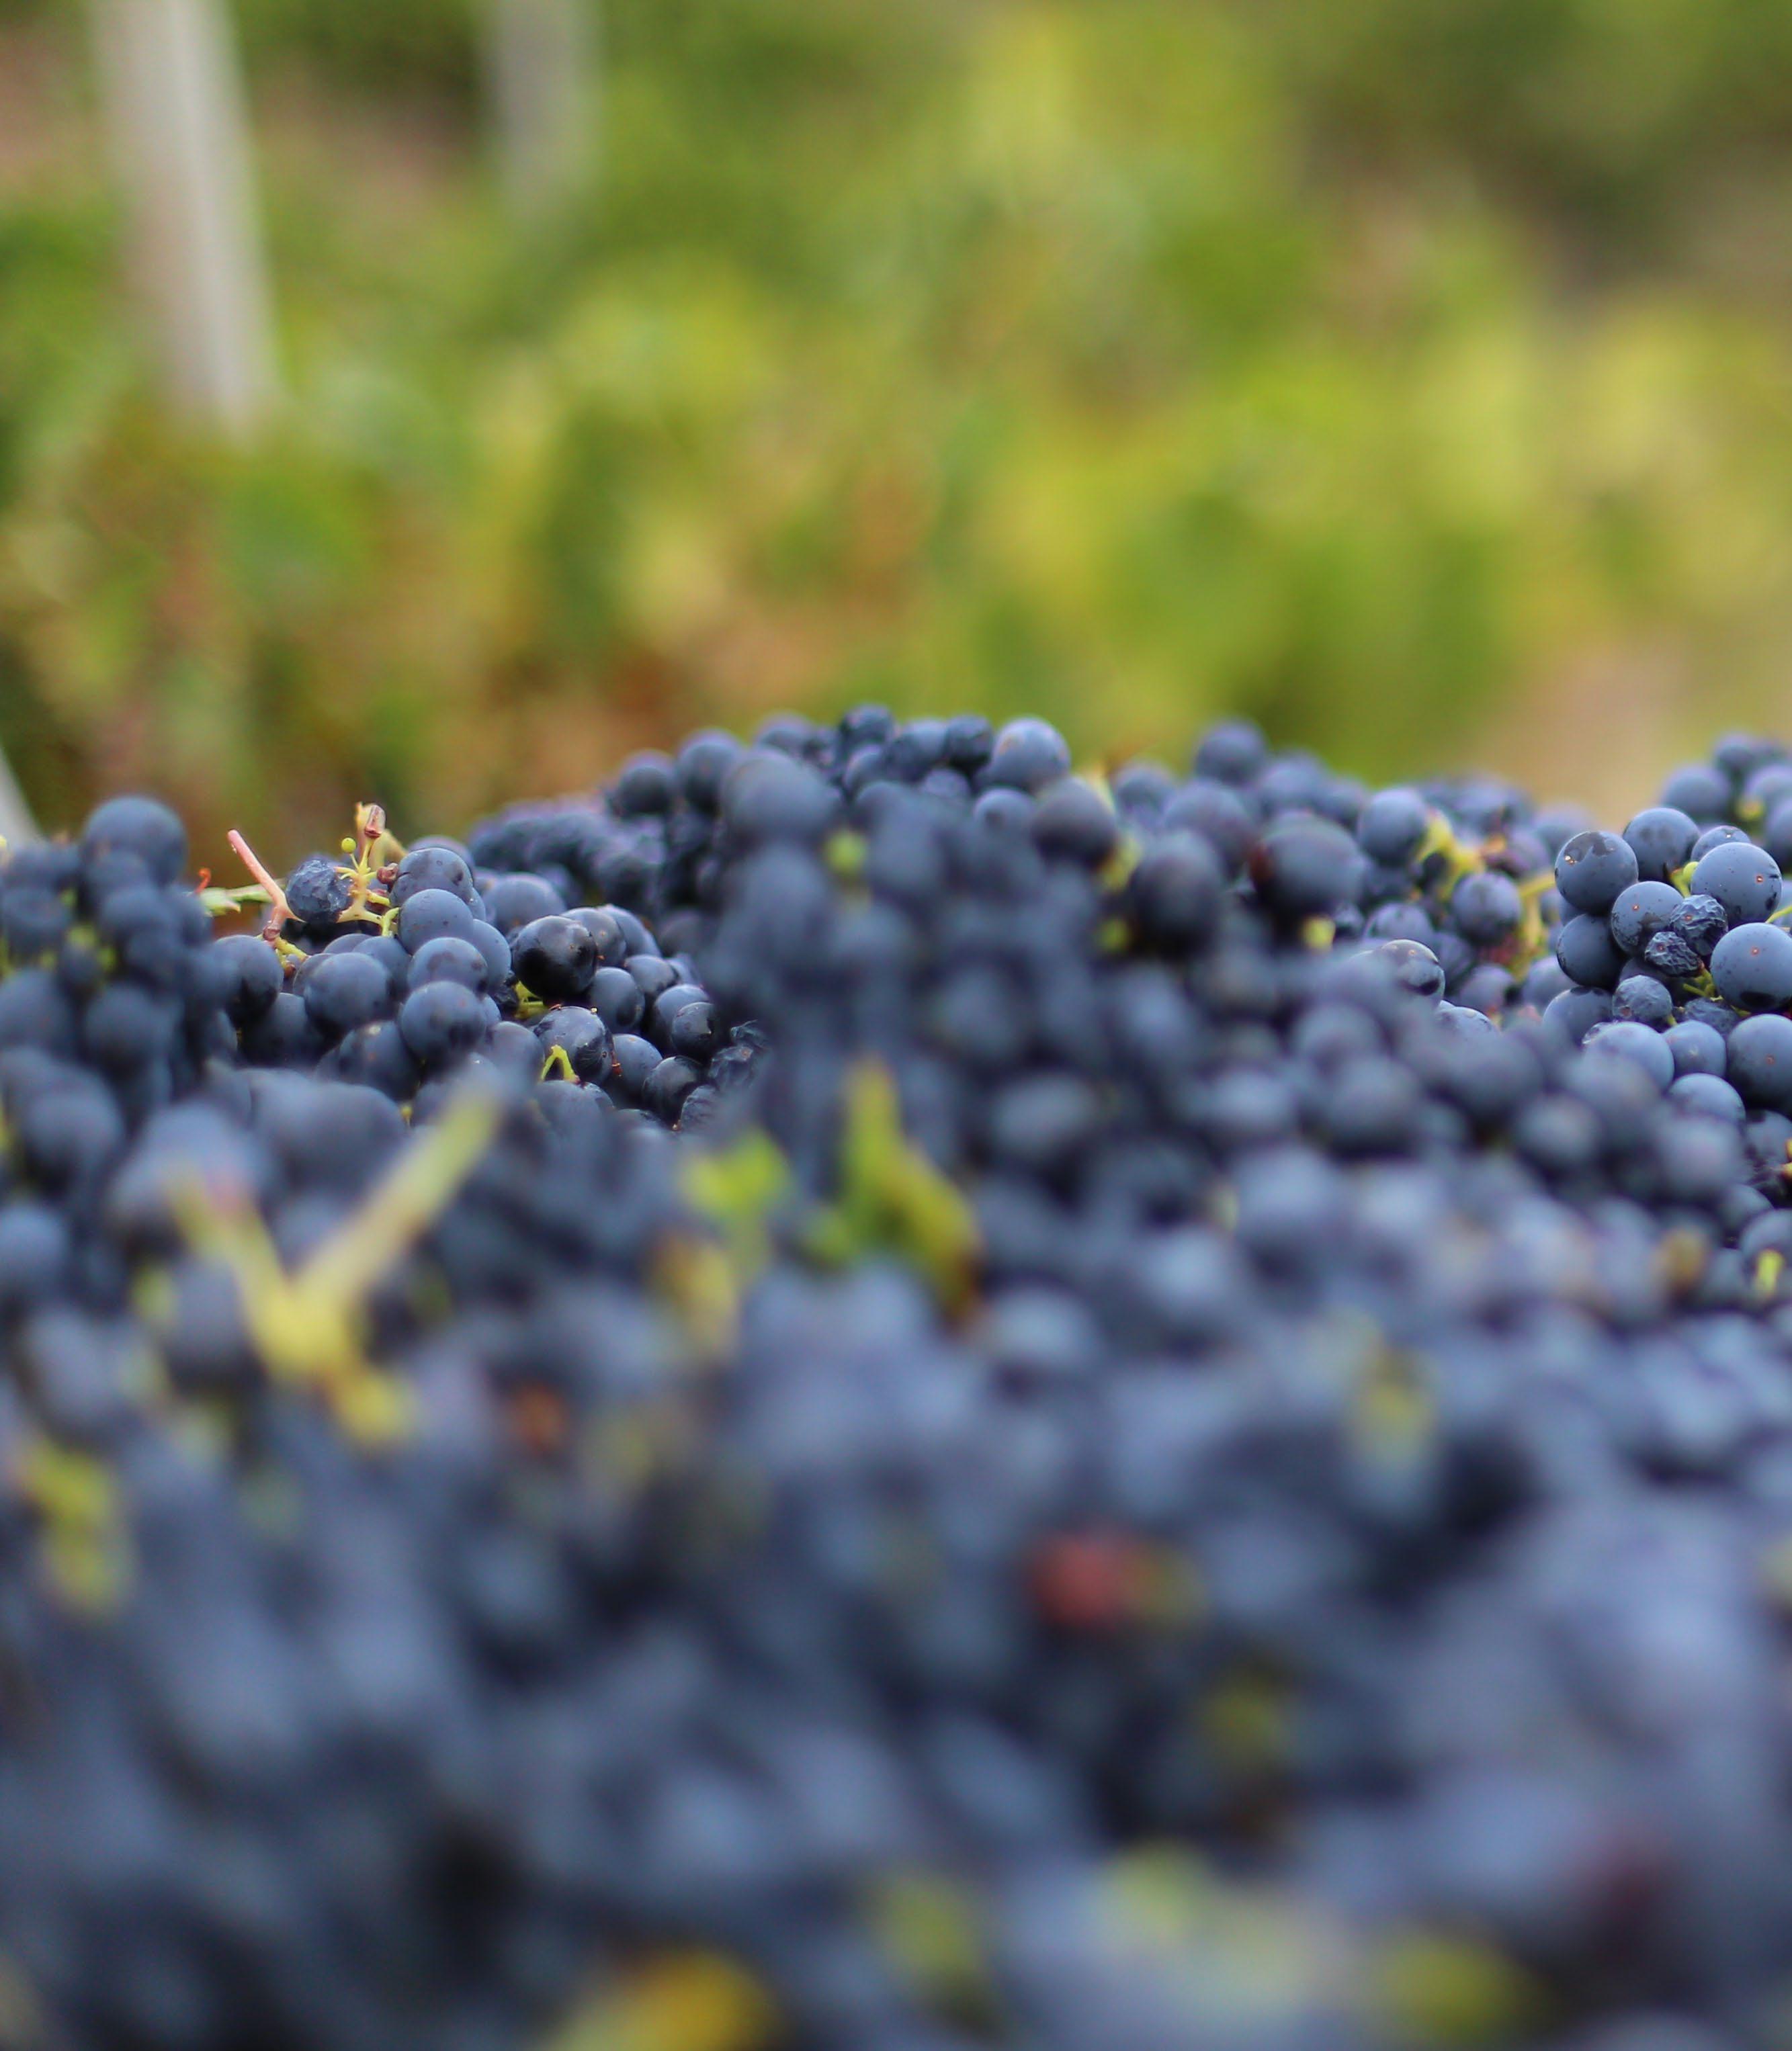
ETS offers a full suite of advanced HPLC-based analytical tools to evaluate phenolic compounds in grapes, juice, fermenting must and wine. The range of phenolic analyses allows flexible use and implementation to suit individual needs.
GRAPE PHENOLIC PANEL
Phenolic compounds in red wine grapes are directly linked to eventual wine flavor, color and aging characteristics.
The grape phenolic panel can characterize site to site variation as well as within site differences. It works well as a prediction tool for describing vintage effects on potential phenolics and is a great tool for vineyard research projects. It is very sensitive to changes in phenolic compounds occurring during grape maturation. The changes in grape tannin are particularly important for red wine picking decisions. The grape phenolic panel can track changes in seed ripening, skin tannin extractability and tannin modification. Dilution and concentration effects on tannin and other phenolic components can be monitored with the Grape Phenolic Panel particularly when used in conjunction with Grape Water Content.
Successful winemaking strategies require accurate information on grape composition. Winemakers use this panel during fermentation to reach target levels of tannin for specific wine styles, to monitor seed extraction, for adjusting tannin modification through oxygenation and for decisions on extended maceration and pressing.
PHENOLIC
Phenolic compounds are extracted from grapes during fermentation and maceration. Monitoring the phenolic composition of the must during fermentation can greatly enhance a winemaker’s control of the process.
Juice bleeds, fermentation temperatures, pump-over or punch down regimes, the use of rack-and-return, oxygen or air additions and press timings can all be fine-tuned with feedback on changes in phenolic composition. With this information, winemakers can adapt winemaking practices to fit the vintage and successfully create wines of a target style.
Phenolic composition is one of the main components of red wine style. The amount of tannin and its composition is the foundation of a wine’s structure. There are no “correct” values for these parameters. A winery must define their own style as a brand and for individual products within that brand.
Integrating phenolic information into stylistic choices requires an understanding of the impact of tannin on the sensory profile of wines. For a winery new to this information a good strategy is to analyze a selection of recent products. Recent production lots, finished wines and competitor’s products are good choices. Tasting products with analytical information allows winery staff to build the connections between taste and analytical information. Taste is the final arbiter of style but a clear understanding of the relationship of taste and analysis is needed to turn analytical information into action.
After the completion of fermentation/maceration, a wine lot typically represents a specific vineyard and fermentation tank. This is an excellent point for collecting quality control data. A comprehensive review of production lots is a powerful tool for monitoring block to block variation and the effects of winemaking practices. Analysis of finished production lots early in the vintage is very useful for changing fermentation practices and targets later in the vintage.
RAPID PHENOLIC PANEL FOR WINE OR RED WINE PHENOLIC PROFILE
Winemakers interested in consistent tannin and color levels benefit by comparing the phenolic profiles of bulk wines prior to blending. Potential blends can be compared to target phenolic levels and benchmarks prior to final blend.
RED WINE PHENOLIC PROFILE
Many wineries establish QC benchmarks for phenolic content immediately after bottling. This is especially useful for determining product consistency and for monitoring wine development during aging.
RED WINE PHENOLIC PROFILE
A historical review of products from within a winery and evaluation of similar products from other producers is an excellent way to establish phenolic benchmarks. This is often the first step in building an integrated program of phenolic analyses. A careful review of finished wines combined with sensory evaluation and market feedback can identify program strengths and weaknesses. The identification of desirable levels for key phenolic components creates targets that can be incorporated into process control points in the vineyard and winery.
The rapid phenolic panel for grape berries includes a 'wine-like' extraction of grape berries along with analysis of total anthocyanins, polymeric anthocyanins, quercetin, tannins and catechin in the resulting extract. It is an excellent tool for monitoring phenolics development in grapes, evaluating vineyard and vintage variation, viticultural experiments, and can help guide tannin management decisions during winemaking. Submitting samples as berries is recommended.
NAME
Catechin mg/L HPLC
Catechin/Tannin Ratio Calculation
Polymeric Anthocyanins mg/L HPLC
Polymeric Anthocyanins/Tannin ratio Calculation
Quercetin glycosides mg/L HPLC
Tannins mg/L HPLC
Total Anthocyanins mg/L HPLC
The rapid phenolic panel for wine provides a snapshot of important phenolic compounds with next day results. This information can help guide decisions on adjusting fermentation and maceration processes and blending decisions and works well as a complement to the rapid phenolic panel for grape berries to monitor vineyard effects on wine phenolic composition.
NAME
Catechin mg/L HPLC
Catechin/Tannin Ratio Calculation
Polymeric Anthocyanins mg/L HPLC
Polymeric Anthocyanins/Tannin ratio
Tannins mg/L HPLC
Total Anthocyanins mg/L HPLC
BACKGROUND:
Wines from a young Syrah vineyard were extremely tannic and harsh.
ANALYSIS:
Client submitted grape samples for the ETS Grape Phenolic Panel
RESULTS:
TANNIN AND QUERCETIN GLYCOSIDES WERE BOTH VERY HIGH IN THE GRAPE SAMPLE. CATECHIN WAS QUITE LOW, PARTICULARLY FOR THE HIGH LEVEL OF TANNIN WITH A CATECHIN:TANNIN RATIO OF 0.008.
DISCUSSION AND ACTION:
Syrah grapes can have very high levels of tannin in the skins. Seeds, however, tend to ripen early so it is rare to see high catechin in Syrah grapes or seed tannin problems in wine. In this case, the problem seemed to be related to high skin tannin from excessive sun exposure. Skin tannin and quercetin glycosides increase with direct sun exposure. Sun exposed grapes synthesize quercetin glycosides in the skins to help block ultra violet light and simultaneously synthesize tannin to mitigate UV damage. The canopies were small and most grape clusters were in direct sunlight.
The client installed a shade cloth trial the following vintage and was able to reduce tannin and quercetin glycosides in the shaded treatments. Looking at vineyard variation, they found higher tannin in grapes from weaker sections of the vineyard and found a strong relationship between trunk diameter and grape skin tannin. Vines with smaller trunks had more tannin in the grape skins.
Using trunk diameter as a guide, the client increased vineyard inputs in weaker areas to improve growth. Shade cloth was installed in all the Syrah blocks. Tannin levels were reduced in both grape and wine samples and wines had improved textural qualities. As the vineyard matured, vine size and natural shading increased and tannin concentrations declined to non-problem levels.
Eucalyptol- Eucalyptus traits are considered typical in some “cult” wines; on the other hand, in excess this character can be overwhelming. Even a slight “eucalyptus” note can interfere with delicate varietal aromas, and can have a detrimental influence on certain grape varieties.

1 The glutathione content in grapes indicates their antioxidant potential, and can be influenced by a number of factors including soil nitrogen, vineyard practices, and grape maturity levels.
Analyzing changes in glutathione levels during production helps to pinpoint where in the process glutathione is being lost – often from contact with air or exposure to copper residues.
A testing program can also identify winemaking processes that boost glutathione release after fermentation, and increase levels in wines.
Since the discovery of eucalyptol (1,8-cineole) in red wines by ETS Laboratories in 2003, we’ve detected and measured eucalyptol in a large variety of wines exhibiting “eucalyptus-like” aromas. Flavors perceived during tasting were usually strongly related to concentrations of eucalyptol. Regardless of the grape variety, trace levels close to 1 ppb are associated with “fresh”, slightly “minty” notes. In the low ppb range, “minty” or “fresh bayleaf” aromas become stronger, and more easily identifiable as “eucalyptus” as concentrations increase. Wines with strong “eucalyptus” odors may contain more than 20ppb of eucalyptol.
Eucalyptol’s sensory impact in wine is considered more or less desirable depending on the grape variety. Wines from southern Rhône and Mediterranean varieties seem better able to accommodate the characteristic well. Moderate levels can be appreciated in wines from Bordeaux varieties. Whereas with Pinot Noir, even trace levels can detract from varietal expression.
Application:
As eucalyptol may be mostly contributed by eucalyptus-derived MOG (leaves, bark debris…) hiding in grapes, analyzing grape samples before harvest is mostly pointless, and routine testing is not offered by ETS Laboratories. On the other hand, wine analysis assists winemaking teams in objectively documenting their sensory impressions and managing a strong flavor component. Unlike IBMP and smoke-derived compounds (see p. 38), eucalyptol is relatively slow to extract during red winemaking, making shorter macerations a valid strategy to minimize impact. Winemakers who wish to minimize or maintain consistent levels of “eucalyptus” character will also benefit by determining eucalyptol concentrations in distinct wine lots prior to blending.
Glutathione is not an aroma compound itself, but is a powerful antioxidant that protects white wines and rosés from oxidation and loss of aroma or flavor.
A low level of glutathione in grapes leads to lower levels in the juice, and early losses of aroma compounds.
Glutathione levels fluctuate during production, as the compound can be absorbed by yeast and then released after fermentation.
If final glutathione levels are low in young wines, the wines will experience faster loss of fresh varietal and fruity aromas, and poor aging potential.
Monitoring glutathione levels can be beneficial through out the winemaking process to maximize white wine aroma and flavor, and prevent premature aging.
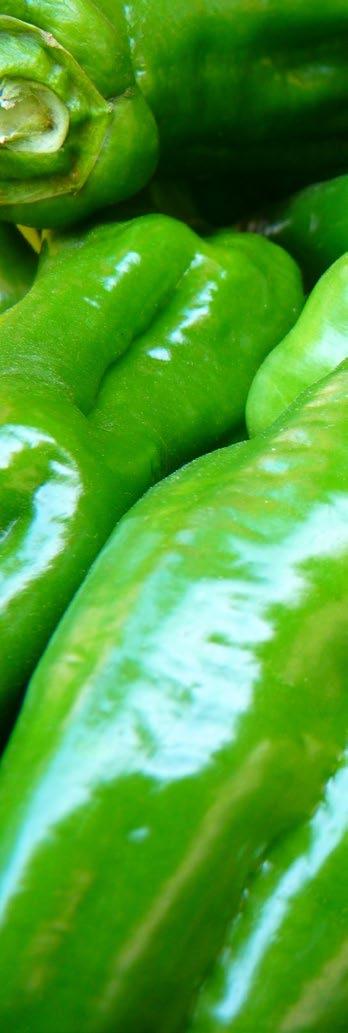
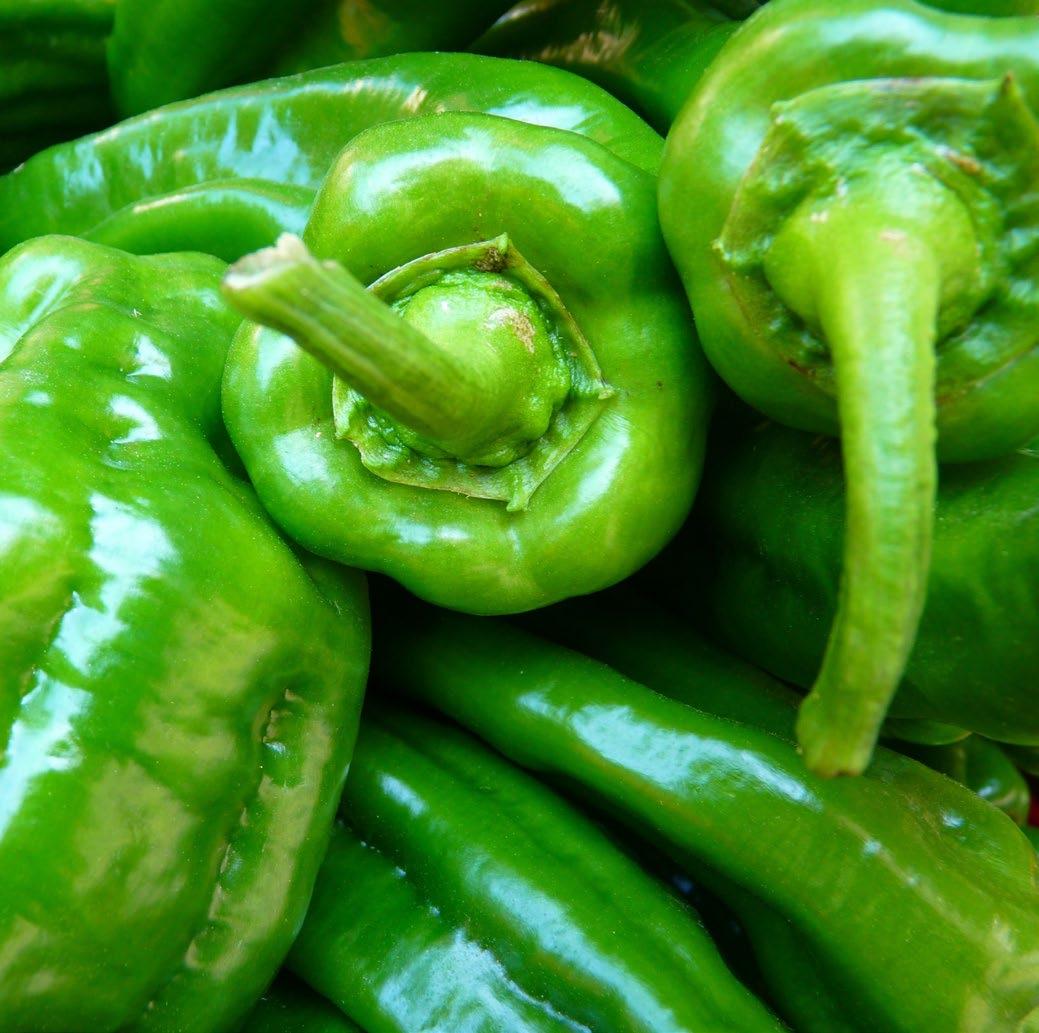
Isobutylmethoxypyrazine (IBMP) is the most important methoxypyrazine, a group of molecules responsible for very distinctive vegetal aromas in Sauvignon Blanc and a variety of red wines, mainly from the Cabernet family. In Sauvignon Blanc, these compounds add an often desired “grassy” character. In red wines however, the “green bell pepper” flavor is largely unpopular. Excessive IBMP levels lead to disappointing ratings and mixed success in the marketplace.
The “green bell pepper” flavor in wine depends primarily on IBMP levels in harvested grapes. Once grapes have been picked, IBMP levels are not easily altered by standard winemaking processes.
Application:
The intensity of “green bell pepper/grassy” characters in wines can be predicted by measuring IBMP in grapes right before harvest. Grape screening of IBMP helps identify “problem” vineyards or blocks.
Since IBMP decreases during grape maturation, monitoring IBMP levels throughout ripening is a unique tool for assessing “aromatic maturity”. It allows targeting harvest dates based on desired aroma characteristics.
Monitoring IBMP from the early stages of the ripening process can greatly improve fruit quality from underperforming vineyards. Levels in grapes are well known to be linked to
vine vigor, canopy and water availability, with severe heat occasionally causing IBMP’s natural degradation to stop. Once the kinetics of IBMP accumulation and degradation in specific sites are understood, viticultural practices can be modified accordingly. Once grapes have been picked, IBMP levels are not easily altered by standard winemaking processes.
The IBMP potential of grapes can be grossly underestimated from juice samples, making whole berries the preferred sample in most cases. Analyzing juice samples may be relevant in white winemaking, however.
ETS has been offering this Basic Panel of guaiacol and 4-methylguaiacol (guaiacols) which are the primary markers of smoke impact volatile (free) markers since 2008. Despite its simplicity, it has an excellent track record for assessing wildfire impact with pre-harvest grape samples, small-scale fermentation samples (micro-ferments), and production wines before contact with oak.
Notably, it’s utility was confirmed by the 2018 Mendocino Complex Fire Lake County Winegrape Commission Study. Participants in this study were the University of California Cooperative Extension (UCCE), the Australian Wine Research Institute (AWRI), and the AWRI Commercial Services. (Please see “From Blaze to Bottle: Smoke Gets in Your Wine”by Glenn McGourty in the January 2020 Issue of Wine Business Monthly).

ETS offers also an extended panel of volatile (free) smoke markers. In addition to guaiacol and 4-methylguaiacol (guaiacols), this panel measures the secondary markers of smoke impact o-cresol, m-cresol, p-cresol, phenol, syringol and 4-methylsyringol.
This extended panel is available for grapes, small-scale fermentation samples (micro-ferments), and wines. Compared to the Basic Panel, additional markers allow more complete assessments of wildfire impact, and provide useful information with moderately oaked wines (e.g. from so-called “neutral” barrels, which often contribute low amounts of guaiacols making interpretation of results very difficult).
In 2020 ETS finalized a unique panel of glycosylated (bound) smoke markers using a state-of-theart combination of solid phase extraction, liquid chromatography, and triple quadrupole mass spectrometry (SPE/HPLC/MS/MS - QQQ).
ETS has worked behind the scenes with the Wine Institute Technical Committee, the AWRI, and several major wineries to reach an agreement on a common list of glycosylated markers. This goup joined forces to have pure reference compounds (and their isotopic analogues) synthesized for each of the markers in that list. This goal was achieved in December 2020. These analytical standards allow extremely reproducible quantitative results which are comparable between laboratories. ETS continues to offer analysis for these compounds in grapes, micro-ferments, and wines.
In a nutshell, the finalized Smoke Glycosylated markers panel includes, for each of the volatile markers listed in our Expanded Panel, its main respective glycosylated (sugar-bound) form – See figure 1. Note that glycosylated smoke-derived compounds are not contributed by toasted oak, making them particularly useful to assess wildfire impact in oaked wines. They are not directly odor-active, but may contribute lingering aftertastes often experienced with impacted wines. It is possible that they may hydrolyze in wine, slowly releasing volatile “free” forms and causing smoke flavors to become more noticeable with time. Several studies at ETS and elsewhere are investigating the actual extent of this mechanism in finished wines.

Guaiacol Guaiacol Rutinoside
4-Methylguaiacol
4-Methylguaiacol Rutinoside
ortho-, meta- and paraCresol Cresol Rutinoside
Phenol Phenol Rutinoside
Syringol Syringol Gentiobioside
4-Methylsyringol
4-Methylsyringol Gentiobioside
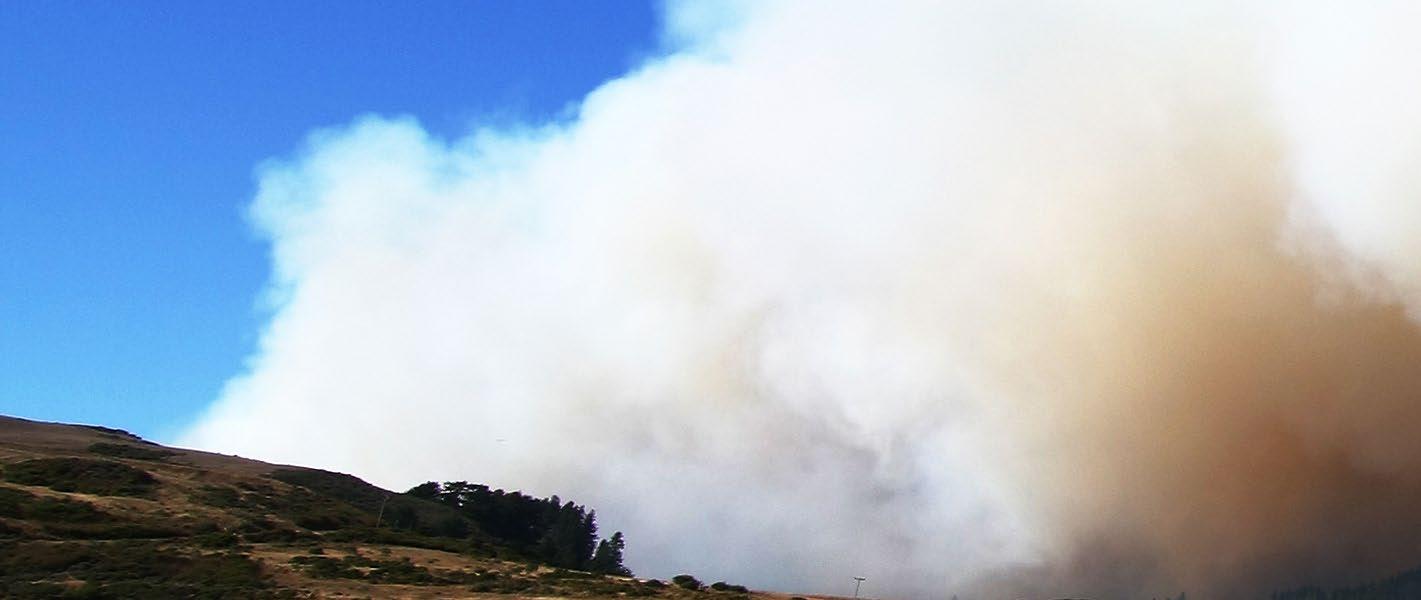
Wildfire impact in grapes and wines is caused by a wide range of volatile phenols found in wildfire smoke. These compounds are absorbed and accumulate in berries. They eventually end up in wine where they can cause unwanted flavors. These off-flavors, described as “smoky”, “bacon”, “campfire” and “ashtray”, are usually long lasting and linger on the palate even after the wine is swallowed or spat out.
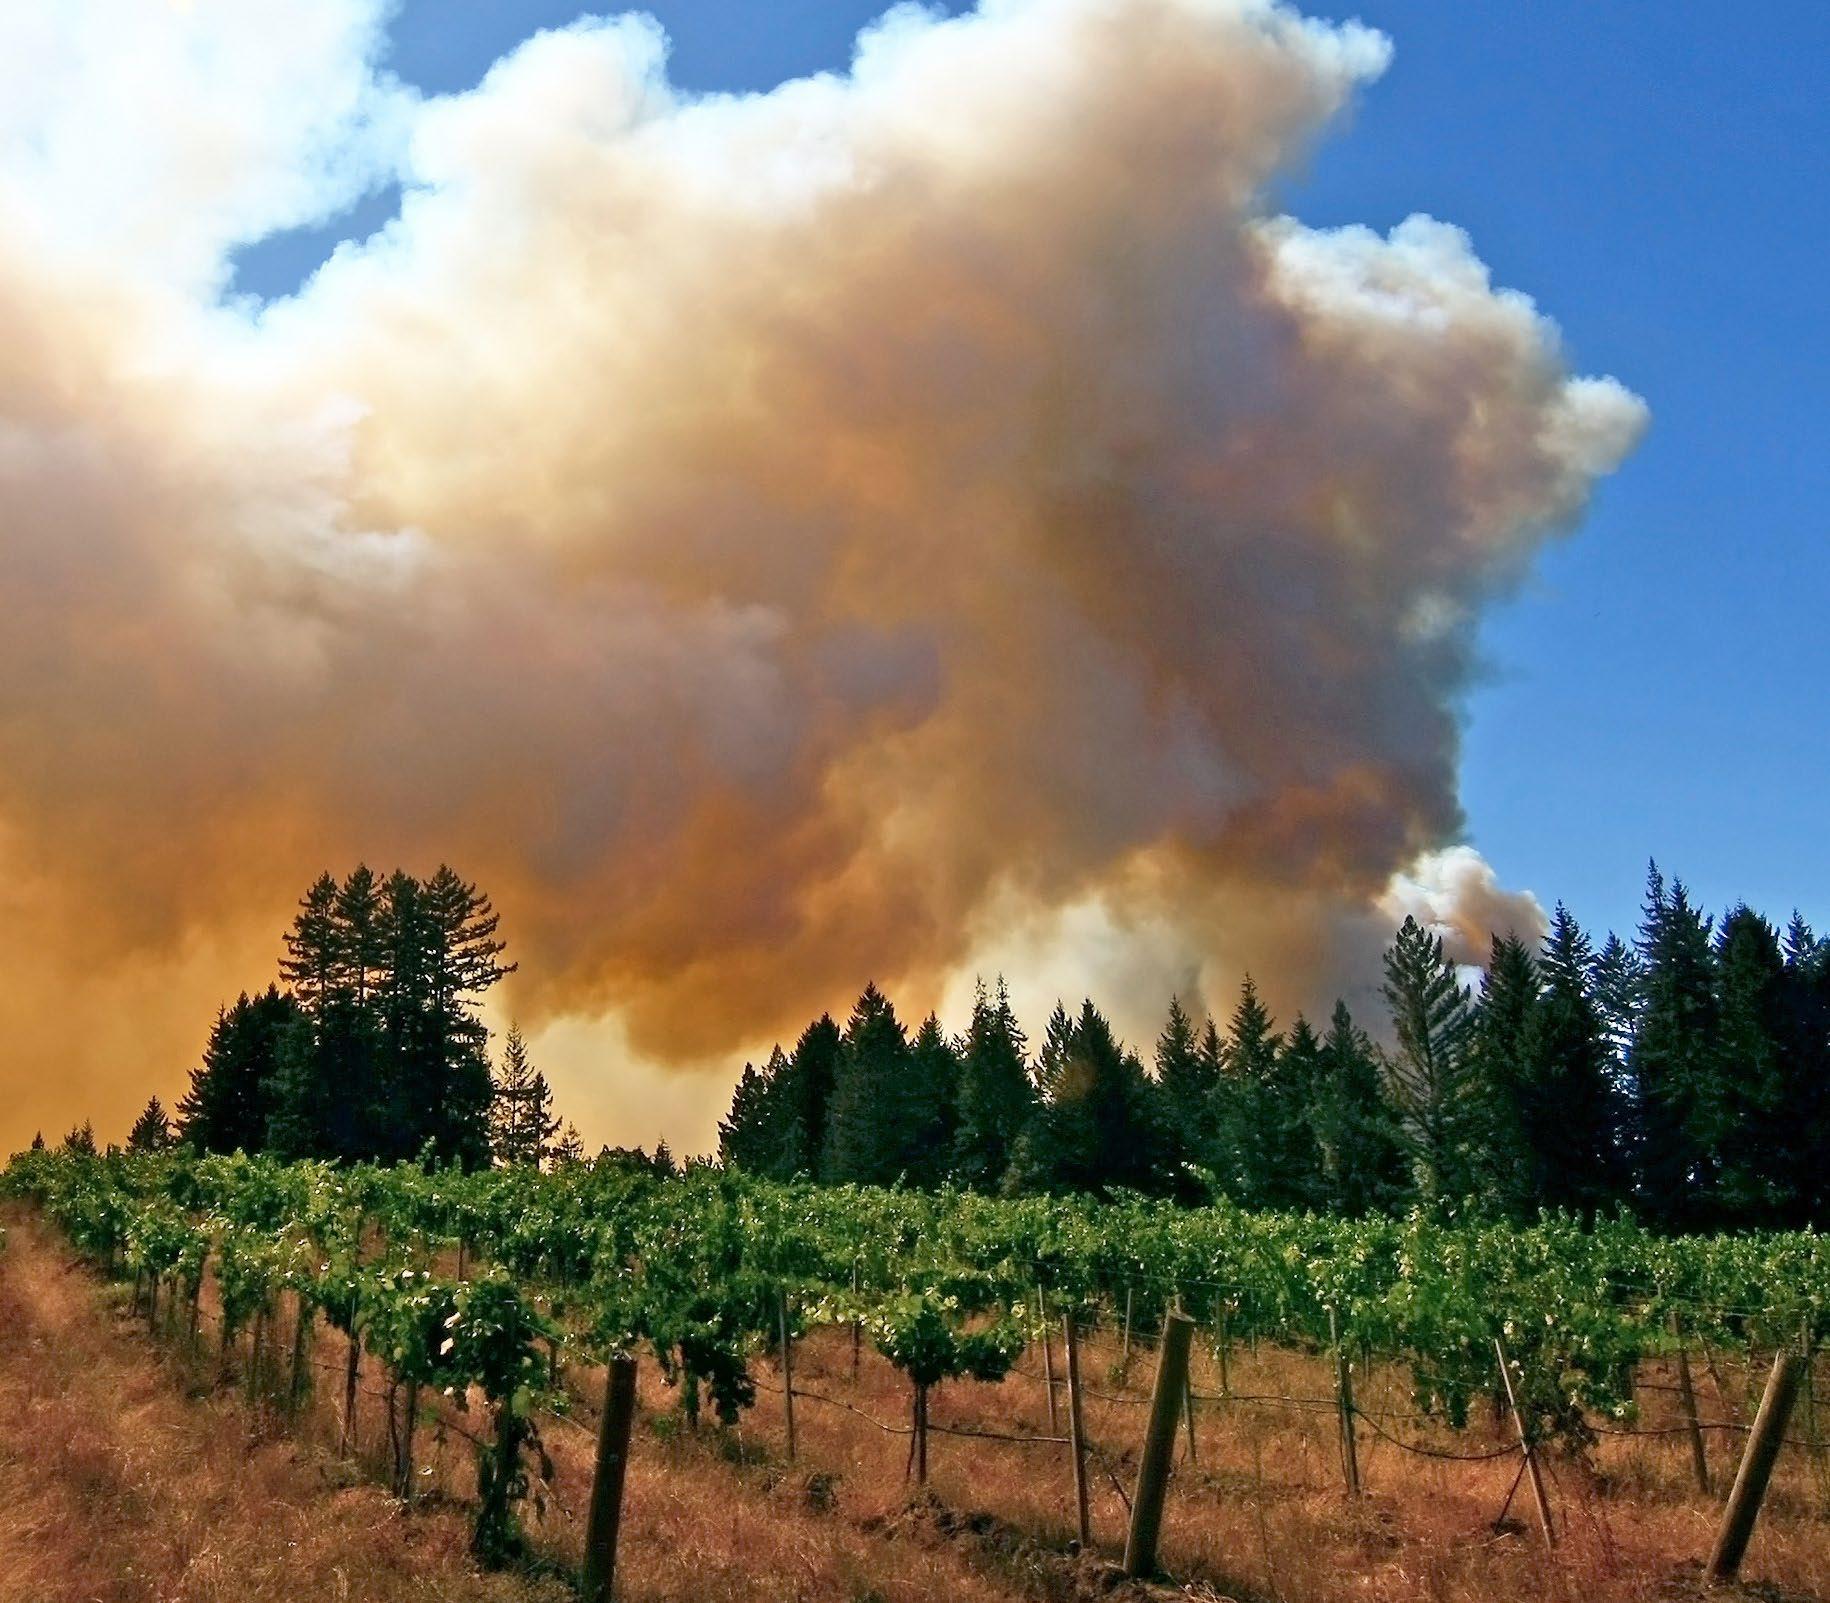
Smoke impact in wine was identified as a serious problem after the 2003 wildfires in Australia and British Columbia. The California wine industry was also affected following the wildfires of summer 2008, and smoke impact has been a concern for many growers and wineries ever since. Here is a review of the various types of samples that may be submitted for testing:
During the 2008 California wildfires, ETS developed an analytical tool to screen grapes for the risk of smoke impact. This analysis measures trace levels of free guaiacol and 4-methylguaiacol in whole berries. Knowing the levels of these indicators in berries enables winemakers to assess the risk of smoke impact, and choose an appropriate course of action to mitigate the effects in their wines. Since 2021, an extended panel of volatile (free) smoke markers panel and a glycosylated markers panel have been available for berry samples.
Exposure of vines to wildfire smoke can widely vary within a small geographic area, depending mainly on proximity with the fires and wind conditions. Obtaining representative samples can be challenging. Mixing grape
It is possible to measure smoke taint markers in juice samples, but since smoke compounds are mostly located in skins, whole berry testing is the preferred method for preharvest screening. We do not accept fermenting samples, which may constitute a safety hazard.
In order to complement pre-harvest grape tests, wines from small-scale fermentations (“micro-ferments” or “bucket ferments”) may be tested for volatile smoke markers (basic or extended panels), and for glycosylated markers. The pros and cons of both tests are outlined in Figure 2.
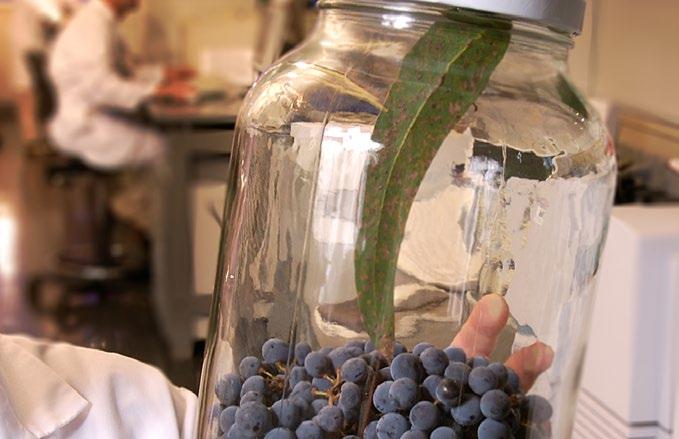
varieties in composite samples should be avoided, as grape cultivars often react differently to a similar exposure to smoke. Syrah grapes contain naturally occurring guaiacol and should never be mixed with grapes from other varieties. Submit 200 to 300 loose berries, keeping them cold and undamaged as much as possible (do not crush them). When shipping samples, use hard plastic containers with icepacks in an insulated package. Avoid submitting cluster samples, which trigger additional fees and may delay getting results.
Berry samples are often requested by crop insurance providers, although micro-ferment samples are becoming more widely accepted.
It is advisable to keep backup samples in a freezer.
Analyzing immediately after completion of primary fermentation allows a first assessment of wildfire impact in production wines. It is preferable to sample and analyze wines that have not come in contact with oak or oak-derived products, which can contribute volatile smoke markers. With barreled wines, it is still possible to get useful information from the volatile markers by choosing the extended panel of volatile (free) smoke markers rather than the basic volatile marker panel (guaiacols only), and from taking samples from the most “neutral” barrels available. Keep in mind that there is no issue analyzing oaked wines for glycosylated markers, as oak or oak products do not contain these compounds. Analyzing for glycosylated markers in wine is always relevant regardless of contact with oak.
tasters
Scale Ferments (Micro-ferments) as pre-harvest testing options for wildfire smoke impact
Following the 2018 Mendocino Complex Fire Study (1), the selection of volatile (“free”) and glycosylated (“bound”) markers currently offered by ETS and the AWRI has shown to be relevant in the context of a major California wildfire event. Note the exception of volatile syringol and 4-methylsyringol, which (unlike in Australia) did not appear closely related to the level of exposure to wildfire smoke.
The strength of correlations observed between markers, however, left the following question open: “Is testing for other markers than “free” guaiacol and 4-methylguaiacol really useful from a practical standpoint?”
After measuring volatile markers (extended panel) and glycosylated markers for more than a year, we can answer that they definitely are useful. Here are results, typical and less typical, that we have observed with 2020 and 2021 wines.
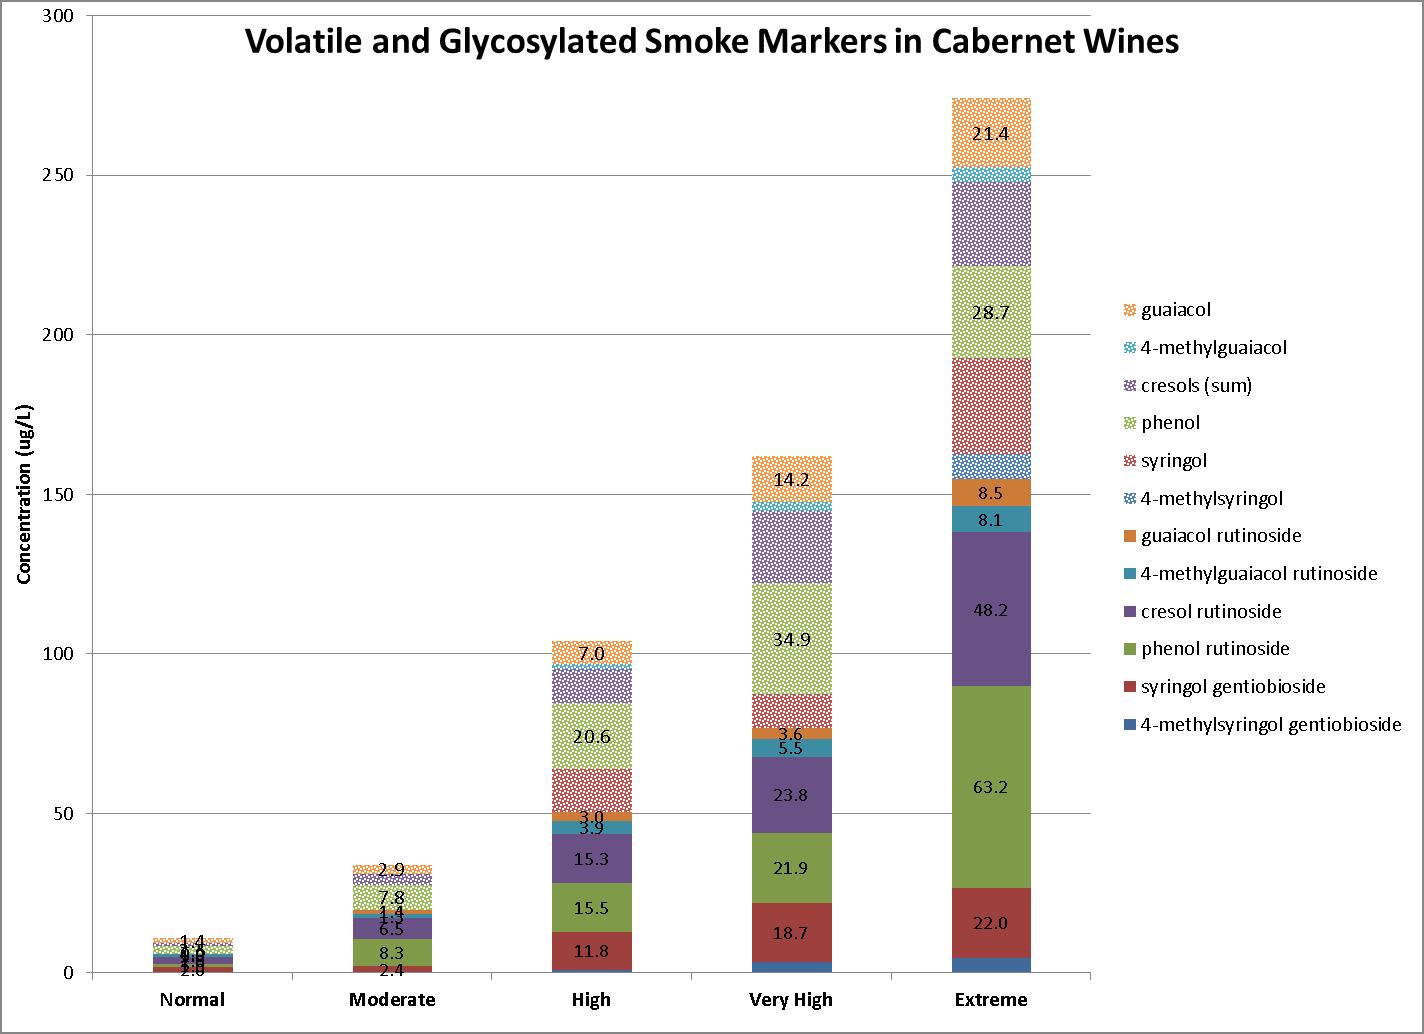
To put it simply… when volatile markers are high, expect glycosylated markers to be also high. This is illustrated figure 3, which shows a range of levels observed in Cabernet Sauvignon wines, from normal low baseline levels observed without exposure to wildfire smoke, to extreme levels resulting from severe exposure. According to our observations so far, these patterns and ranges can be expected with most red wines, while levels in white and rosé wines are generally lower due to reduced skin contact.
A notable exception is Syrah, now well known to contain naturally significant baseline levels of volatile guaiacol. With this variety however, baseline levels of other volatile markers appear to be normal, making them useful to assess smoke impact.
Another oddity is Petit Verdot, which does not appear to contain naturally unusual baseline levels of smoke markers, but seems year after year to be much more sensitive to smoke. With Petit Verdot wines, the observed range is much larger than with any other variety: we have measured volatile guaiacol exceeding 200 ug/L, and combined levels of glycosylated markers approaching 1,000 ug/L.
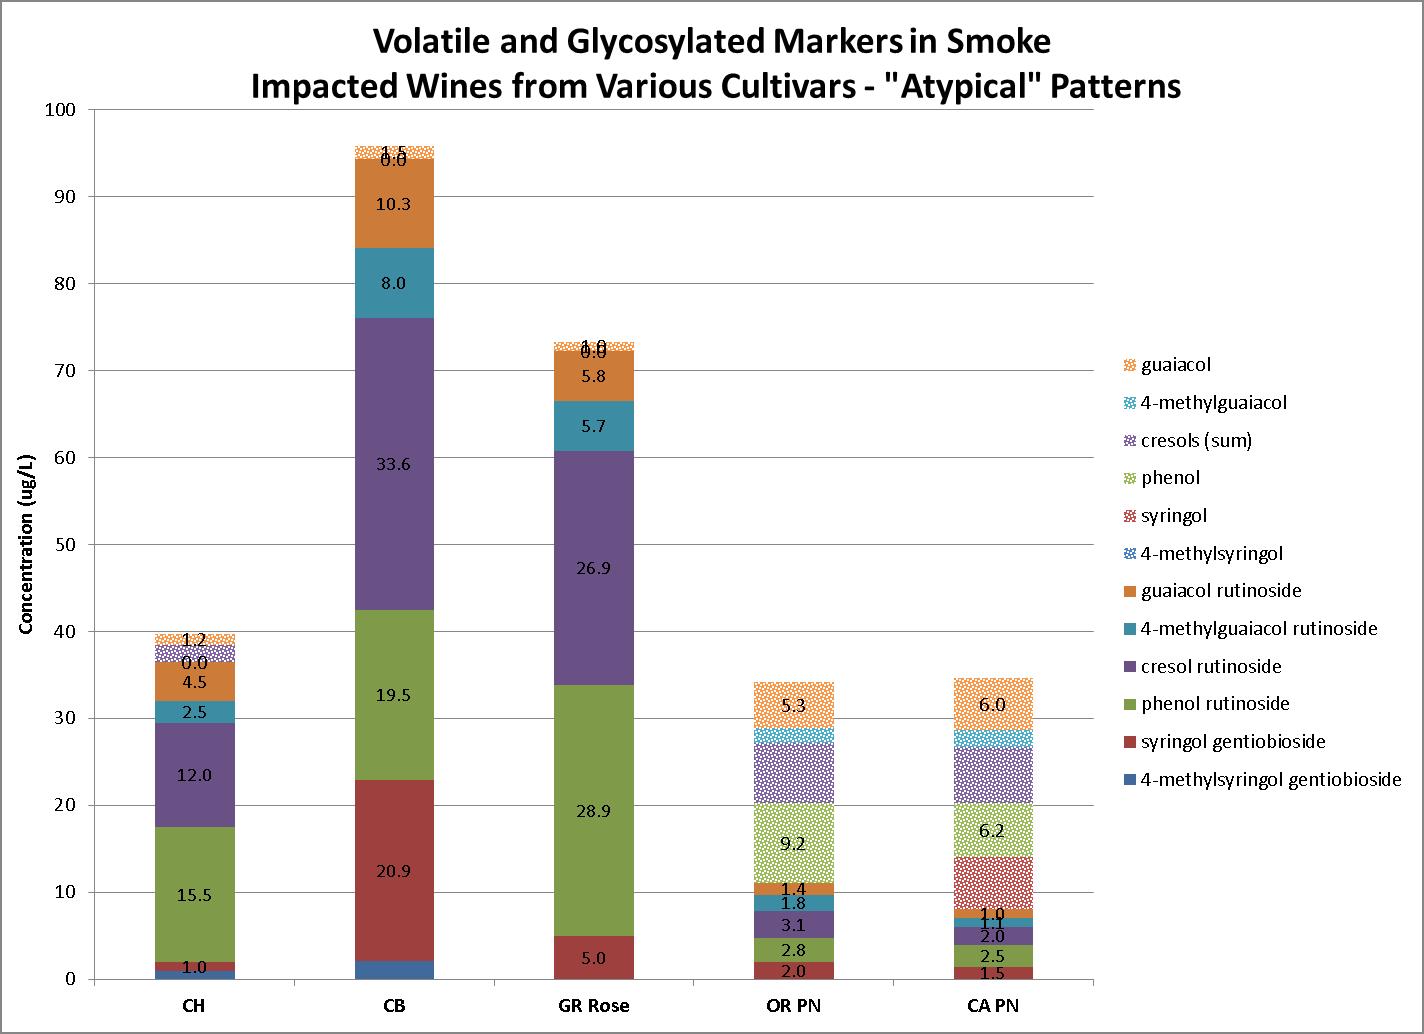
Less usual are patterns where volatile markers are relatively low, sometimes
barely suggesting smoke impact or even no smoke impact at all, cooccurring with relatively high levels of glycosylated markers. We have observed such patterns in 2021 with California Sierra Foothills grapes and wines from Rhone varieties. These patterns are particularly worrisome to winemakers, due to the fact that glycosylated (bound) smoke compounds, which are odorless, are suspected to degrade with time, releasing volatile (free) odor-active compounds. Examples of such patterns are presented figure 3- three examples on the left.
On the other hand, we have observed the opposite patterns, meaning high volatile markers but relatively low levels of glycosylated markers, with some regularity, especially with 2020 Pinot Noir wines – see figure 4 - two examples on the right. We do not know at this point if this is a recurrent occurrence with Pinot Noir, which might be observed year after year. Low levels of glycosylated markers may be caused by a weakened defense mechanism from the plant against smoke volatiles. This could be related to the severe heat wave experienced all across the Western United States in mid-August 2020, which often caused a slow or even “shut-down” metabolism with Pinot Noir grapes.
Figure
white and red wines from various grape varieties (Whites: CH = Chardonnay, CB = Chenin Blanc, Rosé: GR = Grenache, Reds: PN = Pinot Noir) displaying atypical patterns between volatile and glycosylated smoke markers. The three wines on the left have very low levels of volatile markers with high glycosylated markers, while the two wines on the right show opposite patterns.
The preferred sample for red or white grapes is a representative 200-300 loose berry sample, with berries as intact as possible. Transport in small rigid “sandwich boxes” works well – this is necessary if you are shipping samples. Avoid submitting cluster samples: the additional sample preparation time in the lab will delay results. We do not recommend submitting juice samples.
We do not recommend doing so. When we have control of the sample preparation, our interpretation guidelines are more applicable.
Since smoke compounds are mostly located in skins, we still prefer whole berry samples for white grapes. Our risk interpretation guidelines are similar for white and red grapes. Of course with white grapes, the risk of smoke characters materializing in wine can be mitigated to some degree by minimizing skin contact (with red grapes, making rosé by the direct pressing method can be a successful approach too), but in case of significant maceration with skins (e.g. following machine harvesting or intentional skin contact) the risk level may be equivalent.
Yes. We resumed offering our extended volatile (free) markers panel for wines in November 2020, and in December 2020 we offered an updated version of our glycosylated (bound) glycosylated markers panel. For the 2022 harvest, we will offer both tests for grapes, microferments, and production wines.
This is not advisable, and even prohibited for samples submitted for insurance purposes. Over the years we’ve seen drastic differences in pick-up of smoke compounds between grape varieties. For example, Petit Verdot is often much more impacted than other Bordeaux cultivars. In 2020 we saw very substantial differences in behavior between Chardonnay and Pinot Noir.
Syrah naturally contains variable amounts of guaiacol, the main smoke marker. This makes it impossible to assess smoke impact based on guaiacol only, whether with grapes or micro-ferments. The only but very imperfect strategy available so far was to use other varieties grown next to Syrah blocks as “proxies”. Now the extended volatile and glycosylated markers panels help assessing directly Syrah samples.
Some laboratories offer testing after various acid and heat treatments, in an attempt to measure “Total” or “Bound” forms in their entirety. We have reservations about such tests and do not offer them. Instead, for each of the volatile markers listed in our Expanded Panel, we can measure directly by HLPC/MS/MS its main glycosylated (sugar-bound) form (see figure 1). This is the strategy also adopted by the Australian Wine Research Institute (AWRI).
For grape samples the typical recommendation is about 10-7 days prior to harvest. Keep in mind that the impact of smoke is cumulative and that “negative” results early in the season may give a false sense of security, especially if more exposure to smoke happens. Of course with micro-ferments several days need to be accounted for after grape sampling, in order to produce fermented samples that can be analyzed.
We do not perform microferments unfortunately. For guidance, we recommend scanning the QR codes on the next page which will direct you to protocols from UC Davis, Washington State University, and the AWRI. At completion of fermentation, transfer the fermented wine into a bottle, let settle in fridge for a few hours, decant and submit sample in a 60 mL plastic tube. If a crop insurance claim is considered, check with your insurance provider if they accept microferments.
Grape samples and microferments serve two distinct purposes: helping with harvest decisions and serve as proof of smoke impact for insurance claims. Especially in the second case, it makes sense to keep backup samples, especially in the context of catastrophic wildfires.
A step-by-step procedure for smallscale fermentations (micro-ferments) is available on
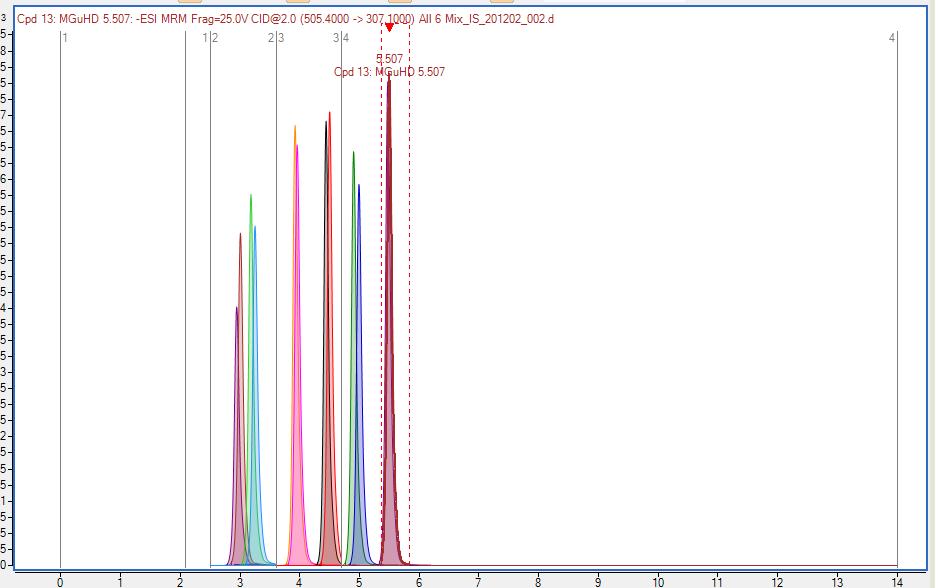
ETS finalized in 2020 its own method for the determination of glycosylated (sugarbound) smoke markers, but quantitative results had to be expressed as “equivalent” ug/L units - a strategy commonly used when exact reference compounds are not available (e.g. with tannins commonly expressed as catechin or epicatechin equivalents). Following the 2020 firestorms, ETS joined resources with the AWRI and large wineries to have pure reference compounds synthesized, so that results can now be reported as “true” concentrations (see Fig. 5). Accurate, quantitative and reproducible results (comparable over a long period of time and between different laboratories) are now achievable and a reality at ETS.


Of course. Although each fire event is unique, our interpretation guidelines based on volatile (free) guaiacol derived from our experience since 2008 have stood the test of time, and have proven to be quite robust (Fig.6). The presence of additional markers, with the extended volatiles marker panel, and the availability of a glycosylated markers panel, allow refining and confirming diagnostics. Always feel free give us a call for assistance with result interpretation.

Grapes and wines naturally contain low “baseline” levels of smoke markers, variable by grape variety and possibly by geographic origin. In most cases, we are confident that our current knowledge is adequate to help our clients with result interpretation. Best, however, is to create your own database for grapes, microferments and/or wines from grapes not exposed to significant fire events. To help implementing such programs, ETS is offering grape testing for volatile and glycosylated markers in grapes at less than cost. Please refer to the details on the next page.
Our interpretation guidelines are related to incremental risk scales, as there is no “magic number” below which no risk is present and above which wines are guaranteed to be tainted. Choosing to harvest or not will always be complex risk management decisions, loaded with painful consequences for both growers and wineries. Analytical results only help in making these difficult decisions.
For the 2022 season, we have again expanded our GC/ MS, GC/MS/MS and LC/MS/ MS analytical capabilities. Inclusive of added analytical equipment and method improvements, our current capacity is more than twice what it was entering the 2020 season. We have also solidified our partnerships with international laboratories to provide surge capacity. For the most accurate turnaround time we recommend taking a look at our website (Analyses - Smoke Markers). In case of large fire events we’ll keep our TAT information for grape, micro-ferment and wine tests prominently displayed and updated regularly.
the UC Davis Website: The AWRI protocol is found at: The WSU Nano-Scale Fermentation Protocol:INTERPRETATION GUIDELINES FOR WHOLE BERRY TESTS (EXCLUDING SYRAH):
ANTICIPATED RISK OF WILDFIRE IMPACT IN WINE

INTERPRETATION GUIDELINES FOR MICROFERMENTS AND UNOAKED WINES (AGAIN EXCLUDING SYRAH):
UNLIKELY
POSSIBLE LIKELY
THESE GUIDELINES ARE FOR GUAIACOL, NOT SUM OF TWO COMPOUNDS.GUIDELINES ARE SIMPLY OBSERVATIONS BASED UPON PAST EVENTS, AND MAY OR MAY NOT APPLY TO CURRENT OR FUTURE EVENTS.ETS DOES NOT, AND WILL NOT, PROPOSE ACCEPTANCE OR REJECTION CRITERIA
ETS Laboratories starts measuring on a large scale guaiacol and 4-methylguaiacol, two volatile (= “free”) phenols, as primary markers of smoke impact.
2008
2017
The relationship between levels of guaiacol and 4-methylguaiacol in smoke-exposed grapes and red wines, is assessed during the lateseason Wine Country fires.
2015 ETS studies the relationship between levels of primary markers in smoke-exposed grapes, microferments and production wines from multiple California AVAs, confirming their usefulness in assessing smoke impact.
Following catastrophic wildfires, ETS improves sample throughput capabilities and adds additional GC/MS and GC/MSMS units, which allows us to quadruple the number of samples we are able to run per day, to meet the needs of a fire event we hope never happen again.
2018 Following the Mendocino Complex Wildfires, an extensive study conducted by the University of California Cooperative Extension, with the participation of the Australian Wine Research Institute (AWRI) and ETS laboratories, confirms the usefulness of measuring guaiacol and 4-methylguaiacol in grapes. The relevance of additional volatile markers and glycosylated markers is also investigated.
Napa Valley Grapegrowers and ETS Laboratories partner on the Wildfire Smoke Grape Berries Baseline Project to increase scope and awareness to Napa Valley vineyards.

For more extensive assessments of smoke impact, ETS introduces an extended panel featuring secondary volatile markers, as well as a glycosylated markers panel, designed in collaboration with the Wine Institute Technical Committee, the Australian Wine Research Institute (AWRI), and several major wineries.
2021
At the end of 2021, the database contains 670 samples.
2022
Napa Valley Grapegrowers secures grant funding to help their members submit samples to the Baseline Project.
Napa Valley Grapegrowers hosts ROOTSTOCK, Dr. Eric Herve presents his findings from Baseline Database Project.
At the end of 2022 the database contains 900+ samples, establishing a solid foundation for establishing baseline ranges for all markers, in the main grape varieties.
2023
ETS recognizes a need to an extensive database clearly establishing natural “background” levels in grapes from the American West Coast.
ETS Laboratories and Napa Valley Grapegrowers invite you to participate in our growing database project, so as a community we can offer growers and buyers solid and unbiased assessments of grape exposure to smoke.
Napa Valley Grapegrowers doubles their funding with the Extension Risk Management Education Grant for Producers Underserved by Crop Insurance to support their members and help contribute samples to the Wildfire Smoke Grape Berries Baseline Project.
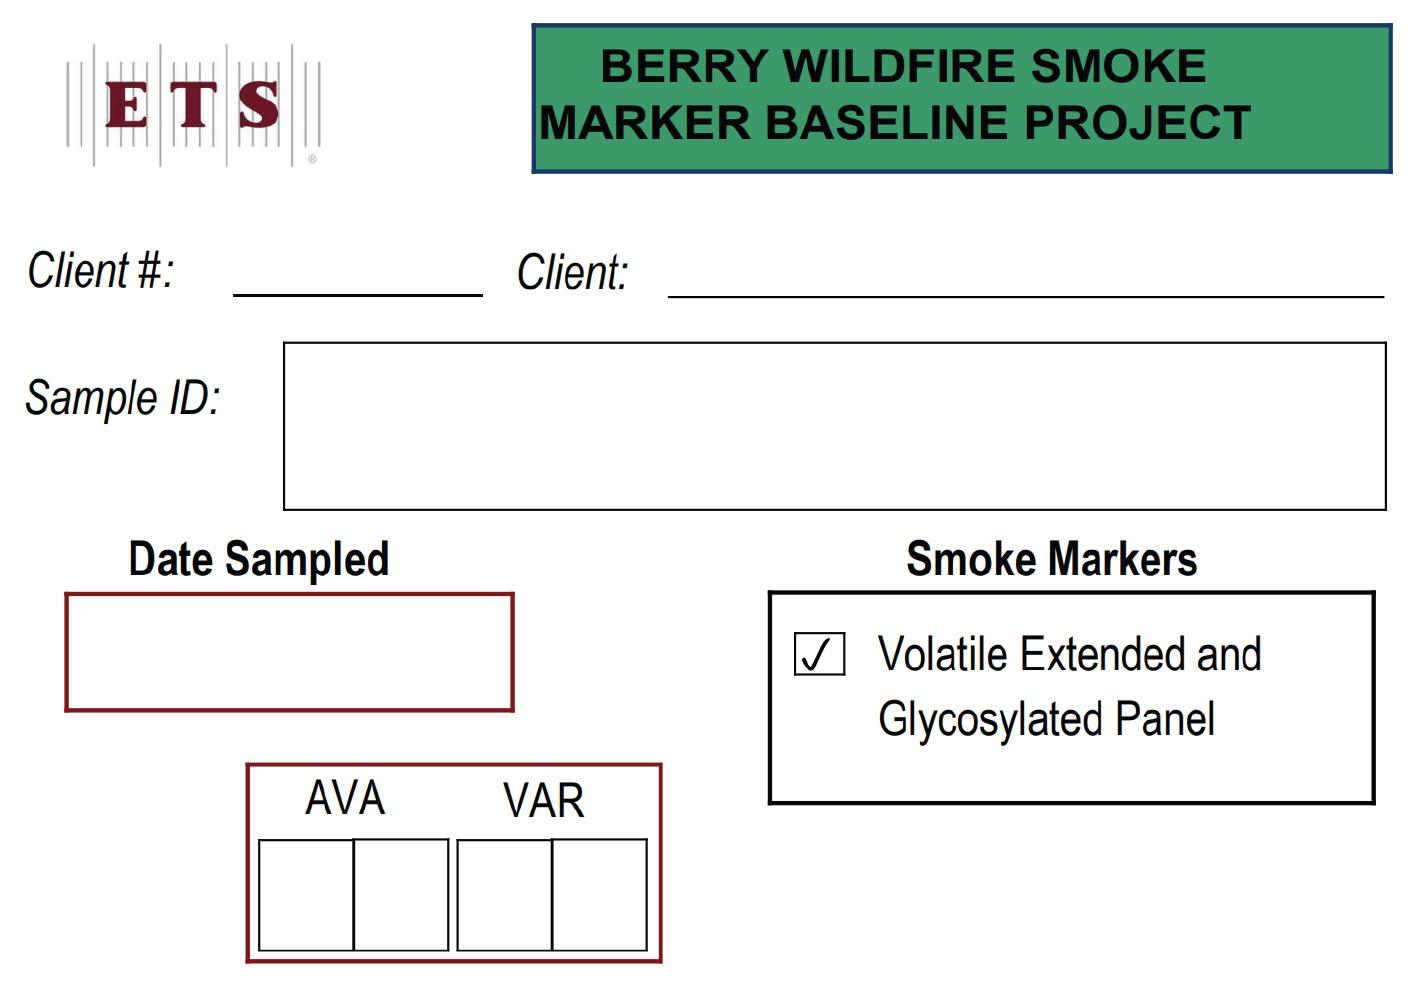
In order to put wildfire smoke impact marker analyses into context, (particularly the glycosylated markers), ETS Laboratories has been building a database of naturally occurring concentrations over the past several years. This 2023 season

offers an excellent opportunity to expand this work since major winegrowing regions have, to date, largely been spared from widespread events such as those experienced in 2020. Only with a representative and robust database inclusive of the many
• 200-250 berry representative samples taken after 18-20 brix
• Submit intact berries with minimal juicing ideally in rigid plastic containers such as disposable “sandwich boxes”
• Analysis will be performed for the extended volatile and glycosylated markers panels
• Fee per sample, only for this project, will be $365
• Each sample will be identified with date sampled, varietal, and AVA data
• Specific labels to identify samples as part of the program and to capture the required information are available directly from ETS or by client printing them from
varietal and geographic combinations possible can analytical impact data be put in true perspective.
ETS Laboratories is working to encourage sampling for this project by providing analyses at less than cost.
a template which will be made available
• Do not submit samples where any wildfire impact is suspected
• Samples for this project will be accepted until adequate quantities of data are accumulated or the first wildfire events impacting the region occur
PROJECT SPECIFIC LABELS ARE AVAILABLE AS WELL AS A TEMPLATE OF THE LABELS READY FOR THOSE WHO MAY WISH TO PRINT THEM THEMSELVES.
The ETS Grape Maturity Monitoring Panels provide a set of analyses that growers and winemakers request to monitor fruit maturity, including Brix, Glucose + Fructose, TA, pH and malic acid, as well as berry size parameters and average sugar per berry. Monitoring sugar per berry allows growers to determine the duration and rate of active sugar loading, during which vines synthesize and actively transport sugar into berries. The time at which the sugar loading phase ends, and what level of Brix was achieved at that time, are both important indicators of wine growing conditions (excessive or insufficient vigor, water availability and resistance to heat stress).
For more details see pg. 1
Follow changes in grape phenolics during ripening, using the catechin and tannin "ripeness" index to monitor seed ripening, and quercetin analysis to monitor canopy effects on grape phenolics.
For more details see pg. 45
Wild yeast and bacteria from the vineyard may be introduced into the winery on the harvested fruit, causing spontaneous fermentation and/or spoilage. ScorpionsTM DNA analysis offers winemakers an early detection tool to identify these spoilage organisms.
Despite the best practice of modern winemaking methods, microbial contamination often occurs during wine production. Spoilage microbes are capable of survival and growth in the wine, potentially producing offflavors, off aromas, and turbidity. Microbiological contamination is often undetected until related problems in the wine become noticeable by sensory evaluation.
Scorpions™ assays, based on specific genetic targets, detect the full range of wine and juice spoilage organisms. This genetic analysis method detects microbial populations directly in wine or juice. Results are routinely reported within two business days, giving winemakers the ability to address problems before wine defects occur.
Targeted genetic probes give the winemaker the ability to monitor only those specific spoilage organisms that have the potential to adversely impact wine quality, and to accurately measure populations down to extremely low levels.
For more details see pg. 33
Changes in grape water content influence finished wine composition and can be as important as standard sugar and acid measurements when making picking decisions. Grape water content is also very useful for understanding changes in TA, pH, ºBrix, and other harvest indicators.
Our most popular harvest panel offers a full range of grape and must analyses, combining more than 10 tests including fermentable sugar (to help estimate alcohol content) and YAN (yeast-assimilable nitrogen — to help predict sluggish or stuck fermentation and potential sulfide formation.)
For more details see pg. 3
Glutathione, a natural grape antioxidant, can protect the aroma and flavor of white and rosé wines and prevent premature aging. Glutathione levels fluctuate during production, as the compound can be absorbed by yeast and then released after fermentation.
For more details see pg. 50
Eucalyptus character is a controversial sensory expression in red wines from California and countries with Mediterranean climates. Even a slight “eucalyptus” note can interfere with delicate varietal aromas, and can have a detrimental influence on certain grape varieties.
For more details see pg. 49
Our automated method reports yeast viability and total cell count back to the client within hours, and the real-time microscopic flow image analysis examines 1,000 times the volume used in standard microscopic methods, vastly increasing the accuracy of your results.
The compounds in wildfire smoke are absorbed by vines and can cause unwanted flavors in wine. Analyzing for these compounds allows winemakers to screen grapes for the risk of smoke impact and work to mitigate its effects.
For more details see pg. 51
This comprehensive test panel checks grapes for Botrytis (using ScorpionsTM ) and laccase, detecting both the spoilage organism and its byproducts that can harm your wine.
By the end of maceration or fermentation, the tannin content of a wine is already fixed. Monitoring phenolics during this critical period allows winemakers to better control tannins by increasing or decreasing phenolic extraction.
For more details see pg. 47
The compound responsible for a "green bell pepper" aroma in wine, IBMP, decreases quickly during maturation. But once grapes are picked, it is hard to control. Monitoring changes in grape IBMP directly influences final levels in wine, and is crucial in making picking decisions.
For more details see pg. 50
Laccase is a polyphenol oxidase associated with rot caused by Botrytis. Elevated levels of laccase can result in oxidation of phenolic compounds that may cause color degradation or premature browning in red wines. In addition, laccase mediated oxidation can also affect the aroma profile of the wine.
ETS Laboratories offers DNA fingerprinting to distinguish between closely related strains of Saccharomyces cerevisiae. ETS MLVA technology allows winemakers to monitor yeast population in native fermentations and check the efficiency of inoculations with commercial strains.
SINCE WE FIRST OPENED OUR DOORS IN ST. HELENA IN 1978, WE’VE GROWN ALONGSIDE THE WINE INDUSTRY, PARTNERING WITH OUR CLIENTS AS THEY’VE GONE ON TO CREATE MANY OF THE WORLD’S FINEST WINES. WE’RE CONTINUING TO INVEST NOT ONLY IN NAPA VALLEY, BUT ALSO IN OTHER RAPIDLY GROWING WINE REGIONS BY EXPANDING OUR LOCAL AND ONLINE SERVICES TO SUPPORT WINEMAKERS WITH ADVANCED TOOLS AND TECHNICAL ASSISTANCE.
HERE’S WHAT TO TAKE ADVANTAGE OF IN HARVEST 2023:
Samples can be dropped off locally for any analysis ETS offers. These common harvest analyses will be run onsite for quicker turnaround.

It’s important to collect and handle harvest samples carefully to ensure accurate and representative results. We’ve collected our recommendations to help you get the most out of your harvest analyses.
Most harvest samples received at ETS come to the laboratory as juice.
Berries pressed for a juice sample should be selected from at least 20-40 different clusters, and can easily be pressed by hand in their collection bag – pour the juice into a standard ETS 60mL sample tube and label with your ETS client labels. Samples should be kept cool to prevent fermentation.
Take 200-400 berries per block. Pick berries from random clusters on both sides of the row. Take berries from the top and bottom of both the front and back of each cluster.
*Samples submitted for berry analysis should contain only intact and undamaged fruit.
For grape phenolic testing, a representative sample is critical to obtain accurate results, especially in varietals with tight clusters. Samples for the Grape Phenolic Panel should include berries from at least 20-40 different clusters. Clusters can be collected either from harvest containers or directly from the vineyard.
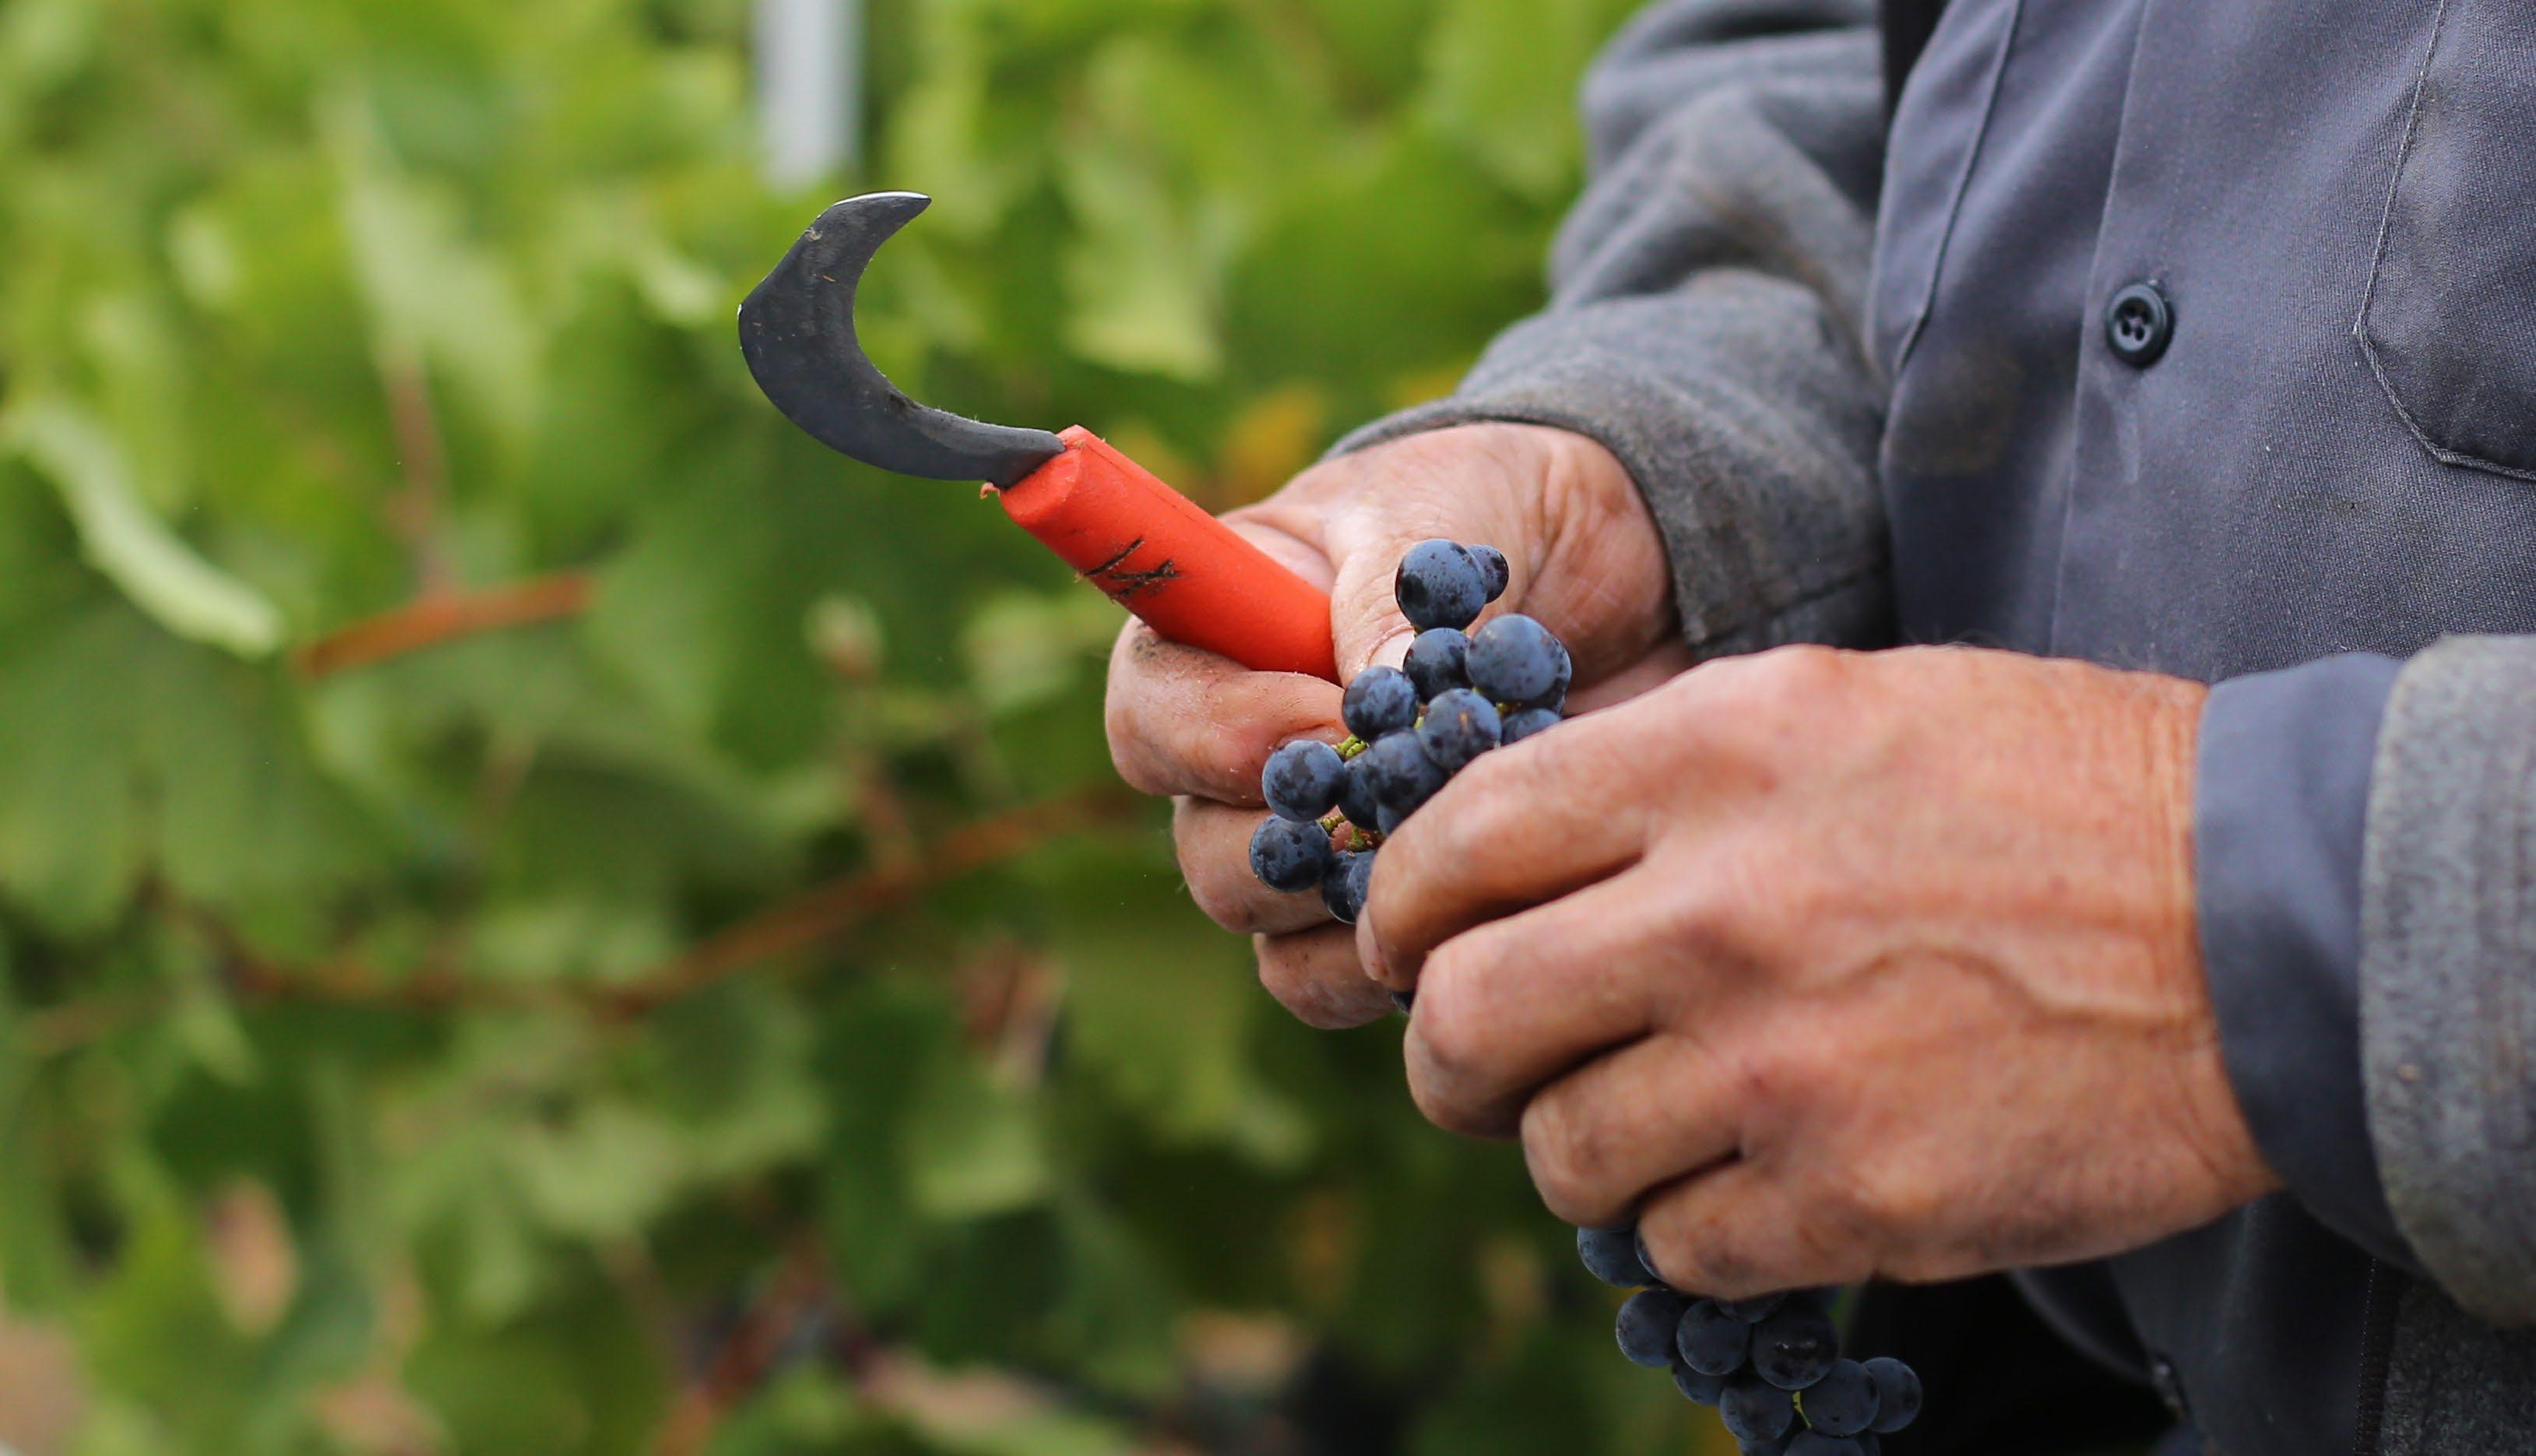
To get a representative sample, all the berries must be stripped from the clusters and mixed before bagging a 300-400 berry sample for analysis (about 500g or 16 oz).
Samples should contain only intact and undamaged fruit to ensure accurate results.
We encourage clients to submit berry samples rather than whole clusters. If samples are submitted as clusters, ETS will prepare a berry sample for an additional fee.
Each bag of berries should be clearly labeled with the client name, sample ID, and analyses to be performed.
ETS provides free sample labels that are pre-printed and barcoded with your client ID – visit our website, or give us a call.
Don’t get caught empty handed – order complimentary tubes, pre-printed labels, and shipping pods to take the headache out of collecting and shipping samples.
1. Login to your ETS account and select the winery you're ordering supplies for.

Outside the range of our sample pickup service?
ETS offers free shipping kits, which include an insulated envelope and an ice pack, to help you easily send in samples no matter where you're located.
To prevent problems from fermentation, juice samples should be frozen or boiled for shipment, and clearly marked as either “FROZEN” or “BOILED” depending on the treatment used.

2. Use the "Get Supplies" button on the dashboard to place a supply order.

Boil samples with a loosely fitting cap to prevent evaporation and concentration. Do not over-boil.
Freeze the sample in a plastic ETS sample tube. Do not over-fill the tube – leave a small space for the sample to expand when frozen.
Never freeze samples in glass containers to prevent breakage and injury.
To ensure accurate results, it's important to avoid damaging DNA or killing yeast and bacteria:
° Keep samples cool with ice packs.
° Ship by overnight delivery using a parcel carrier like FedEx, UPS, or GSO.
Scorpions samples should not be frozen or boiled.
IN ADDITION TO OUR ST. HELENA HEADQUARTERS, WE OPERATE SATELLITE LABORATORIES ACROSS THE WEST COAST TO BRING ADVANCED TOOLS TO WINEMAKERS' DOORSTEPS AND PROVIDE LOCAL SUPPORT TO OTHER GROWING WINE REGIONS.
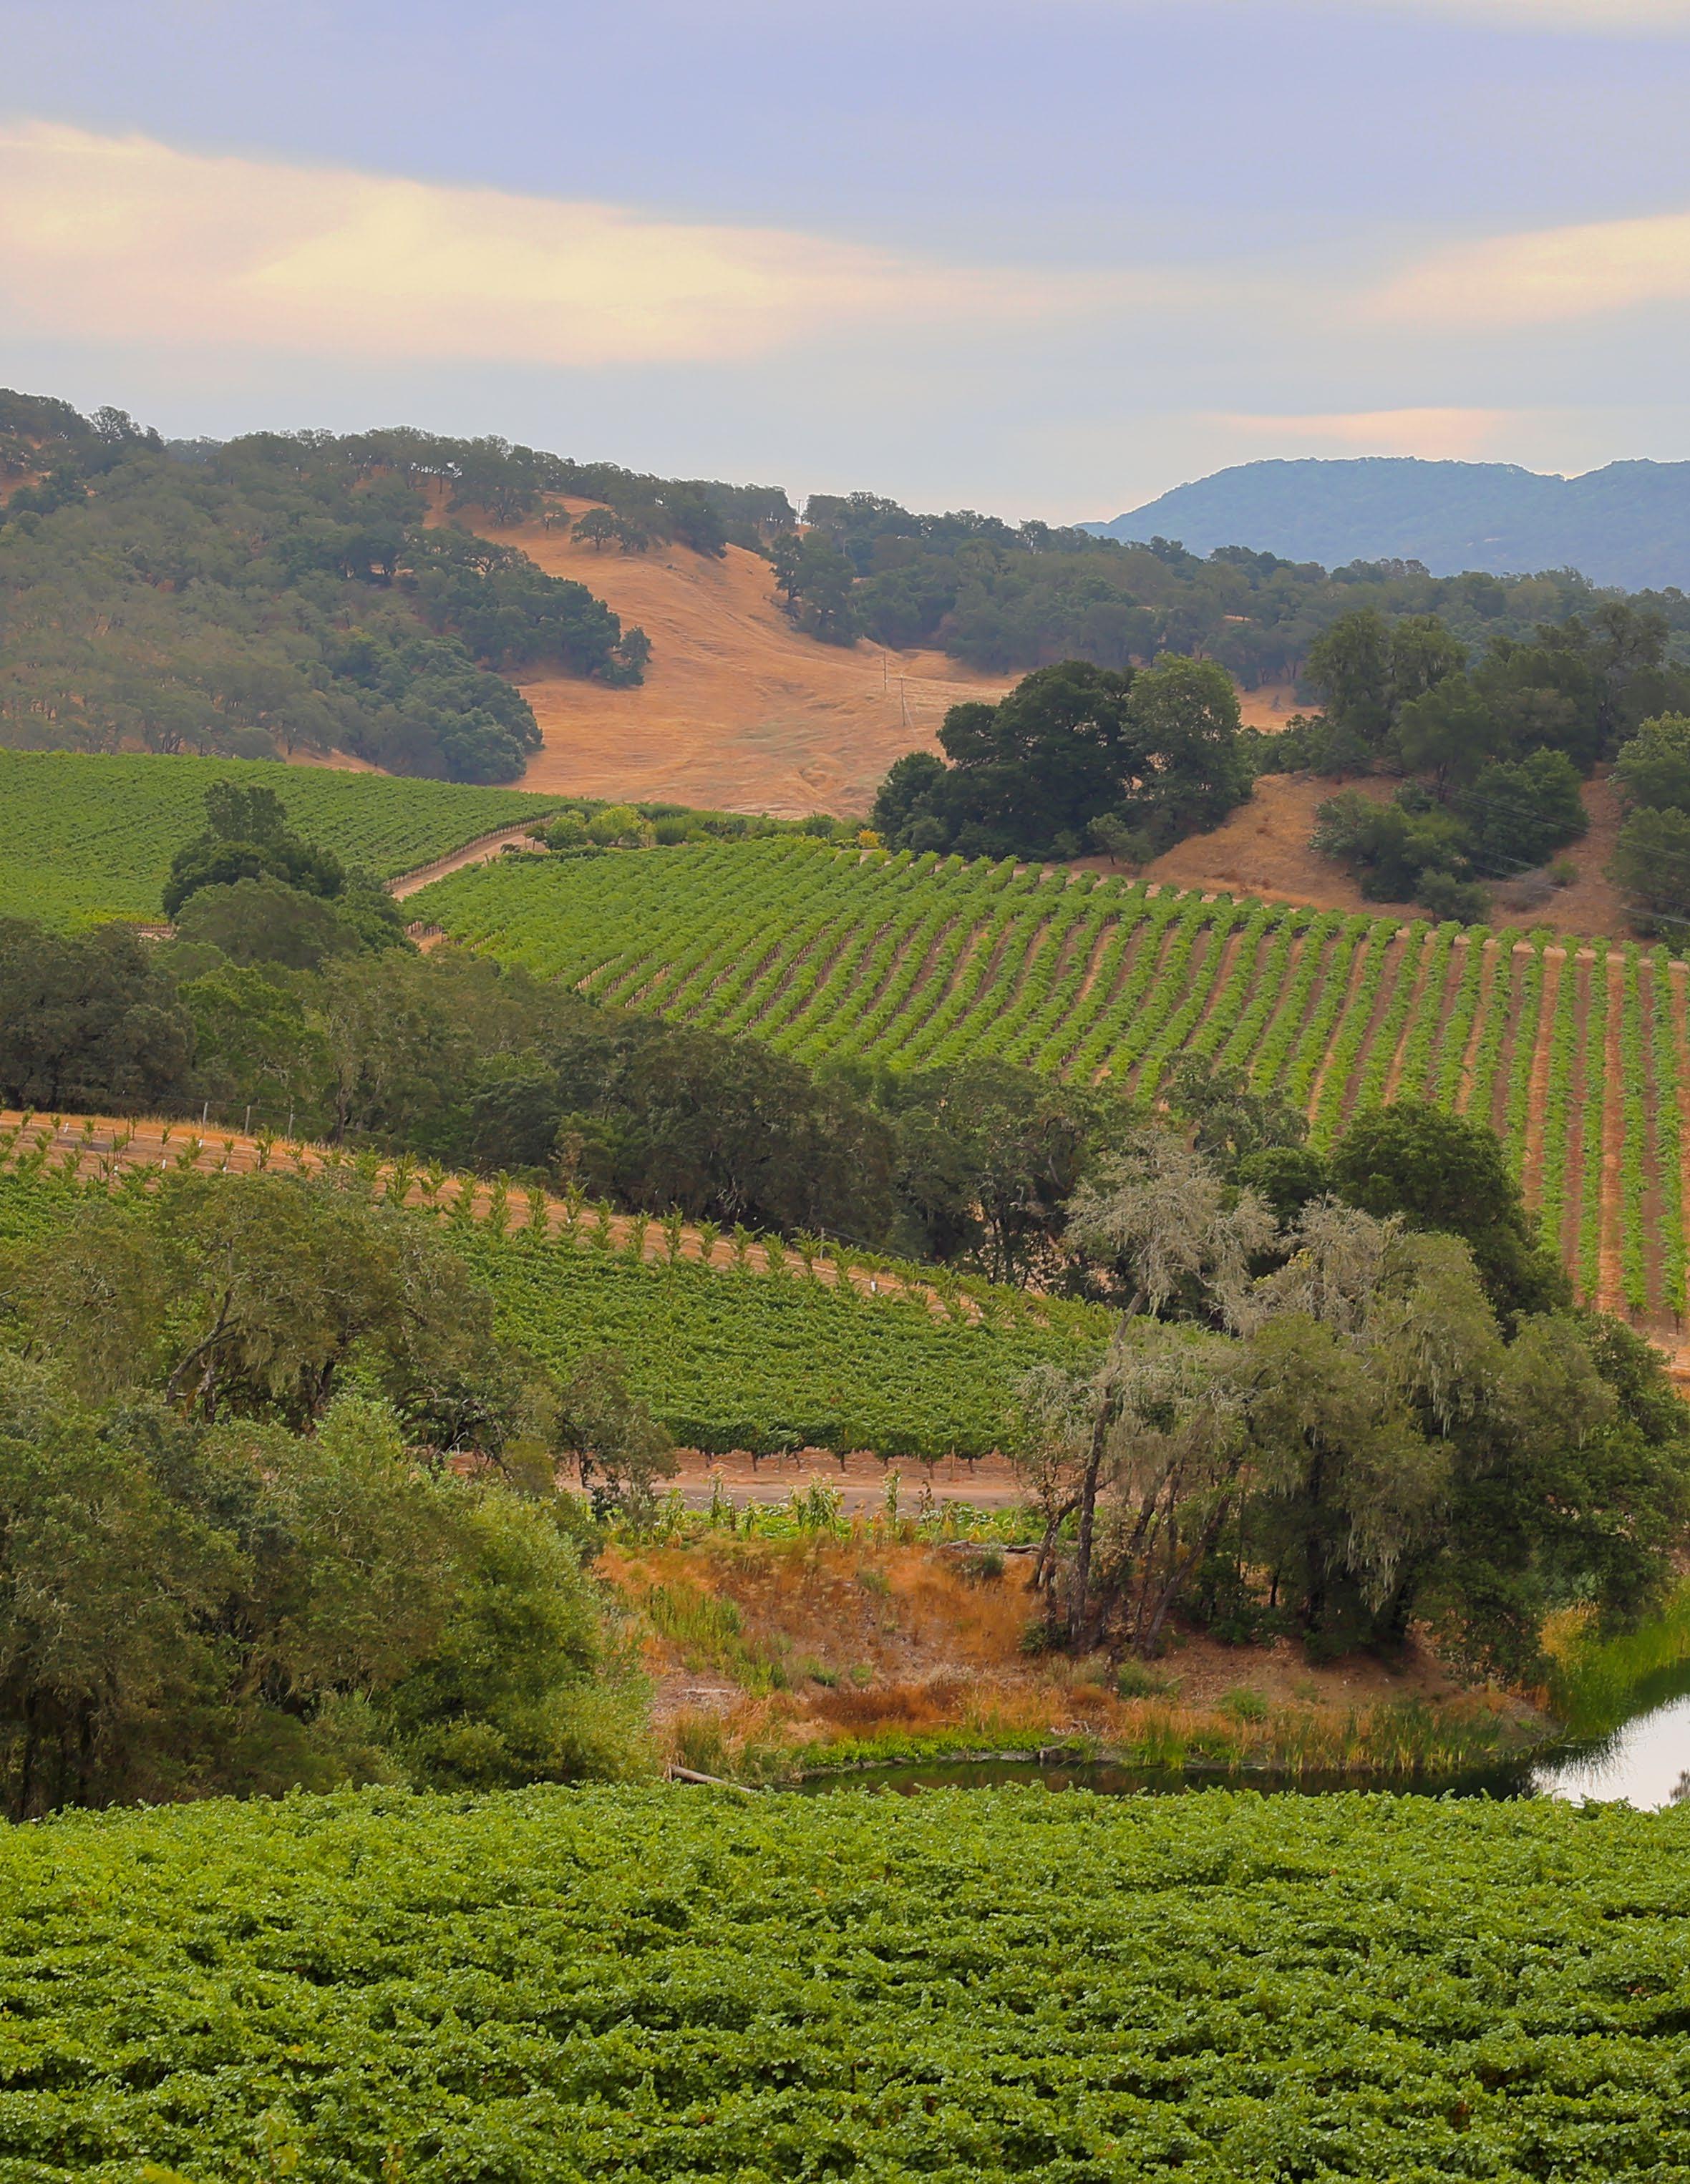
THESE QUICK GUIDES PROVIDE A REFERENCE FOR THE 2023 HARVEST, INCLUDING WEEKEND HOURS AND CONVENIENT SERVICES TO MAKE IT EASIER THAN EVER TO SEND IN HARVEST SAMPLES, INCLUDING DROPBOX LOCATIONS AND COMPLIMENTARY COURIER SERVICE.
AS ALWAYS, IF YOU HAVE ANY QUESTIONS, JUST CALL YOUR LOCAL LAB AND WE'LL BE HAPPY TO HELP.
PHONE
(707) 963-4806
SHIPPING ADDRESS
899 Adams Street, Suite A St. Helena, CA 94574
AFTER HOURS DROPBOX COURIER SERVICE
ST. HELENA
Located at our laboratory, next to the main entrance. Samples left overnight will be processed when we open the following business day.
Our complimentary courier service is available in Napa, Sonoma, and Mendocino counties every day ETS is open.
REQUEST A PICKUP
You can request a courier pickup by logging in to your ETS account, or by calling our lab.
DEADLINE
HOURS
Every Harvest ETS offers extended and weekend hours. Our team is on-call to meet your needs.
Please check the ETS Website for our most up-to-date business hours.
DROPBOX IS LOCKED FOR THE PIN CODE, CALL US, OR LOG IN TO YOUR ETS ACCOUNT AND VISIT “CONTACT”

Please request a pickup by 10 am This allows us to ensure speedy turnaround on time-critical harvest analyses.
For the most up-to-date dropbox hours and pick up times please check our website: www.etslabs.com/contact.
LODI DROPBOX ESTATE CRUSH
SOUTH NAPA DROPBOX RUTHERFORD EQUIPMENT
To schedule on-call service, please call by 2pm on Friday: (707) 963-4806
2 W. Lockeford Street Lodi, CA THE DROPBOX IS AVAILABLE WHEN
PHONE (707) 433-7051
ADDRESS
190 Foss Creek Circle, Suite G Healdsburg, CA 95448
IF YOU NEED TO SHIP SAMPLES, PLEASE SEND THEM DIRECTLY TO OUR ST. HELENA LAB: 899 ADAMS STREET, SUITE A ST. HELENA, CA 94574
HOURS
Every Harvest ETS offers extended and weekend hours. Our team is on-call to meet your needs.
Please check the ETS Website for our most up-to-date business hours.
DROPBOX LOCATIONS
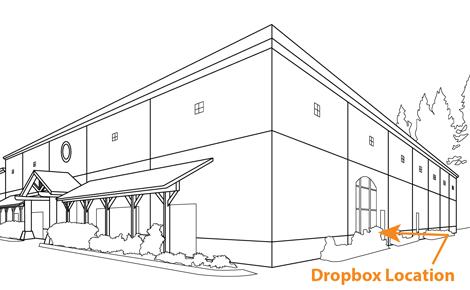
AFTER HOURS DROPBOX
HEALDSBURG
Located at our laboratory, on the north side of the building.
Samples left overnight will be processed when we open the following business day.
COURIER SERVICE
Our complimentary courier service is available in Napa, Sonoma, and Mendocino counties every day ETS is open.
REQUEST A PICKUP
You can request a courier pickup by logging in to your ETS account, or by calling our lab.
DEADLINE
Please request a pickup by 10 am This allows us to ensure speedy turnaround on time-critical harvest analyses.
DROPBOX IS LOCKED. FOR THE PIN CODE, CALL US, OR LOG IN TO YOUR ETS ACCOUNT AND VISIT “CONTACT”
COUNTY
7795 Bell Rd, Windsor, CA 95492
• SAMPLES WILL BE ACCEPTED AT ENARTIS AND WILL BE TAKEN TO ETS LABORATORIES FOR TESTING.
• PLEASE LEAVE SAMPLES BY 11 AM FOR SAME-DAY SERVICE
To schedule on-call service, please call by 2pm on Friday: (707) 963-4806
3320 Ramada Drive, Suite B Paso Robles, CA 93446
Located at our laboratory, next to the front door.
Samples left overnight will be processed when we open the following business day.
We're excited to offer complimentary courier service this September for our clients in the Central Coast.
REQUEST A PICKUP
You can request a courier pickup by logging in to your ETS account, or by calling our Paso Robles lab.
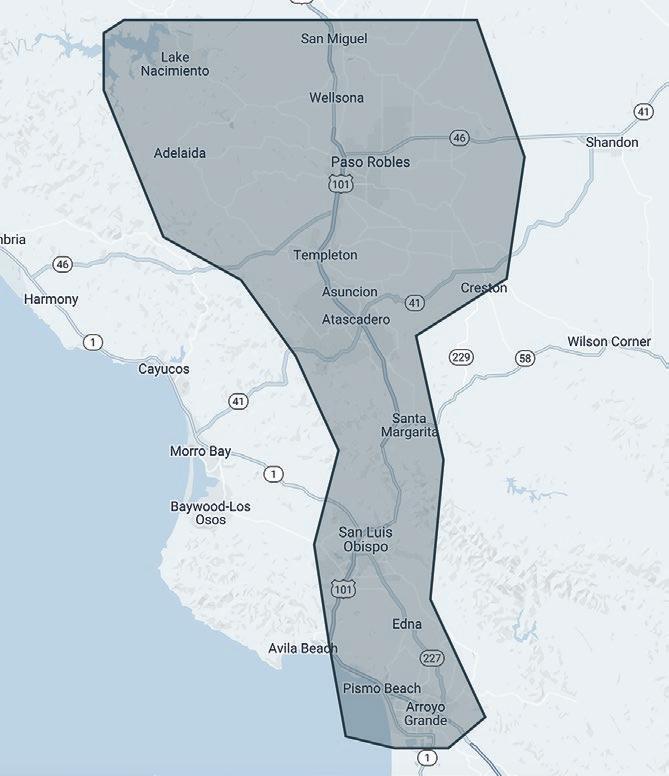
DEADLINE
Please request a pickup by 10 am. This allows us to ensure speedy turnaround on time-critical harvest analyses.
Every Harvest ETS offers extended and weekend hours. Our team is on-call to meet your needs.
Please check the ETS Website for our most up-to-date business hours.
DROPBOX LOCATIONS
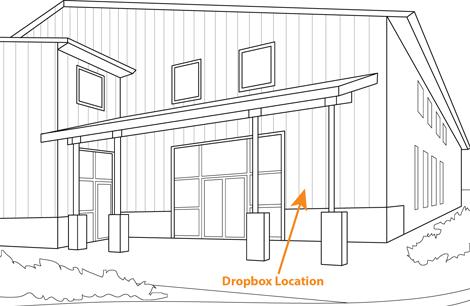
CENTRAL COAST WINE SERVICES
2717 Aviation Way #101, Santa Maria, CA 93455
STOLPMAN VINEYARDS
1700 Industrial Way, Lompoc, CA 93436
To schedule on-call service, please call by 2pm on Friday: (707) 963-4806
90 Easy St, Buellton, CA 93427
SERVICE AREA
We're currently picking up samples in the Paso Robles and SLO areas. We will continue to expand as demand growsplease let us know if you'd like service.
PHONE (503) 537-6245
ADDRESS
214 W. Hancock Street
Newberg, OR 97132
IF YOU NEED TO SHIP SAMPLES, PLEASE SEND THEM DIRECTLY TO OUR ST. HELENA LAB: 899 ADAMS STREET, SUITE A ST. HELENA, CA 94574
HOURS
Every Harvest ETS offers extended and weekend hours. Our team is on-call to meet your needs.
Please check the ETS Website for our most up-to-date business hours.
AFTER HOURS DROPBOX COURIER SERVICE
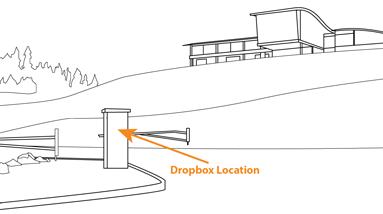
NEWBERG
Located at our laboratory, next to the main entrance.
Samples left overnight will be processed when we open the following business day.
Our complimentary courier service is available in Salem, McMinnville, Newberg, and the surrounding areas every day ETS is scheduled to be open.
REQUEST A PICKUP
You can request a courier pickup by logging in to your ETS account, or by calling our lab.
DEADLINE
Please request a pickup by 10 am This allows us to ensure speedy turnaround on time-critical harvest analyses.
DROPBOX IS LOCKED. FOR THE PIN CODE, CALL US, OR LOG IN TO YOUR ETS ACCOUNT AND VISIT “CONTACT”
ROSEBURG DROPBOX UMPQUA COMMUNITY COLLEGE
PICKUP TIME
Samples collected at 11:30 Monday –Thursday.
Anything dropped off after 11:30am will be processed with the next pickup.
To schedule on-call service, please call by 2pm on Friday: (707) 963-4806
912 Umpqua College Rd. Roseburg, OR
HOURS
Every Harvest ETS offers extended and weekend hours. Our team is on-call to meet your needs.
Please check the ETS Website for our most up-to-date business hours.

AFTER HOURS DROPBOX
WALLA WALLA
Located at our laboratory, next to the main entrance.
Samples left overnight will be processed when we open the following business day.
Our complimentary courier service is available in Walla Walla and the surrounding areas every day ETS is scheduled to be open.
You can request a courier pickup by logging in to your ETS account, or by calling our lab.
DEADLINE
Please request a pickup by 10 am This allows us to ensure speedy turnaround on time-critical harvest analyses.
To schedule on-call service, please call by 2pm on Friday: (707) 963-4806
IF YOU NEED TO SHIP SAMPLES, PLEASE SEND THEM DIRECTLY TO OUR ST. HELENA LAB: 899 ADAMS STREET, SUITE A ST. HELENA, CA 94574 PICKUP