2 minute read
1.11 Development of a Test Stand for Measuring of Thermal Conductivity
Next Article

Nowadays, computer simulations of heat and material flows are essential in the development of thermally systems. Crucial for its accuracy are the material parameters used therein. Especially thermal conductivities for the description of heat conduction phenomena are often only roughly known and only at room temperature. Therefore, we are developing a test rig that measures thermal conductivity of solids and composite structures over a large T-range.
Contributors: Partner(s): Funding: Duration: S. Ehrat, T. Hocker ZHAW-IMPE Team D. Penner & Team C. Brändli, Georg Fischer Piping Systems Innosuisse 2018–2021
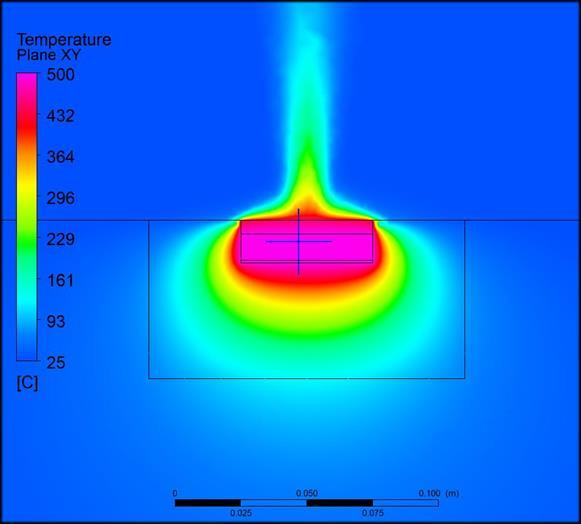
Heat conduction phenomena play an important role in our R&D projects. The computer models used to optimize such systems are limited in their validity and accuracy by the thermal conductivities used in the model. The latter usually show a strong temperature dependence and depends on the porosity of microstructure materials. Further uncertainties result from thermal contact resistances between different material layers, which can only be determined by thermal conduction measurements of the entire composite arrangement. For these reasons, we have decided to develop a test rig for determining the thermal conductivity of solids. in blue, copper block in red, heating foil in brown, as well as thermocouples (green, white) and first insulation layer (transparent). Figure 1 shows the simple structure of the planned test bench. The sample (blue) is brought to the desired temperature by means of a heated copper block (red) and kept there. With the measured temperature difference between the top and bottom side of the sample in the stationary state, as well as the known heating power and the sample thickness, the thermal conductivity of the sample can be calculated. The temperatures on the bottom side of the sample are measured by type K thermocouples, while a thermal camera is mounted on the top side for temperature measurement. In order to extract Tvalues from the thermal images as accurately as possible, the emissivity of the investigated samples must also be determined. An electrical resistance heater is embedded in a MICA foil (brown), which can reach temperatures up to 500 °C. CFD simulations have been used for the design of the thermal insulation. The optimal solution is a composite arrangement of different insulation materials. The first insulation layer is a nanoporous insulation layer based on silicon dioxide. This insulation is followed by a layer of rock wool and a final XPS insulation board. Figure 2 shows the stationary temperature distribution of this arrangement. In the centre of the picture the heated copper block and the above placed sample can be seen. These components are surrounded by the nanoporous insulation. This insulation layer is only 3 cm thick, but reduces the temperature by 300-400 °C. The top side is open to the environment and therefore air-cooled. This can be seen in the figure by means of the hot air rises by
Fig. 1: CAD representation of the test stand with sample material
natural convection.
Environment
Insulation
Fig. 2: CFD simulation of the temperature distribution in the test stand. The highest temperatures prevail in the heated copper block (violet). Furthermore, the effect of natural convection in the ambient air above the sample can be seen.
