23 minute read
Concentration of microplastics found in sediment from ocean beaches compared to estuarine beaches in Sydney

Olivia Marlin
Barker College
Purpose: This paper aims to seek data on the variance in concentration of microplastics between Sydney's ocean and estuarine environments, indicating areas of a notable concern. Design/methodology/approach: Twenty-four sediment samples were collected from six beaches (three ocean, and three estuarine), and methodologies of density separation and extraction were employed, before conducting a quantitative analysis. Findings: No evidence of microplastics were identified in this investigation. This was likely due to problems with the methodology adopted. A range of possible errors encountered were explored, as well as four other methodologies that could be used as alternatives for those used in this paper. Each of the alternate methods were evaluated based on the criteria of being suitable for research in schools. Research Limitations/implications: The methods used were not successful in isolating microplastics from the sand samples collected. Practical implications: The review of methods for quantifying microplastics that are suitable for use in schools will increase the chance of successful research by students in this area. Individuals will be able to select an appropriate methodology with a comprehensive understanding of its requirements, reducing the chances of encountering methodological errors. Social Implications: Incorporating a review of methods enables further student and citizen research projects to be successfully undertaken to explore the prevalence of microplastics in sand. Originality/value: To the author's knowledge, this paper is the first to review a range of methodologies suitable for school research into the prevalence of microplastics in the environment. Paper Type: Research Paper
Literature Review
Microplastics are small plastic particles less than 5 mm in size. They originate from microbeads commonly used in cosmetic products and microfibres shed from textiles, as well as larger plastic items that have been broken down in size over time, this includes the degradation of single use plastic straws and takeaway containers (Jiang, 2018). Microplastics enter waterways in a variety of ways including human littering, water run-off, wind, wastewater, fishing, and shipping activity. Not only is this an issue due to the growing popularity of plastic products, but more so due to the harm that plastics can cause to marine life and ecosystems. The small size and bright colours of microplastics are appealing to fish causing ingestion (Jovanović, 2017). Numerous additives are added to plastic polymers, such as flame-retardants, stabilisers and lubricants which cause direct harm to sea life upon digestion and these are further passed on through the food chain, creating issues for entire ecosystems. It has been found that microplastics sorb chemical pollutants that are present in surrounding water, thus creating enhanced toxicity for fish due to them bioaccumulating these pollutants, putting stress on the liver (Rochman et al., 2013). It is also suggested that consuming an organism that has ingested microplastic may be harmful as the toxic chemicals have been preabsorbed into the organism, indicating that human consumption of fish may also be dangerous (Jovanović, 2017). The existence of microplastics in the food web has been established, but scientists are yet to fully understand what the human health risks will be in the long term.
It is clear microplastics predominantly originate near the coast and remain in a similar area for a long time (Zhang, 2017). In Australia, a current citizen science project has found the presence of microplastic pollution on Australian coastal beaches and harbour side beaches, and early results have shown that Sydney harbour locations have moderate to high levels of microplastics, with some Sydney ocean beaches having lower levels (Wilson, 2022). Influxes of plastic in river systems are a major input of microplastics into marine systems, and rivers have been found to be ‘hotspots’ with a large amount of microplastics found in sediment (Windsor, 2019). A study in China that took samples from both semienclosed bays and open coastal zones supported this
theory as the bays had a greater accumulation of microplastics due to the minimal currents and surrounding topography trapping the microplastics (Sun et al., 2021). On the contrary, a study in Oahu, Hawaii suggested that beaches with higher waves have a greater accumulation of microplastics (Rey et al., 2021). The study concluded that microplastics travel through the ocean, and wave energy increases microplastic density on the shoreline.
Due to Australia having a wide-reaching coastline, we are particularly vulnerable to the accumulation of microplastics in both estuarine and ocean environments. A citizen science project conducted across more than 300 beaches Australia wide, has determined that there were over 3 million microplastic fragments found when collecting as part of the Australian Microplastic Assessment Project (Wilson, 2022). It was discovered that, within Sydney, the largest microplastic ‘hotspot’, was Manly Cove, with 4051 microplastics per m2 (“Hotspot Map,” 2015). This poses unease for Sydneysiders, as only a small number of Sydney beaches have been investigated as of present, but those that have, are of notable concern.
Scientific Research Question
Is the quantity of microplastics found in sediment samples in the Sydney region, higher on the shorelines of ocean or estuarine beaches?
Scientific Hypothesis
Sediment samples taken from estuarine beaches in Sydney will have a larger concentration of microplastics, compared to sand samples taken from Sydney’s ocean beaches.
Methodology
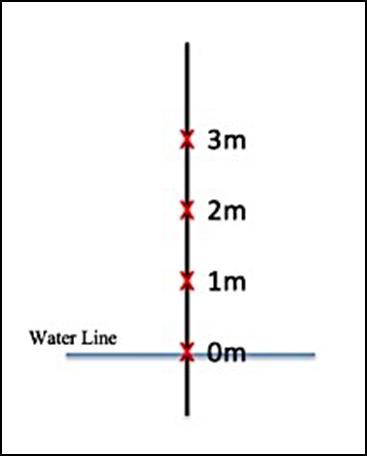
The sampling method for this experiment was to take 4 sediment samples from 6 separate locations (24 samples total), which are identified in Figure 1. At each location the first sample, ‘0’, was taken at the water line, then another was taken 1 metre towards drier sand, followed by samples at 2 and 3 metres, represented in Figure 2. Each sample container was labelled with the corresponding location number (16), as well as metres from the water (0-3) where the sediment was sampled (e.g. 1.0, 1.1, 1.2, 1.3, 2.0 and so on).
Figure 1: Map of Sydney beaches where samples were collected
Figure 2: Transect line indicating sample collection points
The sand was dried as comparisons of dry mass is much easier, given the varying water content of sand at different distances from the shoreline. 24 glass petri dishes were labelled using the same system as above and laid flat onto large metal trays (see Figure 3). Approximately 25 g of each sample was placed into a petri-dish and enough sand was left in the original container to repeat the process later if needed. The samples were placed into an oven at 70oC and were found to be completely dry after 5 hours. Clean sampling containers were labelled using the
aforementioned system and the dry samples were individually funnelled into clean containers using a new paper funnel for every sample.
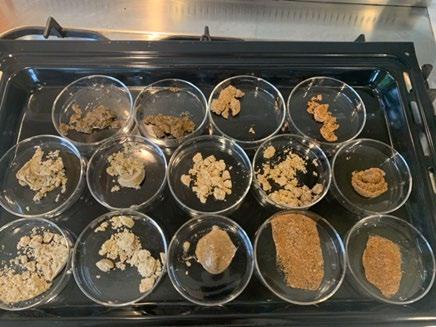
Figure 3: Setup of sand samples for drying – before oven
Floatation was used to extract the microplastics, following the method of (Prata et al., 2019). This entailed creating a saline solution, which used approximately 190 g of NaCl and 500 mL of H2O to create a saturated solution. Most plastics have a density of 0.90 g/cm3 and a saturated saline solution has a density of 1.202 g/cm3, allowing potential microplastics to float (Hidalgo-Ruz et al., 2012). The solution was heated in a glass jar until boiling, while simultaneously being stirred. All possible NaCl was dissolved into the solution and excess settled at the bottom, meaning it was important to not disturb the jar and disperse undissolved NaCl.
24 Centrifuge tubes were labelled according to the previous system and were filled with the dry sand sample to the 4 mL marking on tube. Using a pipette, 4 mL of the previously made saline solution was added to the tubes on top of the sand (see Figures 4 and 5). These samples were vigorously shaken, and then placed directly into a centrifuge for 5 minutes per sample to rapidly settle and separate the sand sample. The machine was set to approximately 2000 RPM (revolutions per minute). The settled samples were then placed into a test tube rack and their movement was kept to a minimum.
Before examining each sample, water was used to determine the volume of liquid that could fit between a microscope slide and a standard size coverslip. An automatic pipette was used to ensure standardisation amongst all sample sizes, and the plastic tip was cut off to create an opening, 2 mm in diameter. 700 µL was found to be the appropriate amount placed onto the microscope slide as it was the maximum amount that did not result in loss of the sample when a slide coverslip was placed on top. When drawing up a sandsaline sample, the automatic pipet was submerged no more than 4 mm into the liquid and the tip was situated towards the edge of the container. The liquid extracted, was released onto the clean microscope slide, and covered using a coverslip, before being examined using a light microscope. Each sample was thoroughly inspected and photographed.
Figure 4: Centrifuge tube filled with 4 mL of dry sand sample
Figure 5: Centrifuge tube filled with 4 mL of dry sand sample and 4 mL of saline solution
Results
The results of the experiment are as displayed in Table 1, by which each number represents the amount of microplastics identified in the entire sample. No evidence of microplastics were encountered, other than sightings of debris (shown in Figure 6) which were later rejected (as not being microplastics). Had results been found, estuarine beaches (1, 2 and 6) and ocean beaches (3, 4 and 5) would have been averaged and compared, as well as conducting an ANOVA test to further identify whether a significant difference was at hand. Individual averages for each beach would also have been calculated, drawing out trends and variations. Whilst the complete lack of microplastics in the observed samples is unexpected, as it is known microplastics exist in many of these locations (“Hotspot Map,” 2015), the consistency of the data indicates that an error occurred at an earlier stage of the experimental process, such as incorrect extraction.
Table 1: Results of microplastic findings (units in quantity per sample)
Beach
Count of microplastics 0m from water line 1m from water line 2m from water line
3m from water line 1 0 0 0 0 2 0 0 0 0 3 0 0 0 0 4 0 0 0 0 5 0 0 0 0 6 0 0 0 0
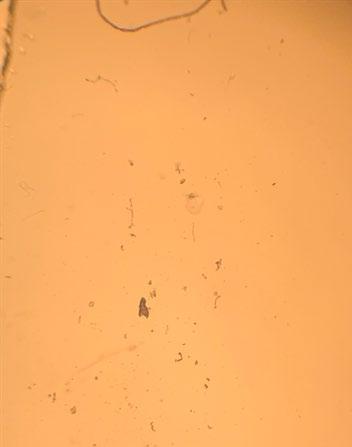
Figure 5 : Debris observed through microscope
Discussion
Discussion of results obtained
This experiment was undertaken due to increasing rates and dangers surrounding microplastics. The aim was to identify the environments which contained the highest numbers of microplastics to provide assistance moving forward and limit the expansion of microplastics where possible. The empirical research, as stated in the methodology, undertook multiple trials, and was repeated under various conditions, yet no microplastics were found using the method employed.
An issue that surfaced, which has been briefly mentioned in the results, was the confusion caused by large amounts of debris being sighted upon examining samples under a microscope. Many times, when debris was seen, it was thought to have been microplastics, but upon further research, was excluded. Some of this debris has now been identified as salt crystals due to the saline solution, these are shown in Figure 7. Another item that was commonly found were small fibres that had come from paper towel and a microfibre cloth when cleaning the microscope slides, seen in Figure 6. To exclude this as data, a trial using paper towel, a microfibre cloth and lint free paper was conducted, whereby clean microscope slides were rubbed with these items and then examined under a microscope. Using the lint free paper as the control, allowed observations to be made that the microfibres were only present after the use of a paper towel or microfibre cloth on the slides, allowing the microfibres to be ruled out as microplastic data.
It is also possible that microplastics floating in the brine were not picked up by the pipette extraction method used. Perhaps they were held close to the edge of the centrifuge tube by surface tension and not picked up in the small volume (< 1 mL) used for mounting between a microscope slide and coverslip. Alternatively, the sand samples may have been collected in a manner that meant only a small proportion of the sand collected was taken from the uppermost sediment-layer, that would likely contain the most microplastics. As previously stated, microplastics are less dense than seawater, so they are expected to float and accumulate at the high tide line where floating detritus ends up. If the project was to be redone, the protocols of “Guidelines for sampling microplastics on sandy beaches” (Sluka, 2018) would be followed. This would involve sampling from only the high tide line and using a transect along this, rather than vertically from the sea towards drier sand. Samples would also be only collected from the top 5 cm of sand, possibly using a quadrat. Sand samples would be collected in larger amounts, then followed by a methodology to concentrate the microplastic particles, such as floatation in brine and straining by filter paper (Besley et al., 2017).
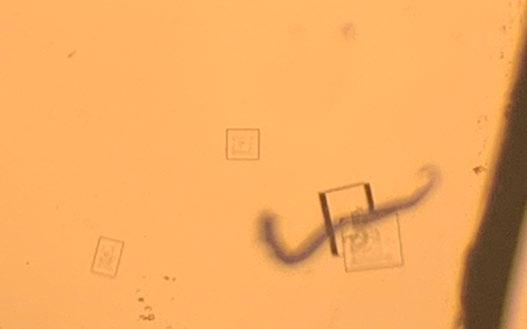
Figure 6: Square particles are salt crystals observed through microscope
Review of methods for visualising microplastics suitable for use in schools
The results of this study show that isolation and visualisation of small microplastics from sand samples is not an easy task. As microplastics are a growing problem, and the magnitude of the task of surveying the world's beaches is well suited to a citizen science approach (note the AUSMAP site which does citizen science for microplastics — “Hotspot Map,” 2015), a survey of the current literature was conducted. This reviewed a range of methods for visualising microplastics in sand samples that would be suitable for use in schools. A summary of the methodologies is given in Table 2.
Sieving using density separation
This method (Kunz, 2021) is used to initially separate microplastic particles from sand. It consists of first conducting a density separation, using a saturated salt solution (NaCl), whereby the solution has a density of 1.2 g/cm3, allowing microplastics to float as they have a lower density. This solution is added to a beaker along with the dry sand sample, stirred, and then the supernatant is poured through sieves of decreasing sizes, as seen in Figure 8, separating the sample's particles into different size classes. Concentrated ethanol is then used to separate the solution, by which ethanol has a density of 0.789 g/cm3 causing the majority of the plastics and heavier materials to sink to the bottom. The remaining sample from the previous separation is combined with the ethanol, stirred and the supernatant is strained, leaving two fractions of lighter and heavier materials. The two fractions will contain pieces of driftwood which have a density of about 1.5 g/cm3 but will always float due to air in its pores, thus, a vacuum pump is used to remove airspace allowing the driftwood to sink, leaving only plastic particles floating in the two samples (and driftwood at the bottom), as seen in Figure 9. The remaining samples can then be poured off and examined. A video of this method is available (Microplastic Research Taiwan, 2021). This method is optimised for sand samples that contain high amounts of driftwood and other organic material and aimed to extract larger microplastics by providing samples free of excess material that can be easily examined. The specific sizes of microplastics were not identified but were categorised as; mostly fragments with small amounts of wood or foamed plastic and, mostly styrofoam with small amounts of fragments or wood (Kunz, 2021). Additionally, this method is inexpensive and allows effective separation of a sample within a school research environment.
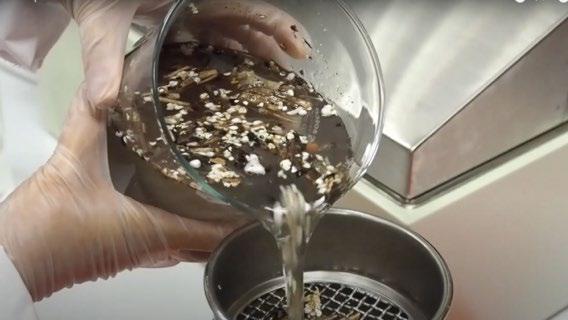
Figure 8: Sieving sample – Reprinted from Microplastic Sieving sample – Reprinted from Microplastic Research 7: Sieving sample Research Taiwan, (2021) Taiwan, (2021) Source: Microplastic Research Taiwan (2021)
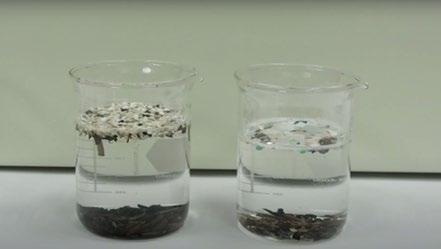
Figure 8: Separated sample Source: Microplastic Research Taiwan (2021)
Filtration
Decanting a larger volume of liquid and filtering it through filter paper has been shown to be effective when extracting microplastics from a solution (Besley et al., 2017). This method first requires a density separation, in which a sand sample is added directly to a supersaturated solution and swirled, causing lightweight particles, such as microplastics to float. By filter paper (for larger microplastics) or very fine mesh (for very small microplastics), the surface liquid of the mixture is strained, ensuring only the supernatant (containing the lightweight particles) is poured off and denser particles such as sand or undissolved salt do not wash onto the filter paper. The filter paper (or fine mesh) can be observed under a dissecting microscope, whereupon microplastics can be examined and quantified. In a trial conducted of this methodology, microplastics were detected (as seen in Figure 10), in which all were <1 mm in diameter and the smallest being approximately 10 μm.
This methodology provides reliable extraction of microplastics from a solution so that they can be easily examined after separation from a sample. It is effective when conducting research within schools as the equipment is cheap and easily accessible, and the methodology does not contain multiple steps, nor is it
complex. Filter paper has been shown to successfully detect microplastics as small as 100 μm in diameter (Zhu et al., 2020), supporting that there is very little sample lost in the extraction phase. The filter paper may also be replaced with a very fine mesh (At present the smallest available being 2.5 μm), allowing the investigation to be tailored to detecting a variety of microplastic size ranges. Problems include sand getting in the sample, which does obscure results, but rinsing the edge of the tube with the brine, prior to decanting, or pipetting out the supernatant would significantly reduce contamination by sand.
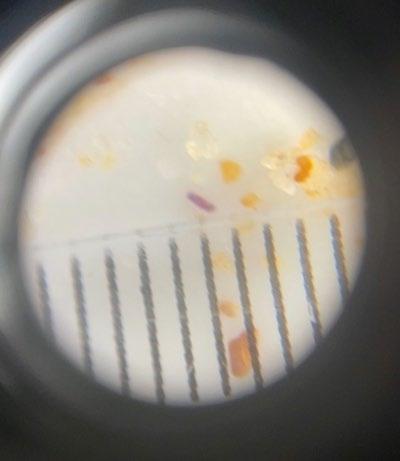
Figure 9: Microplastics observed under microscope. A clear plastic ruler with mm marks is in each FOV. (Source: Taylor, 2022)
Staining of microplastics with fluorescent dyes
Many studies on small microplastics (which were the target of this investigation) have involved staining with a fluorescent dye. Nile red (NR) is a lipophilic dye that efficiently stains microplastics (Shim et al., 2016) as it is a hydrophobic fluorophore that binds to neutral lipids and is strongly fluorescent whilst in a hydrophobic environment (Nie & Stürzenbaum, 2017). Fluorescence microscopy follows the principle that when the microplastic specimen is illuminated with a light of a specific wavelength, it is absorbed by the fluorophores and will result in the microplastics emitting light of a different, longer wavelength. Nile Red may be excited by blue or green light and emits in the orange red part of the spectrum (See Figure 11). An orange filter may be used to let only the emission wavelength pass through, and not the exciting wavelengths.
Investigations that utilise this method consist of first conducting a process of extraction, whereby microplastics must be highly concentrated or separated from their sediment sample before being stained with NR. Many reports have stated that a density separation is best for this process (Maes et al., 2017), but others outline that sieving may also be used, in which the sample is poured through sieves of 5 mm, 1 mm, and 0.3 mm (Foster et al., 2015). Once microplastics are isolated, they are treated with NR, which is used at an optimum concentration of 10 μg/mL, (Maes et al., 2017). The dye then must be excited using an LED light source for fluorescence detection.
Traditional fluorescence microscopes are too expensive for use in schools (at least $4500 — “Optico N300F LED Fluorescent Microscope,” 2018) but there are some simple ways to convert a regular school microscope into an instrument that can view fluorescent dyes. A range of bright-field microscopes have been tested for their suitability for adaptation to fluorescence detection, and it has been determined that any stereo and most compound microscopes operating up to 100x magnification can be adapted (Labbe, Bagshaw and Uttal, 2020). In this economical method, the excitation wavelength for NR fluorescence is provided by a blue (450 nm wavelength) LED flashlight, in which another lens taken from an identical LED flashlight was attached to the existing lens, allowing the LED chip to be focused to a 2 mm square. The flashlight is held at an angle of 40° to 60° to the sample and a small yellow filter is attached to the objective lens. An in-depth description of this setup is available in a video (Bagshaw, 2019). This adaptation utilises materials that are both inexpensive and easily accessible, making it suitable to be carried out in a school setting, whilst still providing high quality results.
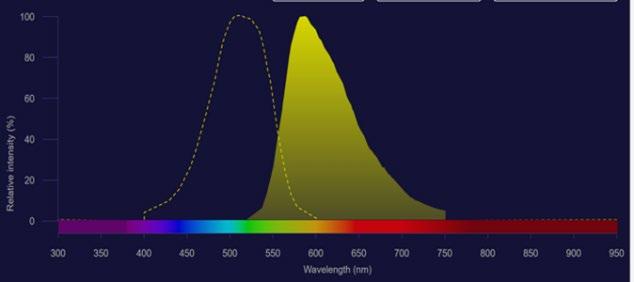
Figure 10: Nile Red excitation is shown in dotted line, emission in solid shading. (Source: Fluorescence SpectraViewer)
Technique Problem addressed Positives Negatives
Sieving using density separation
(Kunz, 2021)
A more foolproof method for separation of microplastics from sediment samples Effectively separates sample into multiple size classes Optimal for samples containing high amounts of organic material Inexpensive Designed for extracting larger microplastics Involves multiple steps
Filtration
(Besley et al., 2017) Allows successful extraction of microplastics after separation
Shown to have very little sample loss in extraction phase Inexpensive and accessible materials Simple methodology Able to detect microplastics as small as 100 μm in diameter, and can be tailored to different size ranges May not separate sample as effectively as other methods
Traditional purpose-built fluorescence microscopy
(Maes et al., 2017)
Budget fluorescence microscopy
(Labbe, Bagshaw and Uttal, 2020)
Video setup: (Bagshaw, 2019)
Highly effective detection of microplastics when examining
Highly effective detection of microplastics when examining
Allows clear visibility of microplastics Commonly used method across eminent microplastic investigations
Made inexpensive by modifications to school laboratory compound microscopes or dissecting microscopes Majority of equipment is easily accessible and can usually be sourced through school Allows clear visibility of microplastics
Very expensive equipment Requires complex steps Nile Red dye requires sourcing through specialist suppliers
Requires additional setup Nile Red dye requires sourcing through specialist suppliers
Conclusion
The investigation carried out did not identify any microplastics in the samples collected, thus no conclusion could be drawn as to whether the microplastic numbers found in sediment samples from the Sydney region were higher on the shorelines of ocean beaches, or estuarine beaches. The reason for no data being evident was most likely due to flaws in the methodology, or more specifically in the sampling, separation, extraction or examining processes. Due to this, we cannot yet accept or reject the stated hypothesis, as we can argue that the samples collected may have contained microplastics, but these could not be identified with the method used.
To provide a basis of furthering research on the subject matter, numerous alternate methodologies of extracting and quantifying microplastics have been identified and evaluated. Each methodology was reviewed based on the criteria of being suitable for use in schools. The literature review of methods for inexpensive isolation of small microplastics will allow future researchers to be aware of problems that may arise, and additionally utilise the suggestions made
when carrying out their surveys on microplastic levels on beaches.
Acknowledgements
Thank you to Dr Alison Gates who helped to come up with a new approach to my project and talked me through how I would reconstruct each section. To Mrs Nonie Taylor for offering her assistance and providing information on the filtration method. To Dr Matthew Hill for lending guidance wherever possible. And a special thank you to Dr Terena Holdaway-Clarke who supported me through my research process, reassuring me when I could not find data and constantly giving feedback on my report.
References
Bagshaw, C. (2019). 01262 Nile Red fluorescence [YouTube Video]. Retrieved from https://www.youtube.com/watch?v=BYvU9sOAuFM&t=1 s
Besley, A, Vijver, MG, Behrens, P & Bosker, T 2017, ‘A standardized method for sampling and extraction methods for quantifying microplastics in beach sand’, Marine Pollution Bulletin, vol. 114, no. 1, pp. 77–83, viewed 18 June 2022, <https://www.sciencedirect.com/science/article/abs/pii/S00 25326X16306877>.
Fluorescence SpectraViewer. (2020). Retrieved June 8, 2022, from Thermofisher.com website: https://www.thermofisher.com/order/fluorescencespectraviewer?SID=srchsvtool&UID=1142gto#!/?SID=srch-svtool&UID=1142gto
Foster, G., Mausra, Baker, Foster, & Arthur. (2015). Photo credit: NOAA Marine Debris Program Laboratory Methods for the Analysis of Microplastics in the Marine Environment: Recommendations for quantifying synthetic particles in waters and sediments. Retrieved from https://marinedebris.noaa.gov/sites/default/files/publication s-files/noaa_microplastics_methods_manual.pdf
Hidalgo-Ruz, V., Gutow, L., Thompson, R., & Thiel, M. (2012). Microplastics in the Marine Environment: A Review of the Methods Used for Identification and Quantification. ACS Publications, 46(6). Retrieved from https://pubs.acs.org/doi/abs/10.1021/es2031505
Hotspot Map. (2015). Retrieved June 18, 2022, from Ausmap.org website: https://www.ausmap.org/hotspot-map
Jiang, J. Q. (2018). Occurrence of microplastics and its pollution in the environment: A review. Sustainable production and consumption, 13, 16-23.
Jovanović, B. (2017). Ingestion of microplastics by fish and its potential consequences from a physical perspective. Integrated environmental assessment and management. 13(3), 510-515. Kunz, A. (2021). Microplastic Research in Taiwan. Retrieved June 17, 2022, from Microplastic Research in Taiwan website: https://microplasticresearch.wordpress.com/
Labbe, A. B., Bagshaw, C. R., & Uttal, L. (2020). Inexpensive Adaptations of Basic Microscopes for the Identification of Microplastic Contamination Using Polarization and Nile Red Fluorescence Detection. Journal of Chemical Education, 97(11), 4026–4032. https://doi.org/10.1021/acs.jchemed.0c00518
Maes, T., Jessop, R., Wellner, N., Haupt, K., & Mayes, A. G. (2017). A rapid-screening approach to detect and quantify microplastics based on fluorescent tagging with Nile Red. Scientific Reports, 7(1). https://doi.org/10.1038/srep44501
Microplastic Research Taiwan. (2021). Microplastic extraction from beach sediments [YouTube Video]. Retrieved from https://www.youtube.com/watch?v=W8mLqxpzW0o&t=5s
Nie, Y., & Stürzenbaum, S. R. (2017). Model Nematodes in Obesity Research. Animal Models for the Study of Human Disease, 267–280. https://doi.org/10.1016/b978-0-12809468-6.00011-5
Optico N300F LED Fluorescent Microscope. (2018). Retrieved June 19, 2022, from Microscopes.com.au website: https://microscopes.com.au/products/opticon300f-led-fluorescentmicroscope?_pos=1&_sid=186be1cfb&_ss=r
Prata, J. C., da Costa, J. P., Duarte, A. C., & Rocha-Santos, T. (2019). Methods for sampling and detection of microplastics in water and sediment: A critical review. TrAC Trends in Analytical Chemistry, 110, 150–159. https://doi.org/10.1016/j.trac.2018.10.029
Rey SF, Franklin J, Rey SJ (2021). Microplastic pollution on island beaches, Oahu, Hawai`i. PLOS ONE 16(2): e0247224
Rochman, C. M., Hoh, E., Kurobe, T., & Teh, S. J. (2013). Ingested plastic transfers hazardous chemicals to fish and induces hepatic stress. Scientific Reports, 3(1). https://doi.org/10.1038/srep03263
Shim, W. J., Song, Y. K., Hong, S. H., & Jang, M. (2016). Identification and quantification of microplastics using Nile Red staining. Marine Pollution Bulletin, 113(1-2), 469–476. https://doi.org/10.1016/j.marpolbul.2016.10.049
Sluka, R. (2018). Guidelines for sampling microplastics on sandy beaches. Retrieved from https://www.arocha.org/wpcontent/uploads/2018/01/Microplastic-samplingprotocol.pdf
Sun, X., Wang, T., Chen, B., Booth, A. M., Liu, S., Wang, R., & Xia, B. (2021). Factors influencing the occurrence and distribution of microplastics in coastal sediments: From source to sink. Journal of Hazardous Materials, Volume 410, 124982
Taylor, N. (2022, May). New method of filtration for microplastics in sand, using filter paper [Letter to Terena Holdaway-Clarke; Face-to-face].
Wilson, S (2022). You know you’re swimming in it – worst beaches for swimming revealed. The Lighthouse, Macquarie University.
Windsor, F. M., Durance, I., Horton, A. A., Thompson, R. C., Tyler, C. R., & Ormerod, S. J. (2019). A catchment-scale perspective of plastic pollution. Global Change Biology, 25(4), 1207-1221
Zhang, H. (2017). Transport of microplastics in coastal seas. Estuarine, Coastal and Shelf Science, 199, 74–86. https://doi.org/10.1016/j.ecss.2017.09.032
Zhu, C., Kanaya, Y., Nakajima, R., Tsuchiya, M., Nomaki, H., Kitahashi, T., & Fujikura, K. (2020). Characterization of microplastics on filter substrates based on hyperspectral imaging: Laboratory assessments. Environmental Pollution, 263, 114296. https://doi.org/10.1016/j.envpol.2020.114296
