PRESENTING SPONSOR


2022

PRESENTING SPONSOR
At SRP, we’re innovating ways to stay ahead of the Valley’s growing and evolving energy needs. We’re developing one of the largest solar-charged battery storage projects in the country and adding 2,025 megawatts of solar by 2025. These efforts aren’t just about what we’re doing. A sustainable, reliable and affordable energy future requires all of us. Last year alone, customers like you helped conserve enough energy to power nearly 47,000 homes.* In our eyes, that’s moving forward together.
See how we’re making sustainability a reality at srp.net/future

We can’t predict the future, but we can certainly plan for it.


“We are excited that DATOS is part of this year’s U.S. Hispanic Chamber of Commerce annual conference, which offers avaluable opportunityto showcase howHispanic businesses are helpingto driveArizona’s robust economy.SRPgreatlyvaluesourpartnershipwiththeArizonaHispanicChamberofCommerce,andweareproud to continue to support this important event. We know that we are stronger when we celebrate our differences and embracethe diversitythat makesArizona such a special place.”
 —DAVID ROUSSEAU, SRP President

Welcome to the 26 th annual DATOS: The State of Arizona’s Hispanic Market report from the Arizona Hispanic Chamber of Commerce.
We are honored that the United States Hispanic Chamber of Commerce is holding its 2022 Annual Conference in Phoenix and has invited DATOS to kick off the opening day program. It’s exciting to share the DATOS report with conference participants from across the country, to hear their feedback and to learn from their experience.
In addition to providing critical data regarding the Hispanic population and business market, this year’s DATOS report takes a closer look at the economic opportunities available to Latino businesses. Arizona’s economy is thriving, but identifying and taking advantage of all opportunities is critical to continued growth. DATOSprovides Hispanic businesses with exclusive access to subject matter experts who can help them navigate the system and find success.
Hispanic businesses are critical to the vitality and success of our communities. They are part of the fabric of our culture and demonstrate that we are stronger when we embrace and celebrate our diversity. DATOS is an important tool that can help unlock the collective potential of the Hispanic business community and support success for all.
Enjoy the conference!
STEVEN LOPEZ DATOS Honorary Chair Senior Director, Customer Strategy Salt River Project (SRP)
The Arizona Hispanic Chamber of Commerce (AZHCC) is tremendously honored that our signature annual event, DATOS:The State ofArizona’s Hispanic Market, is a part of the United States Hispanic Chamber of Commerce (USHCC) National Conference being held OCT. 2–4 in Phoenix. This year, we will release our 26th DATOS report at the USHCC’s opening breakfast session on Monday, Oct. 3.
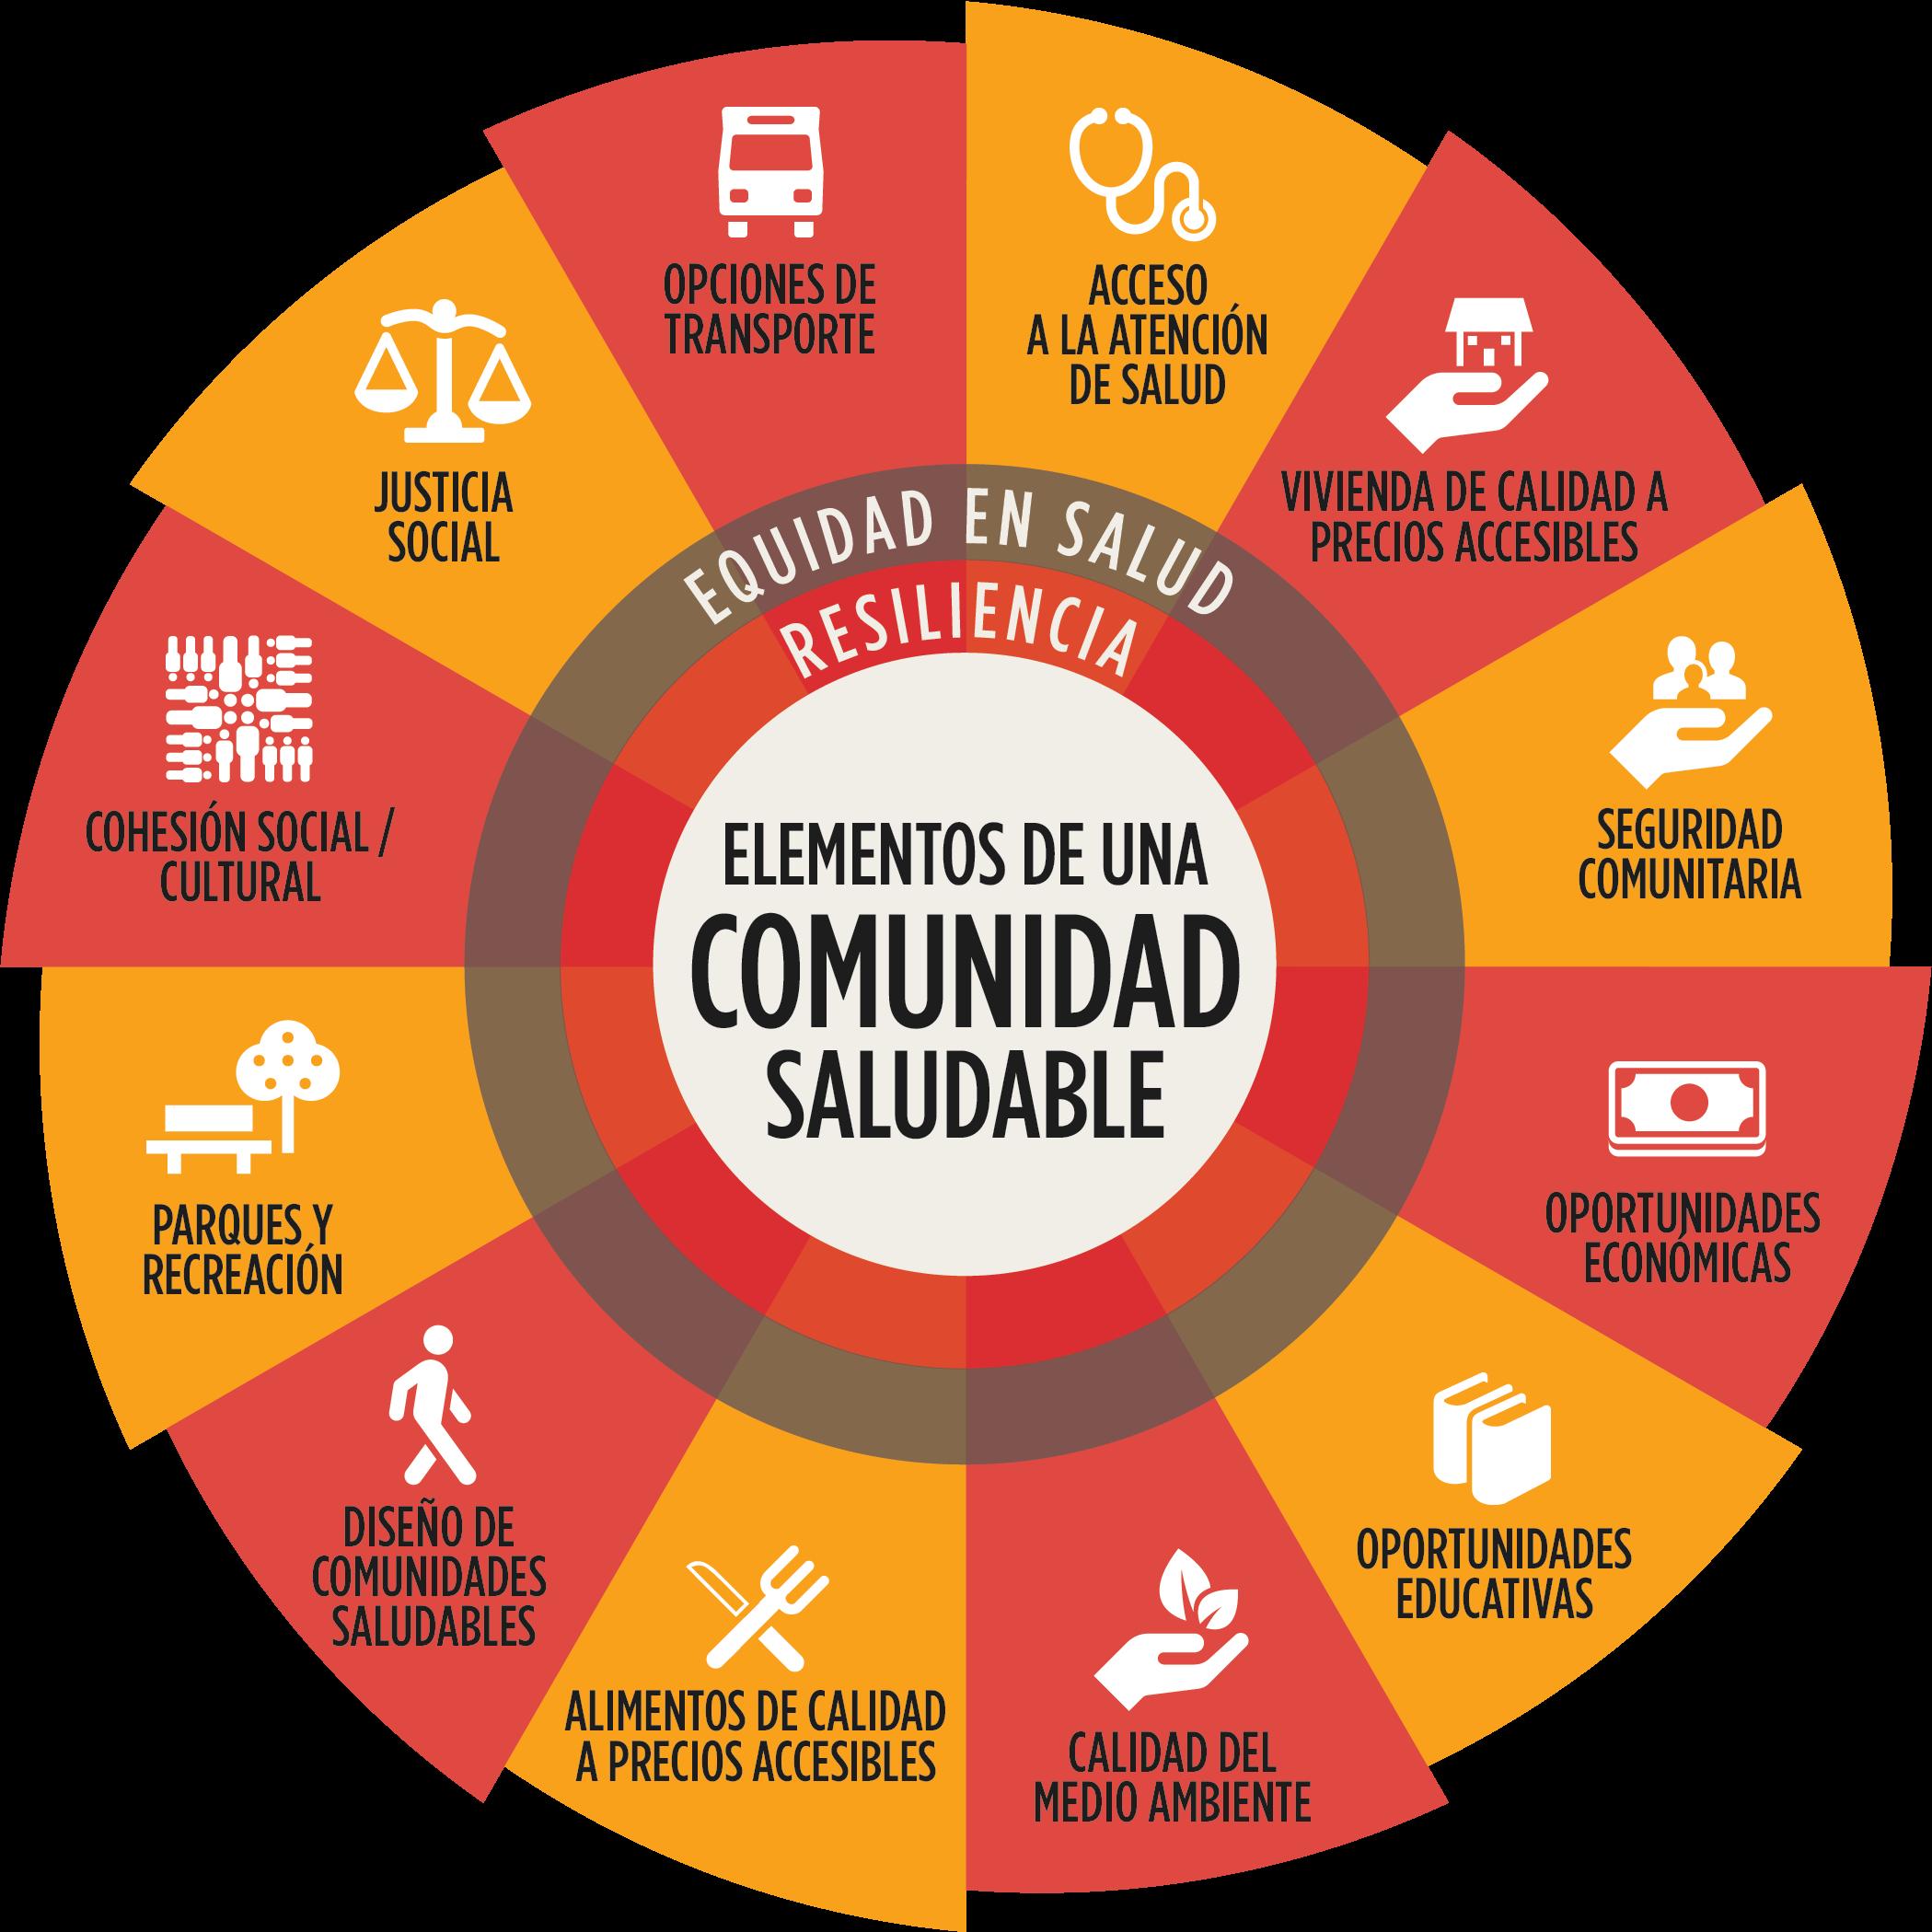
Our 26 th DATOS report primarily focuses on Economic Opportunity, including a comprehensive collection of data under this theme that uses demographic, sociographic and psychographic data collected to show the impact of Hispanics on Arizona. By partnering with the Vitalyst Health Foundation this year, we were able to analyze the economy and all the data we have collected through a dynamic framework that lets us see the contributions of Arizona Hispanics in relation to the social determinants of a healthy community.
Our partnership with Vitalyst, a nonprofit that is working to “connect, support and inform efforts to improve the health of individuals and communities in Arizona,” is modeled after the work of the World Health Organization and the Centers for Disease Control and Prevention (CDC). We firmly believe that good health is good business—and everyone deserves an opportunity to live in a safe, healthy environment. A critical measure of a community’s overall health is access to economic opportunity (p.36). However, there are many other important factors at play—and we explore each one in this report: educational opportunity (p.89), community safety (p.181), affordable quality housing (p.113), health care (p.161), environmental quality (p.143), quality affordable food (p.131), community design (p.217), parks and recreation (p.203), social/cultural cohesion (p.227), social justice (p.245) and transportation options (p.191). Presented together, we can easily envision how a community’s health is shaped by every one of these vital elements.
As in years past, the AZHCC’s talented team of researchers, writers, interns and editors behind DATOS have tirelessly and magnificently documented and interpreted the implications of the major market trends in Arizona’s increasingly diverse and shifting demographics. Their work is essential to ensuring that Arizonans are fully aware of the broad and diverse contributions that Latinos make to our beautiful state and its growing economy. Being at this breakfast session is a big step toward that awareness. Thank you all for joining us for this milestone event.
Enjoy the USHCC conference and, for non-locals, enjoy your time in beautiful, sunny Arizona!
S. VILLALOBOS
 President & CEO, AZ Hispanic Chamber of Commerce Editor, DATOS: The State of Arizona's Hispanic Market
(LISTED IN ALPHABETICAL ORDER BY COMPANY/ORGANIZATION)
FEVEN KEBEDE
ARIZONA FEDERAL CREDIT UNION
OKECHUKWU OGBA
ARIZONA FEDERAL CREDIT UNION
DR. LOUI OLIVAS
ARIZONA STATE UNIVERSITY
TARA JACKSON
ARIZONA TOWN HALL
ANDREA WHITSETT
ASU MORRISON INSTITUTE FOR PUBLIC POLICY
DR. FRANCISCO
LARA-VALENCIA
ASU SCHOOL OF TRANSBORDER STUDIES
CHRISTINA TELLEZ
AZ REPUBLIC MEDIA
JOSEPH GARCIA
CHICANOS POR LA CAUSA (CPLC)
SHARA GALONSKY CLARITAS
MYRNA CARDENAS
EDUCATION FORWARD ARIZONA
ERIN HART
EDUCATION FORWARD ARIZONA
JERRY ROMO
ESCALA MEDIA
KRISTEN STEPHENSON
GREATER PHOENIX ECONOMIC COUNCIL
ELSA BELJEAN
MARICOPA ASSOCIATION OF GOVERNMENTS
MÓNICA S. VILLALOBOS,
EDITOR
DAVID MORSE OH PREDICTIVE INSIGHTS
ERIC DIAZ OYE! INTELLIGENCE
DALE BROWN
PHOENIX BUSINESS JOURNAL
LUIS CORDOVA
ROUNDS CONSULTING
STEVEN LOPEZ
SALT RIVER PROJECT (SRP)
DR. MARIA R. CHAVIRA
THE ROMAN CATHOLIC DIOCESE OF PHOENIX
DR. BERT VALENCIA
THUNDERBIRD SCHOOL OF GLOBAL MANAGEMENT
ELIZABETH SALAZAR
UNIDOSUS
SARAY LOPEZ
UNIVERSITY OF PHOENIX
JAIME BOYD
UNIVISION ARIZONA
YASMINE VERDUGO
UNIVISION ARIZONA
LUIS R. SOTO
VANTAGE WEST CREDIT UNION
DAVID MARTINEZ III
VITALYST HEALTH FOUNDATION
GLENN IWATA
WESTGROUP RESEARCH
CARMEN G. MARTÍNEZ
CREATIVE DIRECTOR
CATALINA PEREZ
ASSOCIATE EDITOR
KAREN MURPHY
COPY EDITOR/PROOFREADER
SARAÍ BORJA NEVAREZ
AD AUDITOR
GRACIELA MARTINEZ
BUSINESS RESEARCH ANALYST INTERN
PABLO CASANOVA
BUSINESS RESEARCH ANALYST INTERN
GUILLERMO GAMEZ RESEARCH ANALYST
DR. LOUI OLIVAS
SANDY FERNIZA
GEMA DUARTE-LUNA
RHONDA CARRILLO
IN DATOS 2022, THE TERMS HISPANIC, LATINX AND LATINO ARE USED SYNONYMOUSLY, AS ARE NATIVE AMERICAN AND AMERICAN INDIAN AND AFRICANAMERICAN AND BLACK. WHITE, NON-HISPANIC IS SOMETIMES REFERRED TO AS NON-HISPANIC WHITE. HISPANICS MAY BE OF ANY RACE.
THE INFORMATION PRESENTED HERE WAS SELECTED FROM STANDARD SECONDARY SOURCES. HOWEVER, DATA CHANGES QUICKLY AND IS NOT ALWAYS COLLECTED ANNUALLY. DATA OFTEN OFFERS A STATIC PICTURE OF AN EVER-CHANGING SITUATION. THE NUMBERS CALCULATED FOR ANY STATISTIC DEPEND ON THE DEFINITIONS AND ASSUMPTIONS USED TO PRODUCE THEM.


• THIS IS A COMPREHENSIVE COMPILATION OF SECONDARY RESEARCH MADE AVAILABLE TO THE AZHCC FROM VARIOUS SOURCES. IT IS EITHER PUBLIC INFORMATION OR USED WITH PERMISSION FROM THOSE SOURCES.
• PLEASE NOTE THAT THIS IS A SEARCHABLE PDF AND BY CLICKING CTL-F, A SEARCH BOX WILL APPEAR TO LOCATE ANY WORD OR PHRASE.


Given how often data ends up challenging conventional wisdom, it’s almost funny how surprising an accumulation of facts and framing can be. This has held true with Hispanics and DATOS and it similarly applies to health.
Conventional thinking holds that health is the product of health care, subject to the influence of genes and personal choice. But the data tell a different story. The consensus finding of the World Health Organization (WHO) is that health care represents only about 10-20 percent of overall health. The science of epigenetics is clarifying that genetic profiles actually do not predetermine our individual fates. Meanwhile, public health officials worldwide agree that the choices we make are predicated by the choices we have.
In other words, health goes beyond health care. Health is everywhere – shaped by the contexts in which we live, work, learn and play. Many of health’s data experts assert that the strongest predictor of health and well-being is not your genetic code, but rather your zip code. In fact, conditions in neighborhoods separated by just a 10-20 minute drive in Phoenix have the capacity to affect life expectancy by up to 10-14 years. Phoenix is not an anomaly. Cities all over the U.S. share similar profiles.
These facts are not just attention-getting, they are also perception-shifting and empowering. They tell us that we have new options to improve health and well-being. We can call upon partnership with sectors like food, housing or transportation. We can delve into the health impacts of education and economic opportunity. We can extend ourselves toward impacting the visceral effect that social factors like isolation or toxic stress have on health. We can study how all of these factors are rooted by the cross-cutting issues of equity and resilience. We can use that knowledge to collaborate and integrate efforts among and across sectors. In so doing, we can be more powerful, more effective and more impactful in improving community health and well-being.
We are humbled to be partnered with the Arizona Hispanic Chamber of Commerce in order to more thoroughly understand what this approach can mean for the well-being of Hispanics. Part of the DATOS mission is to align perceptions of Arizona Hispanics with a data-based reality. Vitalyst’s Live Well Arizona goal is to realign perceptions with the facts as well – and to capitalize on that new understanding with cross-sector investments of time, talent and treasure that can propel Arizona to a more equitable, healthier future.
When it comes to honoring the Hispanic community’s unique assets and strengths within this new health paradigm, we couldn’t be more grateful to partner with DATOS.
Here’s to a future of working together to improve community health and well-being for us all.
The Elements of a Healthy Community wheel was designed and produced by Vitalyst Health Foundation in collaboration with community partners. The elements are inspired by the work of the World Health Organization and the Centers for Disease Control and Prevention. To learn more, please visit VitalystHealth.org
1. The U.S. Hispanic population reached 62.1 million in 2020.
Source: U.S. Census Bureau QuickFacts
2. The Arizona Hispanic population reached nearly 2.2 million in 2020.
Source: U.S. Census Bureau
3. The Hispanic population is the second largest in the U.S. at almost 19% of the total U.S. population.
Source: U.S. Census Bureau QuickFacts
4. Phoenix has the 6th largest Hispanic population in the U.S. — at 643,000.
Source: U.S.NewsandWorldReport (2019)
5. Santa Cruz is the Arizona county with the most Hispanics at 83%. Maricopa County, where more than 50% of the entire population of Arizona lives, has a Hispanic population of 31%.
Source: U.S. Census Bureau
6. U.S.-born Latinos account for 63% of the U.S. Latino population.
Source: The National Association of Hispanic Real Estate Professionals (NAHREP)
7. If Hispanics were their own economy, they would be the 7th largest economy in the world.
Source: Latino Donor Collaborative
8. The Latino employment and work force participation in the U.S. increased from 23.8 million in 2010 to 29.8 million in 2019.
Source: Latino Donor Collaborative
9. At $2.7 trillion, the U.S. Latino gross domestic product (GDP) is larger than the GDPs of Italy, Brazil and Canada.
Source: Latino Donor Collaborative
10. Thirty-six percent of non-Hispanic, white people reported facing a “large negative effect” from the pandemic compared to 16% of Latinos in 2021.

Source: Stanford Graduate School of Business
11. In 2021, 26% of U.S. women-owned businesses were owned by Hispanic women.
Source: U.S. Small Business Administration
12. The Arizona Hispanic unemployment rate decreased from almost 18% in May 2020 to 7% in May 2021.
Source: Arizona Commerce Authority
13. Arizona, California, Florida, Illinois, New Jersey, New Mexico, New York and Texas collectively have nearly 75% of the nation’s Latino population.
Source: 2021 State Latino GDP Report, Arizona Executive Summary (funded by the Bank of America Charitable Foundation)
14. If the Latinos in Arizona, California, Florida, Illinois, New Jersey, New Mexico, New York and Texas were a single state, they would produce the second largest state gross domestic product (GDP) in the nation—$2 trillion in 2018.
Source: 2021 State Latino GDP Report, Arizona Executive Summary (funded by the Bank of America Charitable Foundation)
15. U.S. Hispanics had a homeownership rate of 48% in 2021.
Source: The National Association of Hispanic Real Estate Professionals (NAHREP)
16. Arizona is one of the Top 3 states with the highest Latino migration.
Source: The National Association of Hispanic Real Estate Professionals (NAHREP)
17. Hispanic renters spent 5% more of their income on housing compared to white renters.
Source: Urban Institute’s 2019 American Community Survey
18. An income of $70,944 is needed to afford a medianpriced home in Phoenix; however, the median Hispanic household income is only $60,100.
Source: The National Association of Hispanic Real Estate Professionals (NAHREP)
19. The Phoenix–Mesa–Chandler area ranks in the top 10 Hispanic markets.
Source: The National Association of Hispanic Real Estate Professionals (NAHREP)
20. The college enrollment rate for 18–24-year-old Hispanics increased by 4% between 2010 and 2019, while the college enrollment for whites decreased by 2%.
Source: National Center for Education Statistics (NCES)
21. The biggest challenges that both minority business enterprises (MBEs) and non-MBEs faced during the pandemic included an immediate loss of revenue, needing access to capital and supply chain issues.
Source: AZHCC Minority Business Enterprise Study Report (2022)
22. Minority business enterprises (MBEs) had lower revenues and were more likely to be family-owned and homebased compared to non-MBEs.
Source: AZHCC Minority Business Enterprise Study Report (2022)
23. Non-minority business enterprises (non-MBEs) in Arizona, Nevada and Utah received an average of almost twice as much funding (an average of $70,000) as MBEs received ($39,000).
Source: AZHCC Minority Business Enterprise Study Report (2022)
24. Forty-six percent of minority business enterprises (MBEs) mentioned having to overcome negative perceptions of being a minority-owned business.
Source: AZHCC Minority Business Enterprise Study Report (2022)
25. Minority business enterprises (MBEs) in tribal communities are less likely to have challenges keeping employees (13% vs. 21% MBEs overall).
Source: AZHCC Minority Business Enterprise Study Report (2022)
26. From 2009–2021, Arizona goods imports from the world were valued at $28 billion.
Source: International Trade Administration State Economy and Trade Fact Sheet (2022)
27. From 2009–2021, Arizona goods exports to the world were valued at $24.2 billion.
Source: International Trade Administration State Economy and Trade Fact Sheet (2022)
28. Mexico is Arizona's top good exports and imports partner, with an export value of $8.2 billion and an import value of $9.4 billion.
Source: International Trade Administration State Economy and Trade Fact Sheet (2022)
29. Computer and electronic products were Arizona's top goods export and import sectors in 2021.
Source: International Trade Administration State Economy and Trade Fact Sheet (2022)
30. Out of Arizona's metropolitan statistical areas (MSAs), Phoenix–Mesa–Chandler had the greatest value in exports at $11.074 billion.
Source: International Trade Administration State Economy and Trade Fact Sheet (2022)
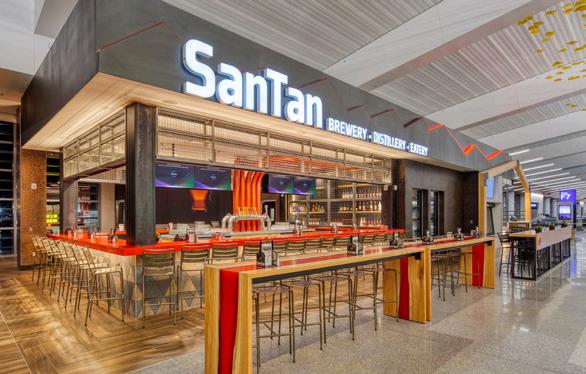
With a $ 38 billion a year economic impact, Phoenix Sky Harbor is the number one economic engine in the State of Arizona.

• More than 30 terminal concession locations are Hispanic owned or operated
• These businesses generate more than $20 million in revenue
• 27% of Sky Harbor’s terminal concessions are Hispanic owned or operated
ONES THOUSANDS MILLIONS BILLIONS TRILLIONS
HOW
How
Pinpointing potential customers more precisely. Engaging with them one-on-one more effectively. Turning them into loyal, paying customers more efficiently. That’s the Claritas Advantage.
Know more about who your best customers and prospects are with our industry-leading segmentations
Know more about how and where to reach your best audiences across devices and channels with the Claritas Identity Graph
Know more about what’s working and improve what isn’t with our near real-time analytics and advanced modeling capabilities
To learn more about how Claritas intelligence can help you transform marketing results, contact Claritas at 800.234.5973 or visit www2.claritas.com/DATOS www2.claritas.com/DATOS
• TOP 11 CITIES BY HISPANIC POPULATION COUNT
• TOP 11 CITIES WITH THE HIGHEST HISPANIC CONCENTRATION
• HISPANIC POPULATION AS A PERCENTAGE OF ARIZONA COUNTIES
• HISPANIC POPULATION IS 2ND LARGEST IN U.S.
• HISPANIC POPULATION PROJECTED TO GROW 89% BY 2060
• AS OF 2019, THE U.S. UNDER 16 DEMOGRAPHIC, NO LONGER HAS A RACIAL/ETHNIC MAJORITY
• HISPANICS ACCOUNTED FOR MORE THAN HALF OF TOTAL U.S. POPULATION GROWTH (2010–2019)
• U.S. HISPANIC ORIGIN
• HISPANIC CONCENTRATION BY STATE
• HISPANICS ACCOUNT FOR A LARGER SHARE OF THE YOUNGER GENERATIONAL COHORTS
• MEDIAN AGE OF HISPANICS IN U.S.
• U.S. BORN LATINOS ACCOUNT FOR 63% (38.5 MILLION) OF THE U.S. LATINO POPULATION
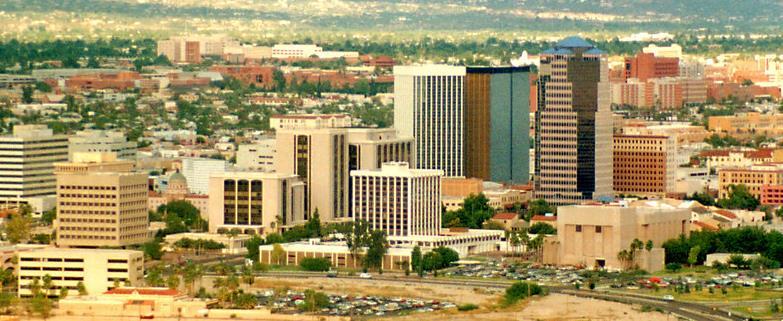
MARKET SNAPSHOT–ARIZONA
A broad overview of the Hispanic population in the Phoenix and Tucson markets, courtesy of Univision Communications IN FOCUS|
U.S. CENSUS UNDERCOUNTS THE HISPANIC POPULATION
BY CATALINA PEREZThe 2020 U.S. Census had the largest undercount of Hispanics ever—with as many as 3 million Hispanics not counted
VITALYST’S STRATEGIC APPROACH TO COMMUNITY HEALTH
BY SERGIO PARIS
Vitalyst has four priorities for the 2022–2023 fiscal year: civic health, food systems, health care integration and housing
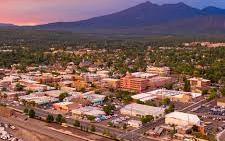
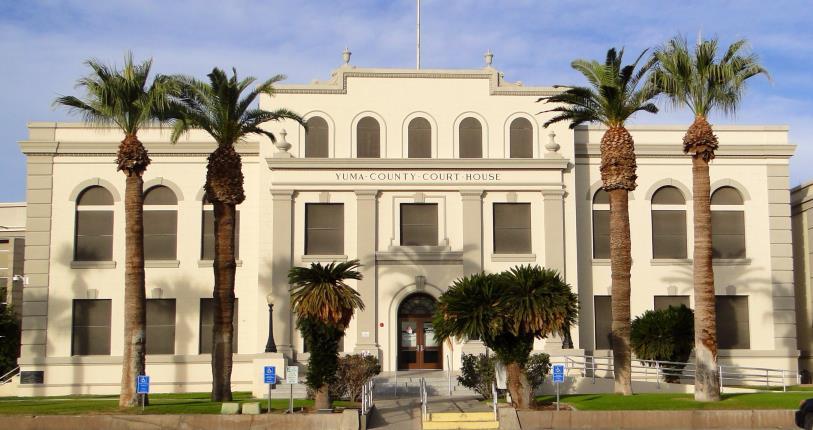
MARKET SNAPSHOT – ARIZONA
Some solid facts from Claritas about the Hispanic population in four key cities: Phoenix, Tucson, Flagstaff and Yuma


Source: U.S. Census Bureau, “Arizona’s Population More Than 7 Million in 2020, America Counts Staff, Up 11.9% Since 2010,” America Counts Staff, August 25 2021 www.census.gov/library/stories/state-by-state/arizona-population-change-between-census-decade.html


1, 2020 www.brookings.edu/research/new-census-data-shows-the-nation-is-diversifying-even-faster-than-predicted/#cancel
Source: Brookings Institution, "The nation is diversifying even faster than predicted, according to new census data," William H. Frey, July 1, 2020. www.brookings.edu/research/new-census-data-shows-the-nation-is-diversifying-even-faster-than-predicted/#cancel
HISPANICS ACCOUNTED FOR MORE THAN HALF OF TOTAL US POPULATION GROWTH (2010-2019)
BLACK 17% OTHER 9% HISPANIC 52%
ASIAN 22%
Source: Pew Research Center, “Hispanics Have Accounted for More than Half of Total U.S. Population Growth since 2010,” Jens Manuel Krogstad, July 10, 2020 www.pewresearch.org/fact-tank/2020/07/10/hispanics-have-accounted-for-more-than-half-of-total-u-s-population-growth-since-2010/
Source: Pew Research Center, “Hispanics Have Accounted for More than Half of Total US Population Growth since 2010,” Jens Manuel Krogstad, July 10. 2020 www.pewresearch.org/fact-tank/2020/07/10/hispanics-have-accounted-for-more-than-half-of-total-u-s-population-growth-since-2010/
US HISPANIC ORIGIN
NUMBERS IN MILLIONS
CUBAN
SOUTH AMERICAN
CENTRAL AMERICAN
PUERTO RICAN
3.872
5.929
5.808
MEXICAN
2.3595 HISPANICS IN U.S.
Source: U.S. Department of Health and Human Services, Office of Minority Services, “Profile: Hispanic/Latino Americans” minorityhealth.hhs.gov/omh/browse.aspx?lvl=3&lvlid=64
Source: U.S. Department of Health and Human Services, Office of Minority Services, “Profile: Hispanic/Latino Americans,” 2021 https://minorityhealth.hhs.gov/omh/browse.aspx?lvl=3&lvlid=64
37.147
60.5


MEDIAN AGE OF HISPANICS IN US 40 39 38 37 36 35 34 34 33 30 30 30 29 28 27 CUBANS ARGENTINES PERUVIANS COLOMBIANS SPANIARDS PANAMANIANS VENEZUELANS NICARAGUANS ECUADORIANS DOMINICANS PUERTO RICANS
BORN LATINOS ACCOUNT FOR 63% (38.5 MILLION) OF THE U.S. LATINO POPULATION
BORN LATINOS ACCOUNT FOR 63% (38.5 MILLION OF THE U.S.
(22.8 Million)
3 %


(38.5 Million)
Hispanic Real Estate
(NAHREP), State of Hispanic Homeownership Report, 2021


Every business has banking needs. Are all of yours being met? Consider partnering with the credit union that’s been supporting Arizonans for over 80 years. Desert Financial Credit Union offers a wide selection of products and services for Arizona businesses like:

Federally insured by NCUA | Equal Housing Opportunity

1 The creditor and issuer of business credit cards offered through Desert Financial Credit Union is Elan Financial Services, pursuant to a license from Visa U.S.A. Inc. Elan Financial Services is a vendor partner of Desert Financial Credit Union. Desert Financial makes no warranties or representations about the goods or services offered.
2 Wealth Management: Investment advisory services offered through Raymond James Financial Services Advisors, Inc. Securities offered through Raymond James Financial Services, Inc., Member FINRA / SIPC. Securities are not insured by credit union insurance, the NCUA or any other government agency, are not deposits or obligations of the credit union, are not guaranteed by the credit union, and are subject to risks, including the possible loss of principal. Desert Financial Credit Union, Desert Financial Wills and Trusts, Desert Financial Insurance and Desert Financial Wealth Management is not a registered broker/dealer and is independent of Raymond James Financial Services, Inc. Insurance: Insurance products and services are offered through Desert Financial Wealth Services, LLC dba Desert Financial Insurance Services. Desert Financial Wealth Services, LLC is a subsidiary of Desert Financial Credit Union. Insurance products and services are not insured by the NCUA, are not obligations of or guaranteed by the credit union or its affiliates, and may be subject to risk.
 BY CATALINA PEREZ
As the Hispanic population rapidly increases, it is important to recognize its significant economic impact on the United States. Over the last decade, Hispanics have been 50% of the total population growth in the U.S. And, according to the 2020 Census, there are an estimated 62.1 million Hispanics in the U.S.—and that does not count those who are undocumented.
The COVID-19 pandemic had a severe impact on the 2020 Census count. Due to delays in determining the survey results and the health risks associated with going door to door, the Census count does not accurately depict the size of the U.S. Hispanic population because many people were missed and excluded from the count.
Natural disasters and not enough outreach were two key factors in the miscounts in rural communities. The United States Census Bureau simply failed to proactively engage with rural communities prior to the count. There was little education and outreach in the form of advertisements and phone banking. In addition to the challenges with outreach, natural disasters in rural regions made it difficult for Census employees to travel and collect data in those areas. In communities affected by natural disasters, resources for support and infrastructure had to be prioritized over the Census count.
Before the pandemic, there already was a lot of debate on whether or not some Hispanics would answer the citizenship question on the Census because they had a fear of deportation. The Census has been criticized for negatively affecting marginalized communities with strict, exclusive categories and consequences for vulnerable populations.
According to the U.S. Census Bureau’s 2020 Post-Enumeration Survey that was released earlier this year, the 2020 Census had the largest undercount of Hispanics ever. It is estimated that 3 million Hispanics were not counted. This undercounting has had a significant negative impact on people of color because the Census numbers serve as a guide to distribute $1.5 trillion
annually in federal money to communities in need of health care, education, transportation and other critical public services. With an inaccurate count, it is nearly impossible for the federal government to fully understand the needs of these communities and equitably allocate resources.
U.S. CENSUS BUREAU census.gov
2020 Post-Enumeration Survey Estimation Report Census Coverage EstimatesforPeople inthe United States byState and Census Operations
FROM NPR.ORG
The 2020 census had big undercounts of Black people, Latinos and Native Americans
These 14 states had significant miscounts in the 2020 census
The Vitalyst Health Foundation has a critical mission: to connect, support and inform all efforts to improve the health of every individual and community in Arizona.
The foundation was established following the sale of the St. Luke’s Health System to a for-profit corporation in 1996. It first operated as St. Luke’s Charitable Health Trust (1996–1999) and then St. Luke’s Health Initiatives (2000–2016).
During its history, Vitalyst has invested more than $130 million into Arizona health, in areas ranging from statewide health policy to local community gardens. Along the way, the organization has established itself as a thought leader, convener, framer and catalyst of key health initiatives and coalitions.
To more effectively improve the well-being of all Arizona residents and communities requires recognition of all of the Elements of a Healthy Community and then collaboration by all stakeholders to take more equitable, comprehensive approaches to the opportunities and challenges that present themselves.
Since 2016, Vitalyst has been collaborating with partners statewide using the ElementsofaHealthyCommunity wheel (see p. 25). In 2019 and 2020, The Inter Tribal Council of Arizona and the Vitalyst Health Foundation convened sessions with the 21 Arizona tribal nations to develop a wheel that specifically addresses the issues faced by Arizona’s tribal nations.
All three versions of the wheel—the English and Spanish language versions and the Tribal Nations version—are available on the foundation’s website.
The COVID-19 pandemic has affected everyone in some way. At Vitalyst, it made us seriously reconsider our work. After much deliberation as a team and with feedback from our Board of
Trustees and the community, we refreshed our strategic roadmap. Our shift from five goals to three was the direct result of a series of listening sessions and stakeholder meetings with partners last fall. During these sessions, we asked this specific question: “What is standing in the way of Vitalyst achieving its vision?”
Between Vitalyst’s staff, partners and trustees, three common answers emerged:
1. Siloed systems and organizations create inefficiencies and missed opportunities to improve community health;
2. Talented nonprofits are often hamstrung by limited capacity and resources; and
3. Decision makers are often unaware of health-promoting solutions and/or lack the will to take action.
This information set the stage for Vitalyst’s three new goals. The foundation decided to foster:
• Collaborative Networks working to improve the conditions that directly affect health;
• Strong Community Partners equipped to advance health equity; and
• Informed Decision-Makers prioritizing community health and well-being.
We hope these goals resonate and spark new opportunities for team-based approaches to improve community health. We know, however, that our goals are broad and that the elements that create a healthy community must be comprehensive. That is why we realized it was important to narrow the focus of our work to deepen our impact.
Informed by community partners and our own experiences, our staff developed a set of criteria to determine how to refine our focus. These criteria include:
• having a real potential for impact;
integrate the physical, mental and social determinants of health; and
• Housing – Supporting statewide housing initiatives.
Vitalyst will always remain responsive to local community needs. Our doors are always open to opportunities that can improve community health and well-being, regardless of where these opportunities may connect to the Elements of a Healthy Community wheel. If there are ideas to be heard, we are here to listen and learn. That is why, in addition to our four main priorities, we are also dedicating our time and talent to additional opportunities within each goal of our refreshed strategic roadmap.
Let’s start collaborating right now to keep Arizona healthy.
Sergio Paris is the Director of Strategic Communications for the Vitalyst Health Foundation in Phoenix. In this role, he works with the foundation’s staff and community partners to create equity-centered narratives and advanceVitalyst’s mission and goals.
• ensuring each priority requires action across all three goals;
• requiring each priority to be cross-sector in nature; and
• confidence that the foundation has the capacity, history and expertise to give ample energy to each priority.
In the end, we focused on four priorities for the fiscal year 2022–2023: Civic Health; Food Systems; Health Care Integration; and Housing:
• Civic Health – Supporting long-term efforts that increase active community participation;
• Food Systems – Strengthening food systems across Arizona’s rural and urban areas;
• Health Care Integration – Supporting health systems that
VITALYST HEALTH FOUNDATION
2929 N. Central Ave., Suite 1550 Phoenix, AZ 85012 602.385-6500 | 602.385-6510 Fax info@vitalysthealth.org vitalysthealth.org
CONTACT A SPECIFIC STAFF MEMBER
vitalysthealth.org/about THE WHEELS
vitalysthealth.org/the-wheel
SPARK REPORT
Partnership in Action CommunityInputfortheVitalystStrategicPlanRefresh
Source: www2.claritas.com/Knowmore
www2.claritas.com/Knowmore

www2.claritas.com/Knowmore
www2.claritas.com/Knowmore
www2.claritas.com/Knowmore
www2.claritas.com/Knowmore
• U.S. LATINO GDP RANKS 7TH IN THE WORLD
• LATINO EMPLOYMENT AND WORK FORCE PARTICIPATION 2010 VS. 2019
• U.S. LATINO AND NON-LATINO GDP GROWTH — 2010 VS. 2019
• EFFECT OF PANDEMIC ON LATINOS VS. WHITES — 2020–2021
• EMPLOYEE GROWTH RATE: LATINOS VS. WHITES — 2007–2019
• TOP REASONS BUSINESS FINANCING IS SOUGHT — LATINOS VS. WHITES
• TOP SOURCES OF FINANCING
• POST-PANDEMIC REMOTE WORK — LATINOS VS. WHITES
• OUTSTANDING BUSINESS DEBT — LATINOS VS. WHITES
• PERCENTAGE OF WOMEN-OWNED BUSINESSES 2021
• ARIZONA HISPANIC UNEMPLOYMENT RATE — 2020–2021
• LIFETIME WAGE GAP LOSSES FOR ARIZONA WOMEN
• U.S. GDP VS. 8 STATE LATINO GDPs
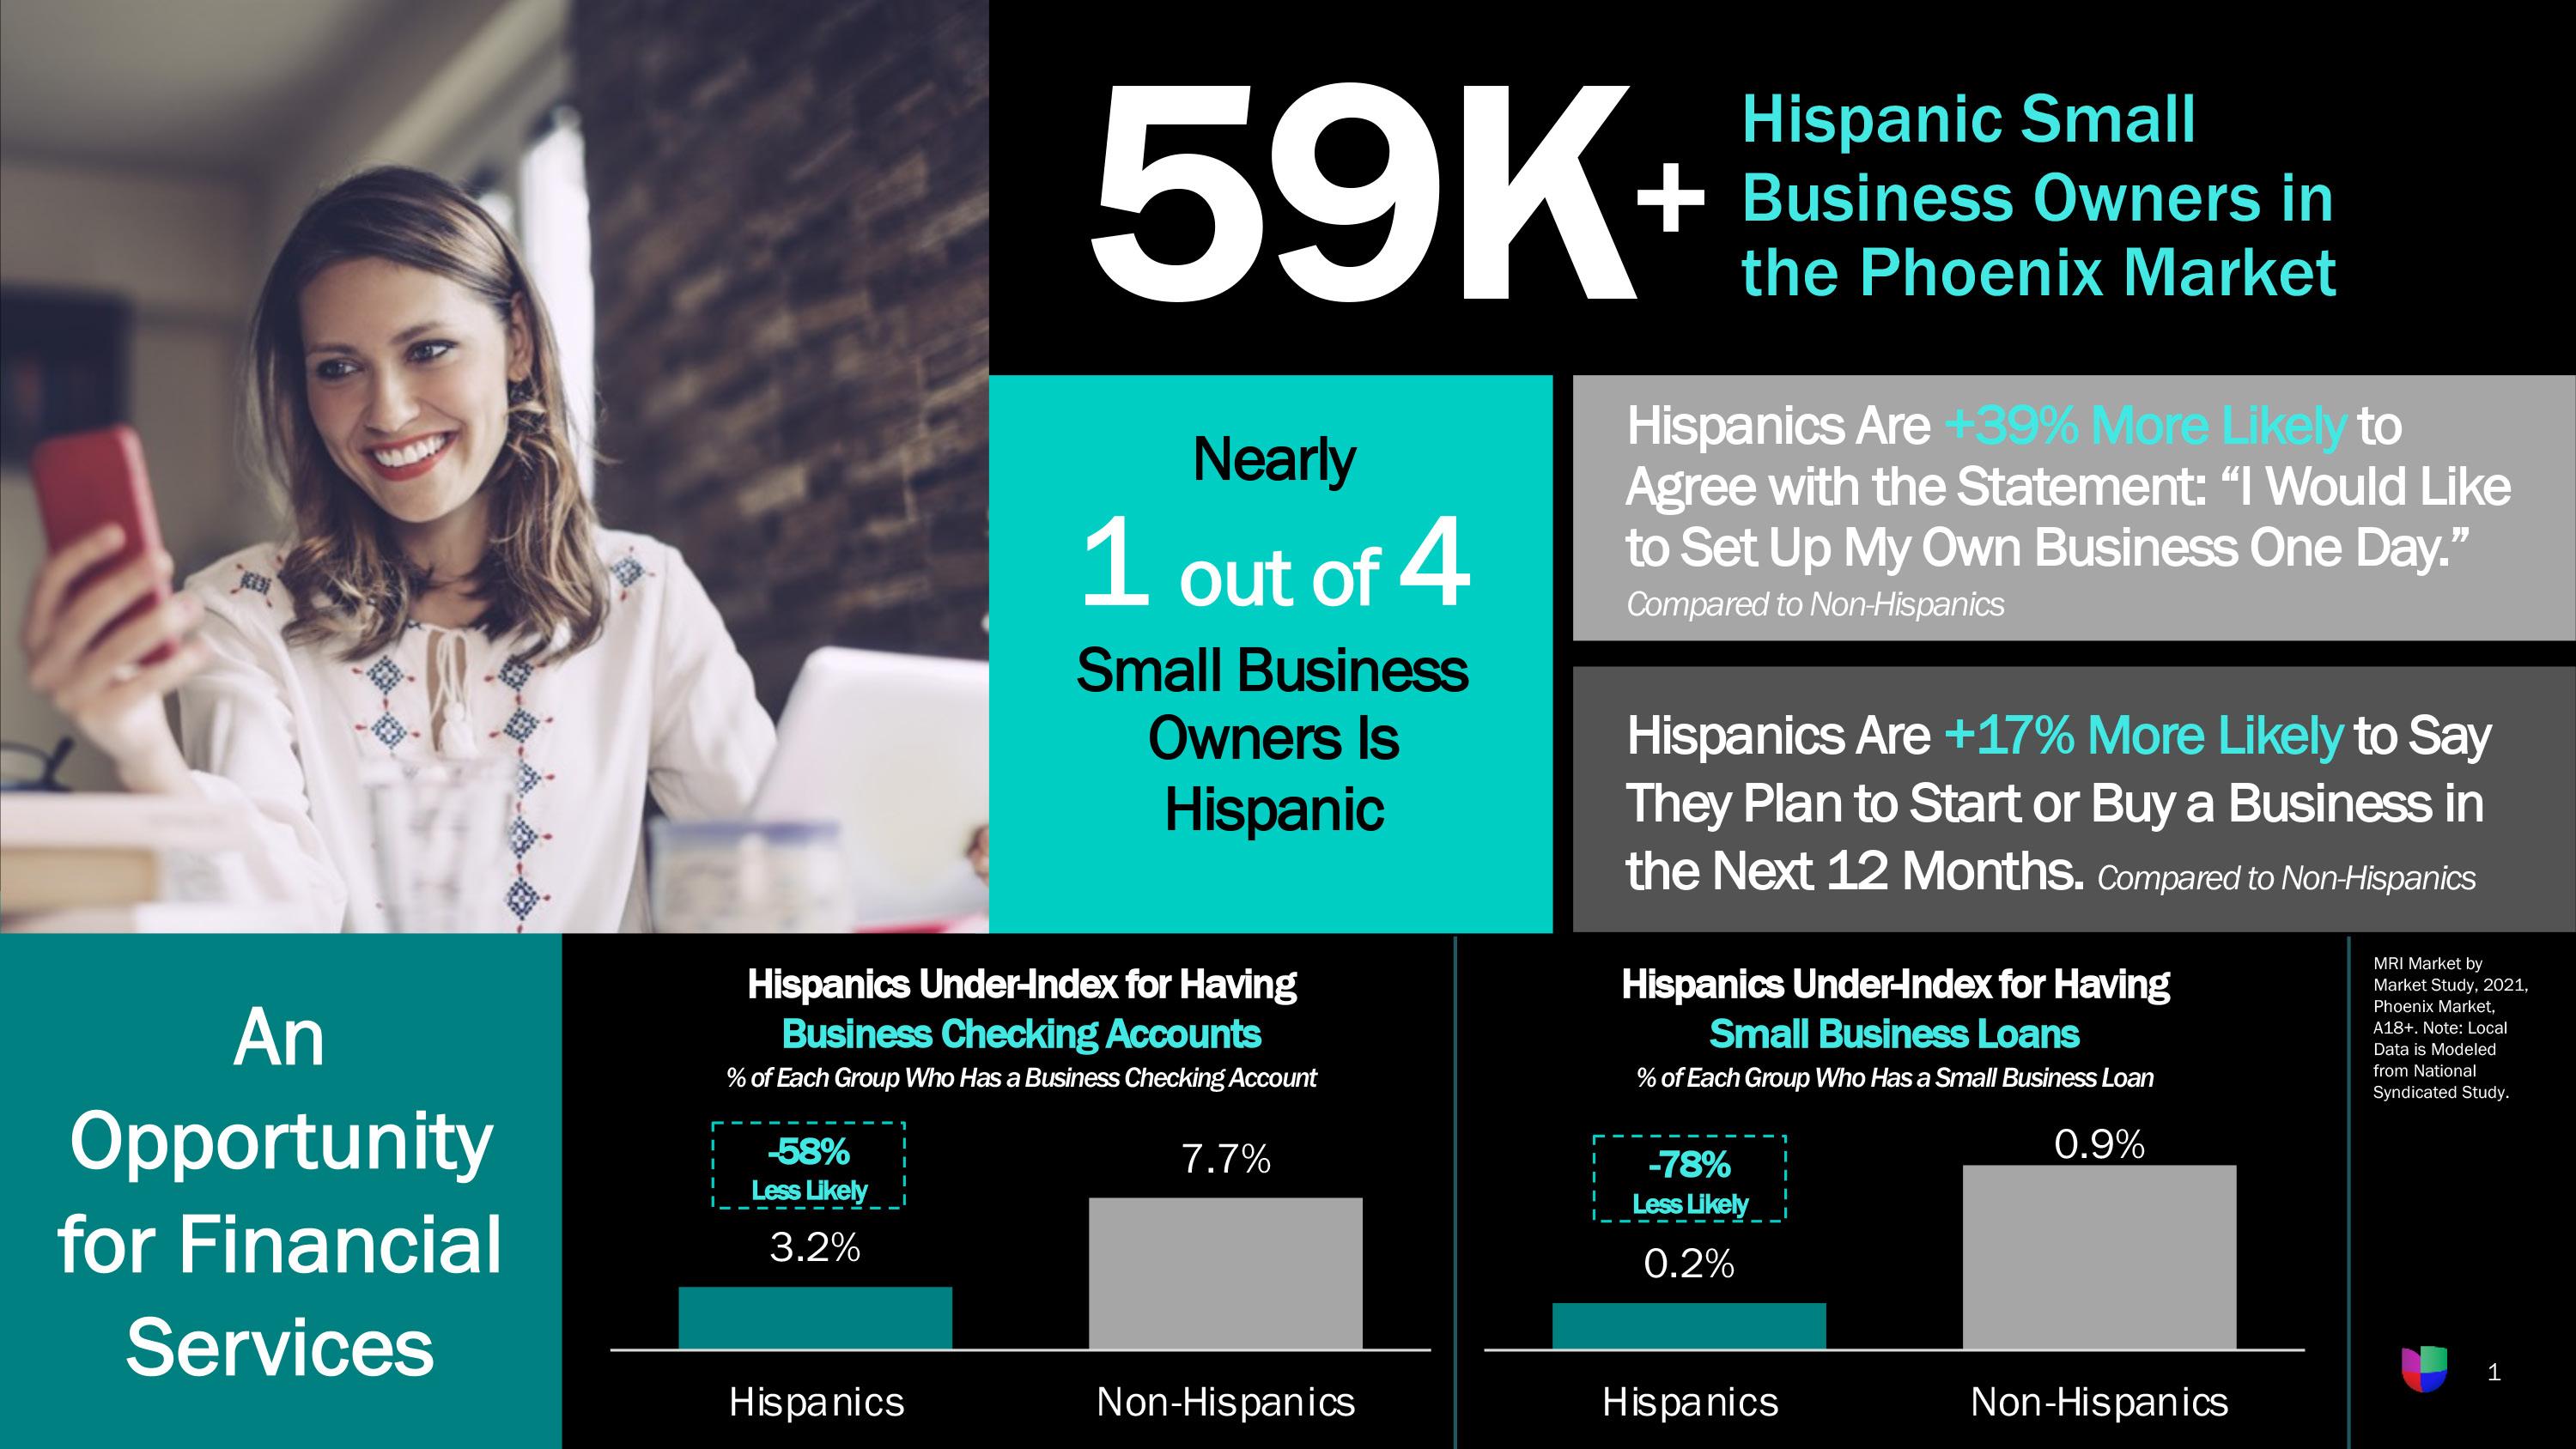
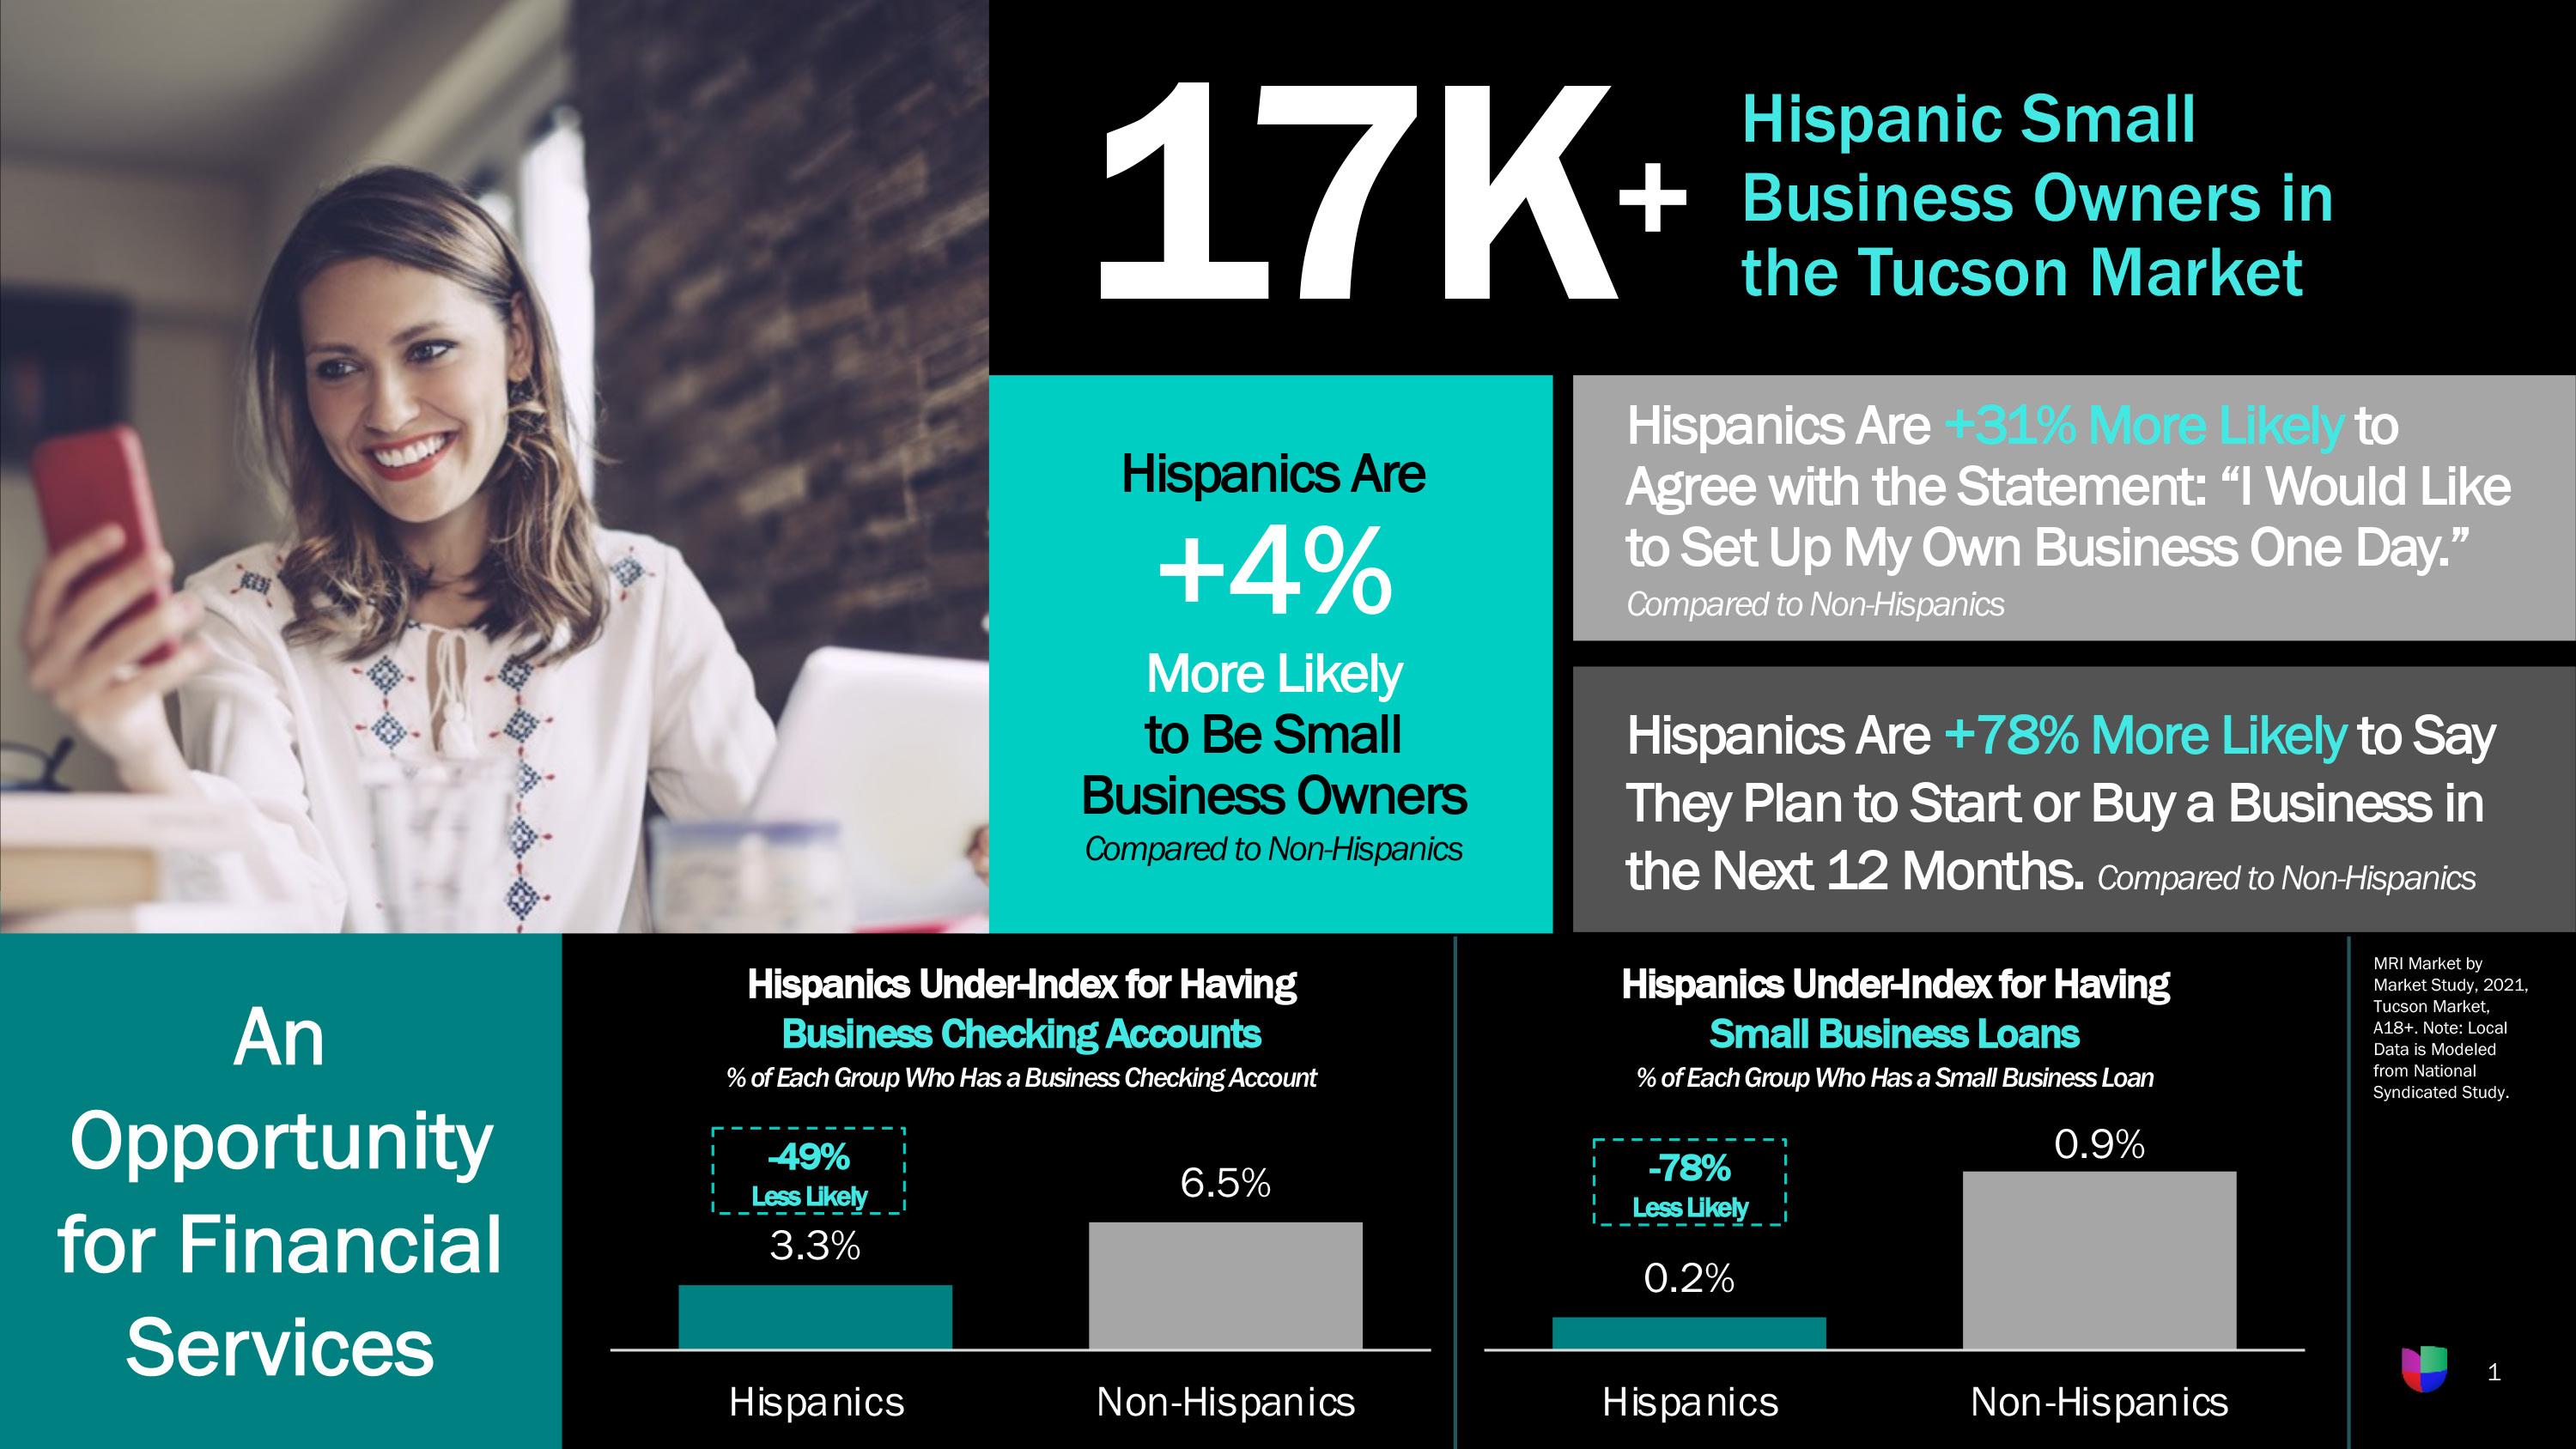
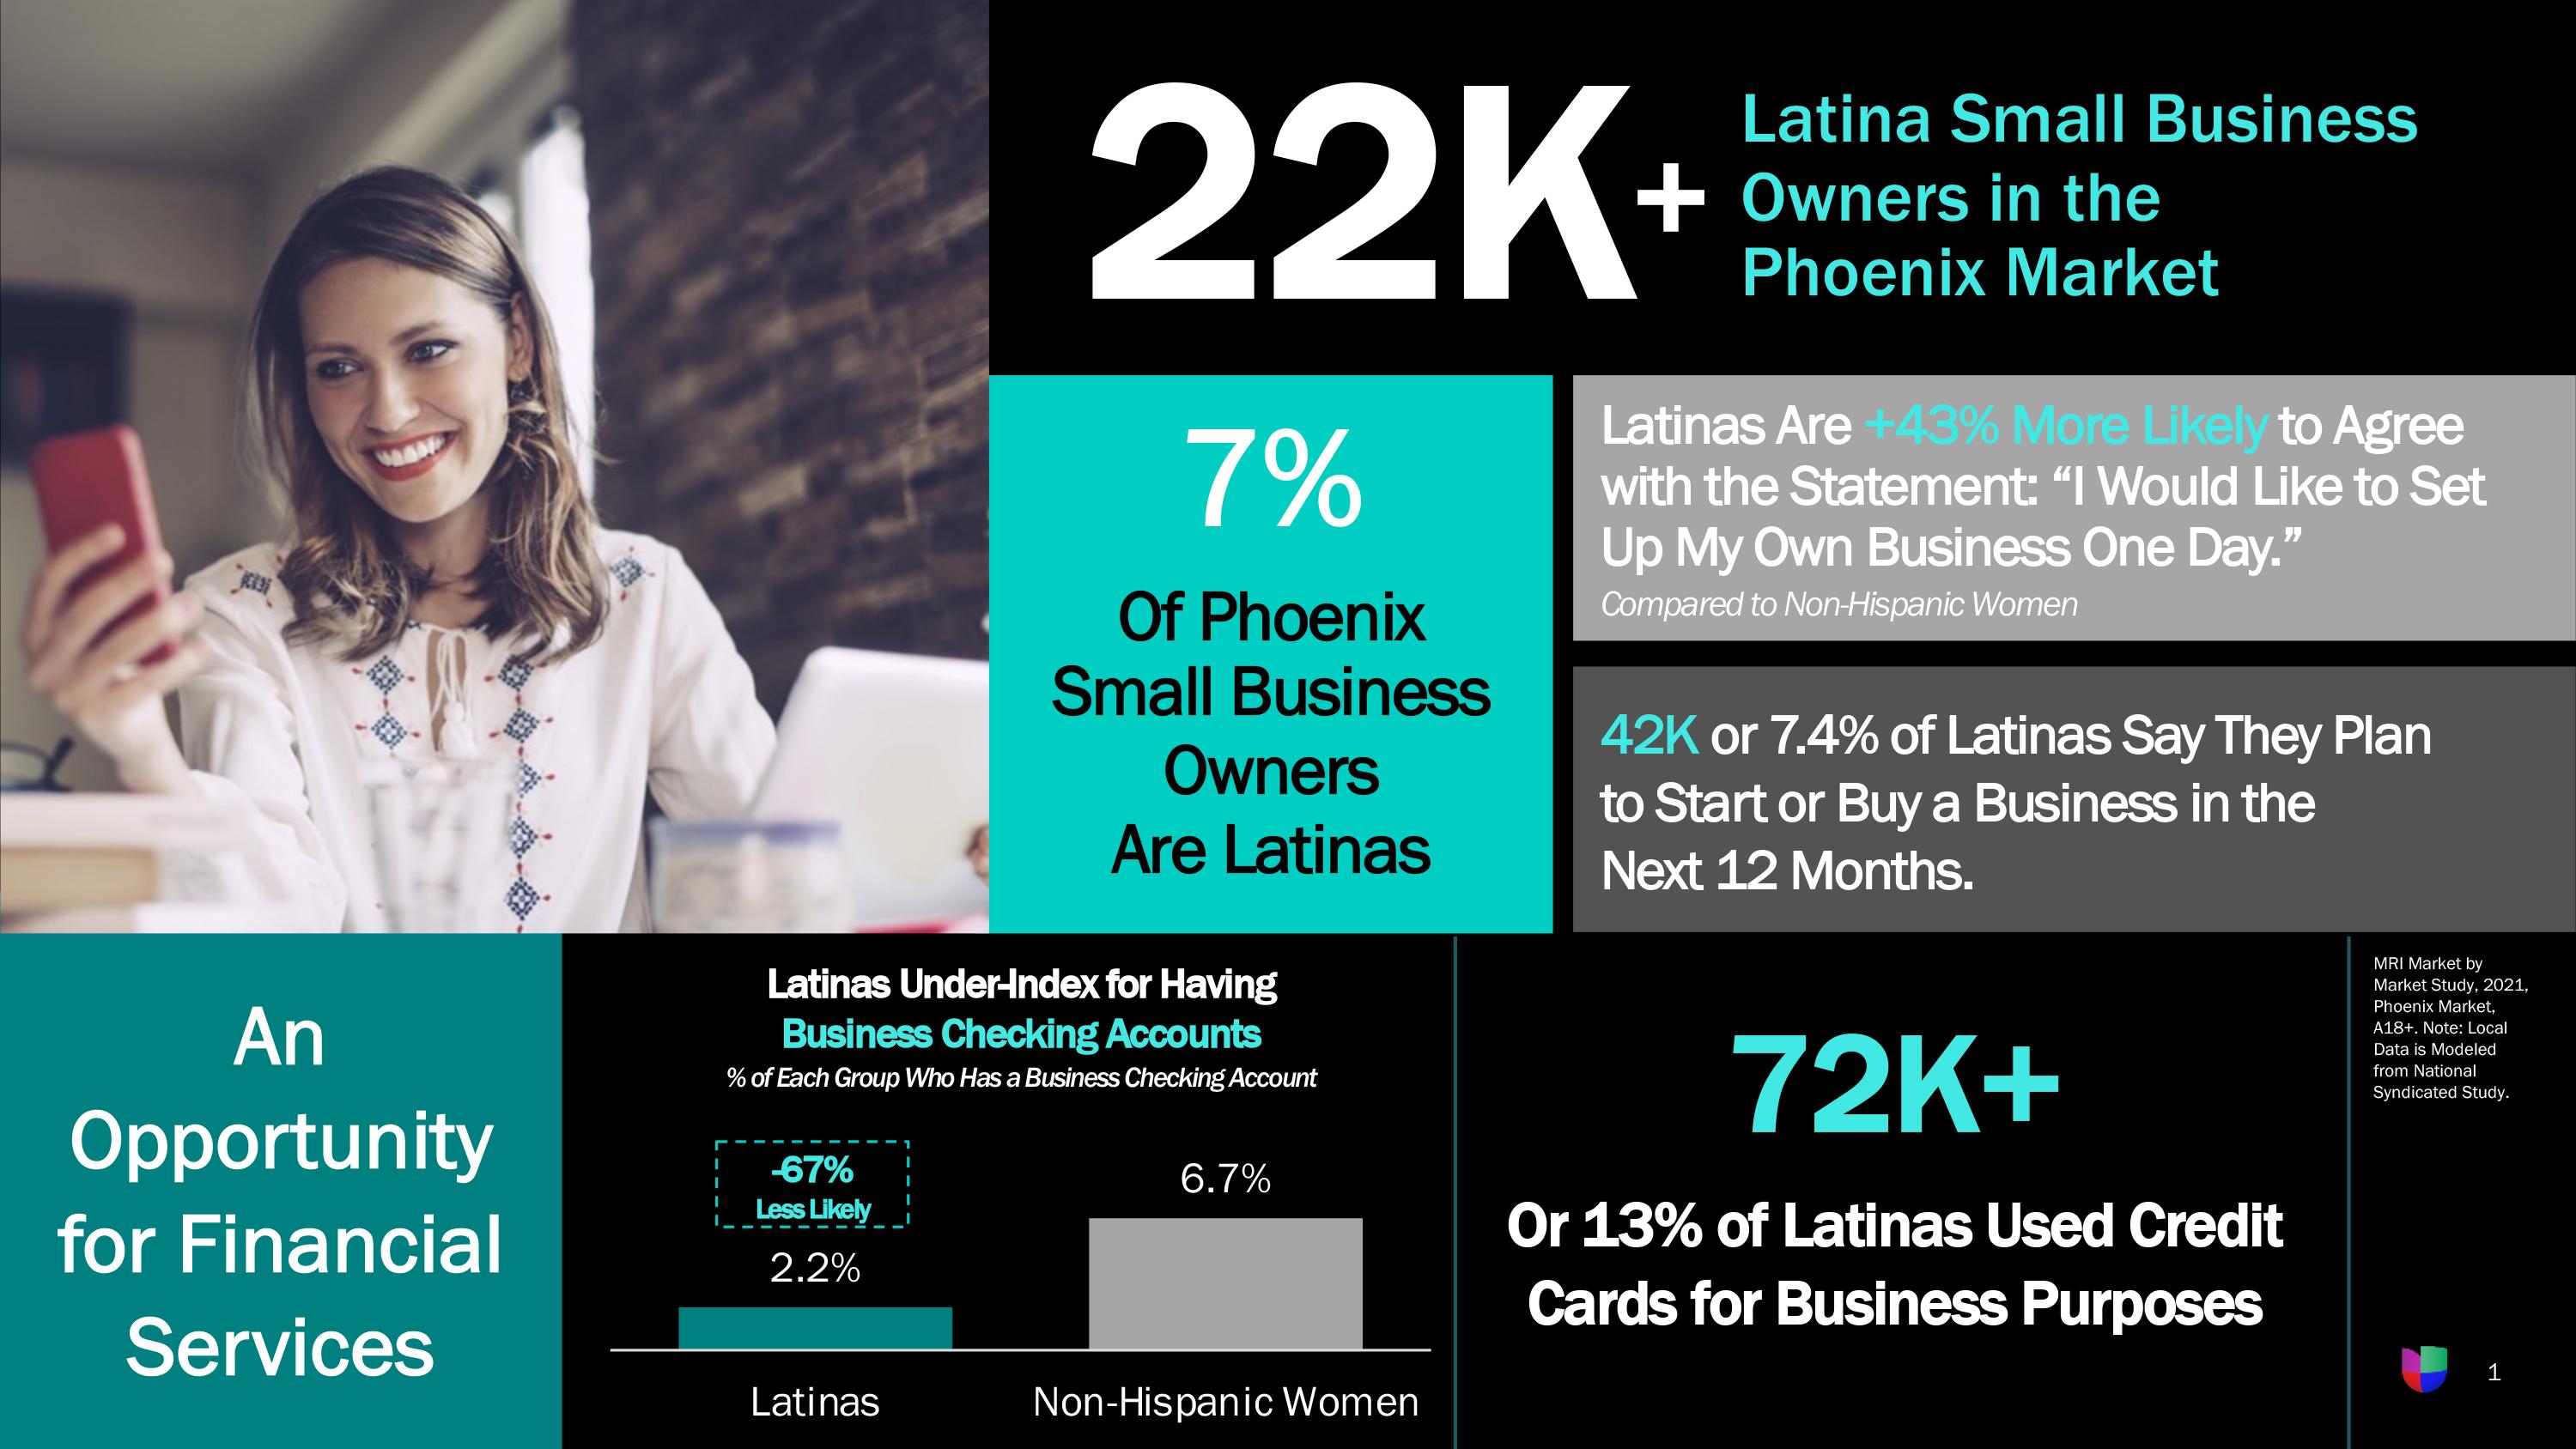
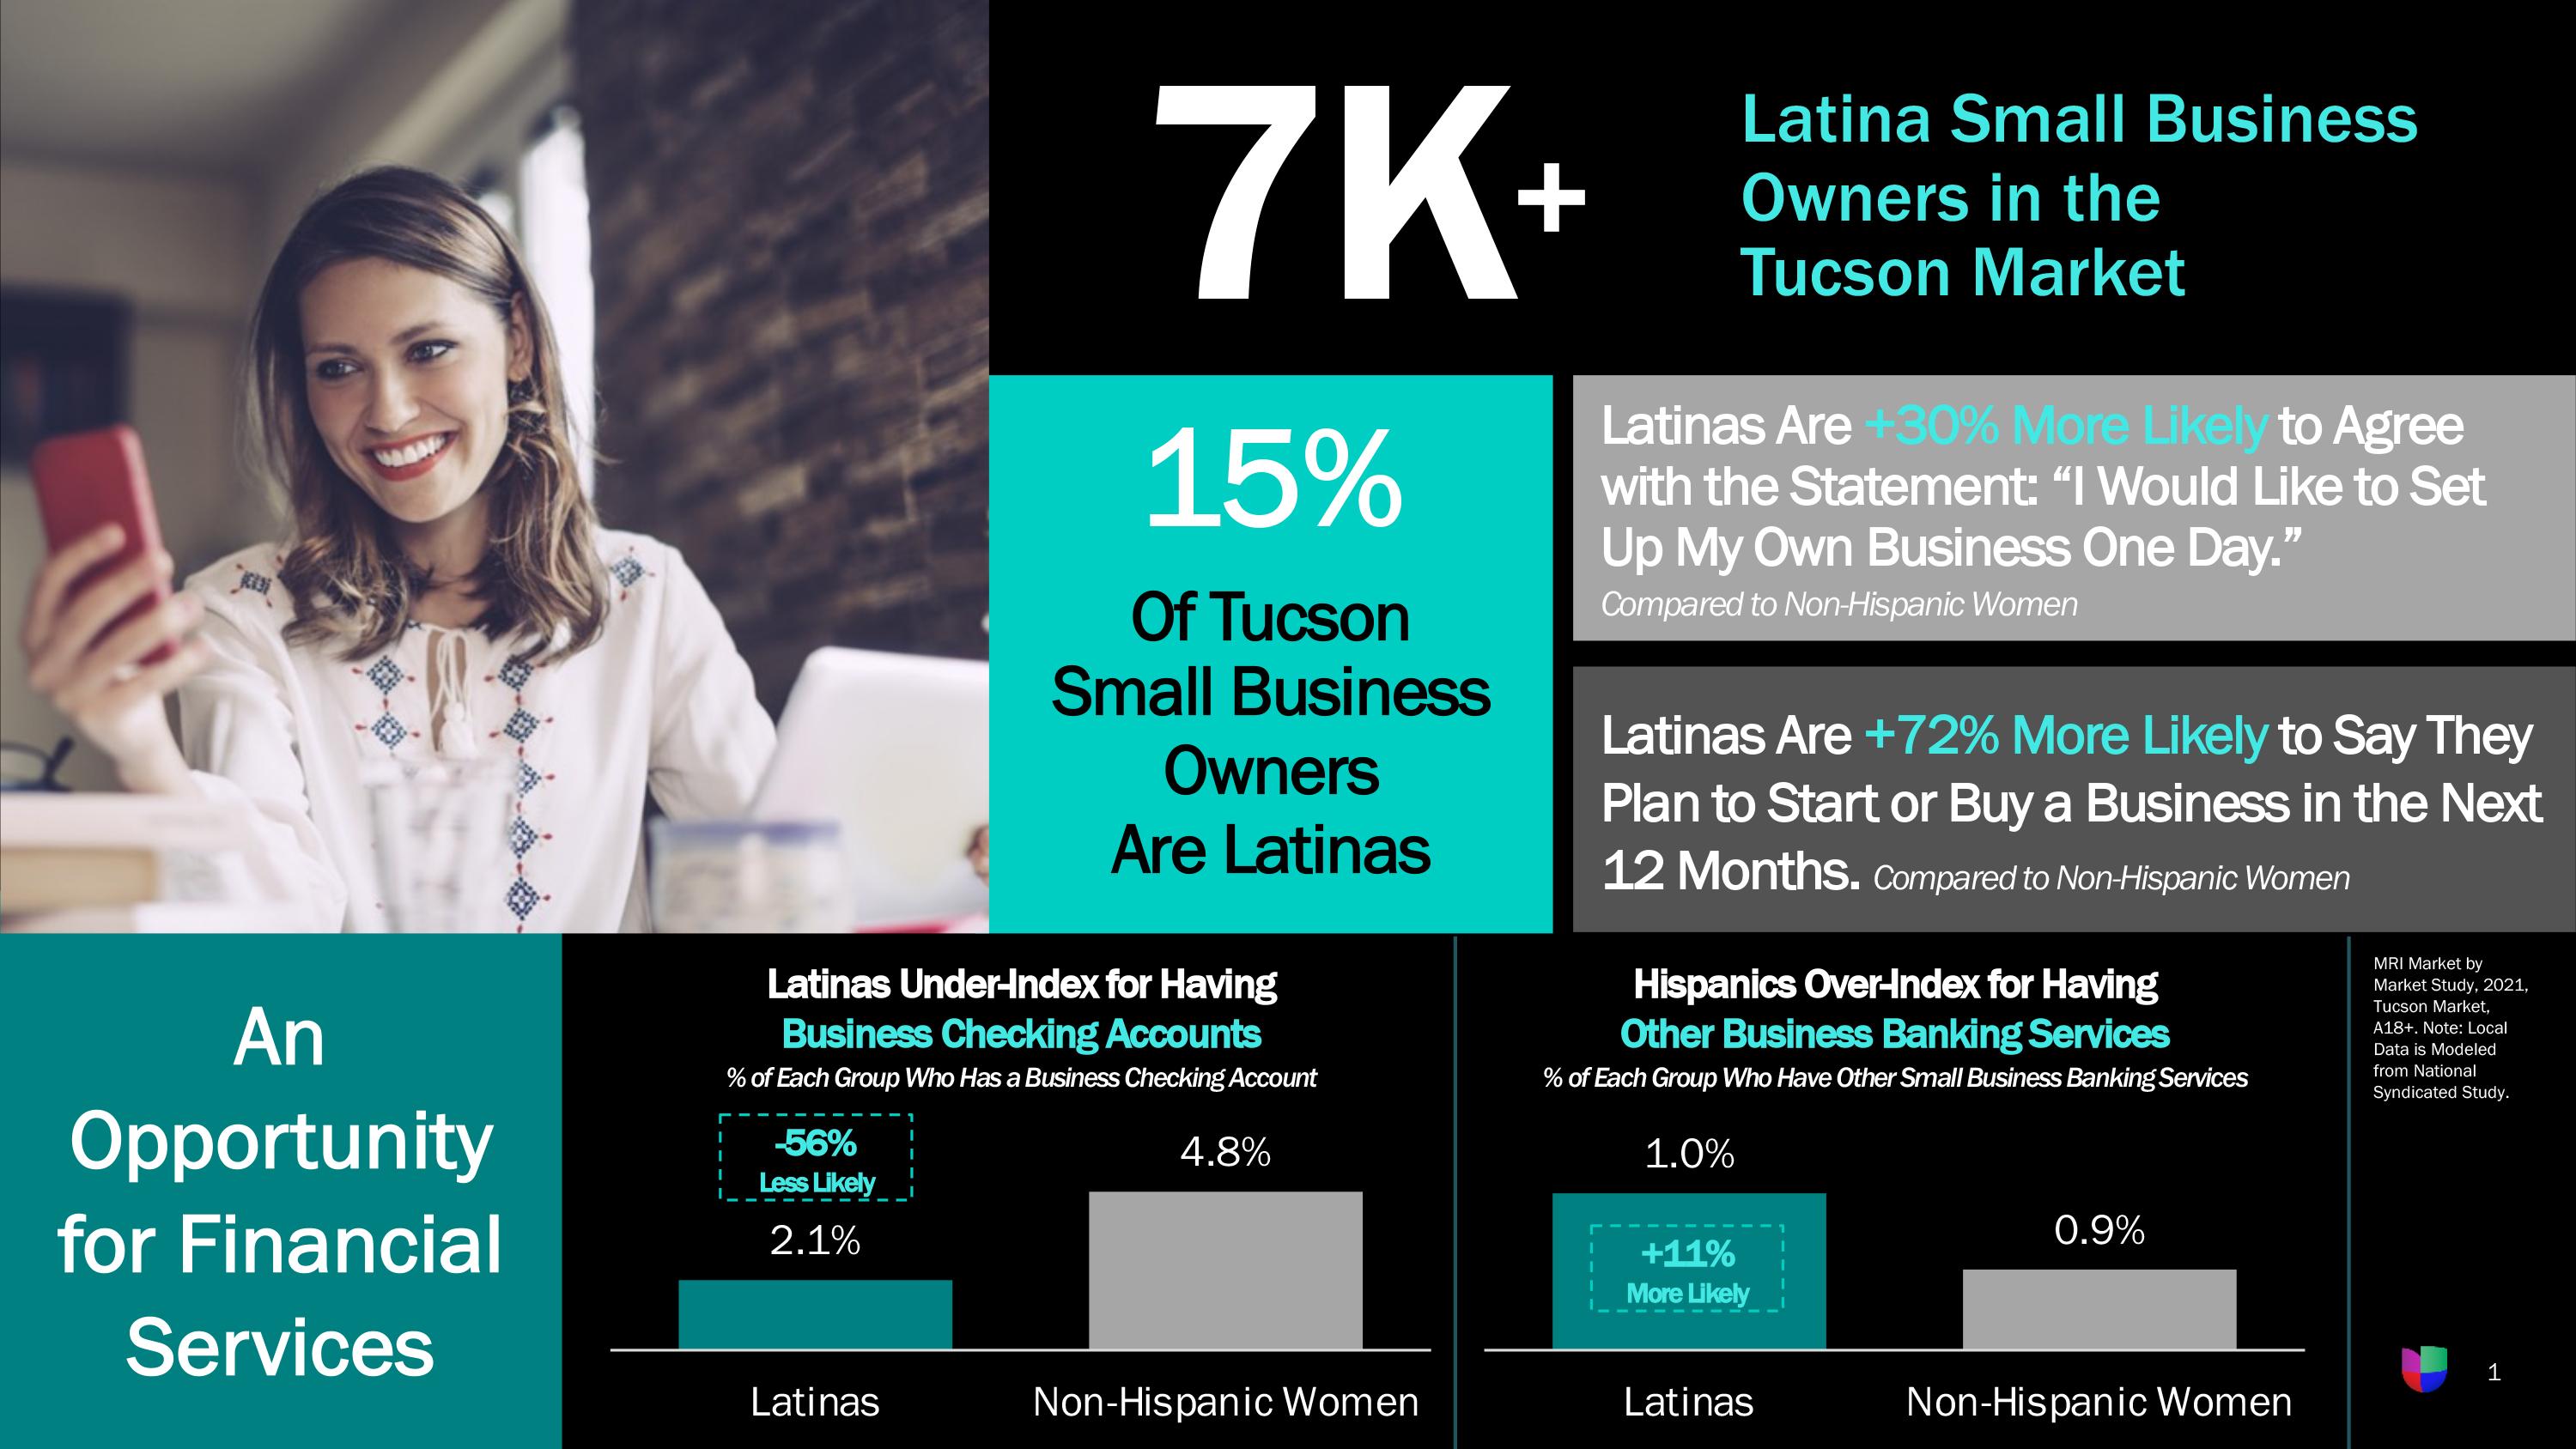
A look at the financial institutions and products Hispanics use in the Phoenix and Tucson markets, courtesy of Univision Communications
An examination of Hispanic employment in the Phoenix and Tucson markets, courtesy of Univision Communications
An analysis of Hispanic spending in the Phoenix and Tucson markets, courtesy of Univision Communications
SUMA TEACHES LATINO YOUTH HOW TO BUILD WEALTH
BY MANUEL JESSE NIETO JR.SUMA uses state-of-the-art technology to give Latinos the financial education they need to prosper
AMI’S MICROLOANS GIVE ENTREPRENEURS A MUCH-NEEDED HELPING HAND
BY EUGENIA TRAKALThe nonprofit Arizona Microcredit Initiative is making a huge difference for Arizona entrepreneurs who want to start or expand their businesses
ARE YOU READY FOR THE BIG GAME?
BY THE ARIZONA SUPER BOWL HOST COMMITTEE STAFF
The Arizona Super Bowl Host Committee is working hard to guarantee that Super Bowl LVII succeeds on every level—from its economic impact to its community engagement
Applied Analysis released a study in February 2022 that shows the positive economic impact Cox Communications has on the Valley of the Sun
IN FOCUS | 60
WHAT HAS COVID DONE TO LATINA ENTREPRENEURS?
This data brief presents the basic facts about the negative effects of the COVID-19 pandemic on Latina entrepreneurs
EXCERPT | 61
2022 MINORITY BUSINESS ENTERPRISE STUDY REPORT
This recent study by the Arizona Hispanic Chamber of Commerce looked at the challenges faced by minorityowned businesses in Arizona, Nevada and Utah
EXCERPT | 64
ARIZONA HISPANIC/LATINO RETIREMENT SECURITY SURVEY
AARP’s retirement security survey shows that Arizona’s Hispanic/Latino voters do not feel financially prepared for retirement
EXCERPT | 66
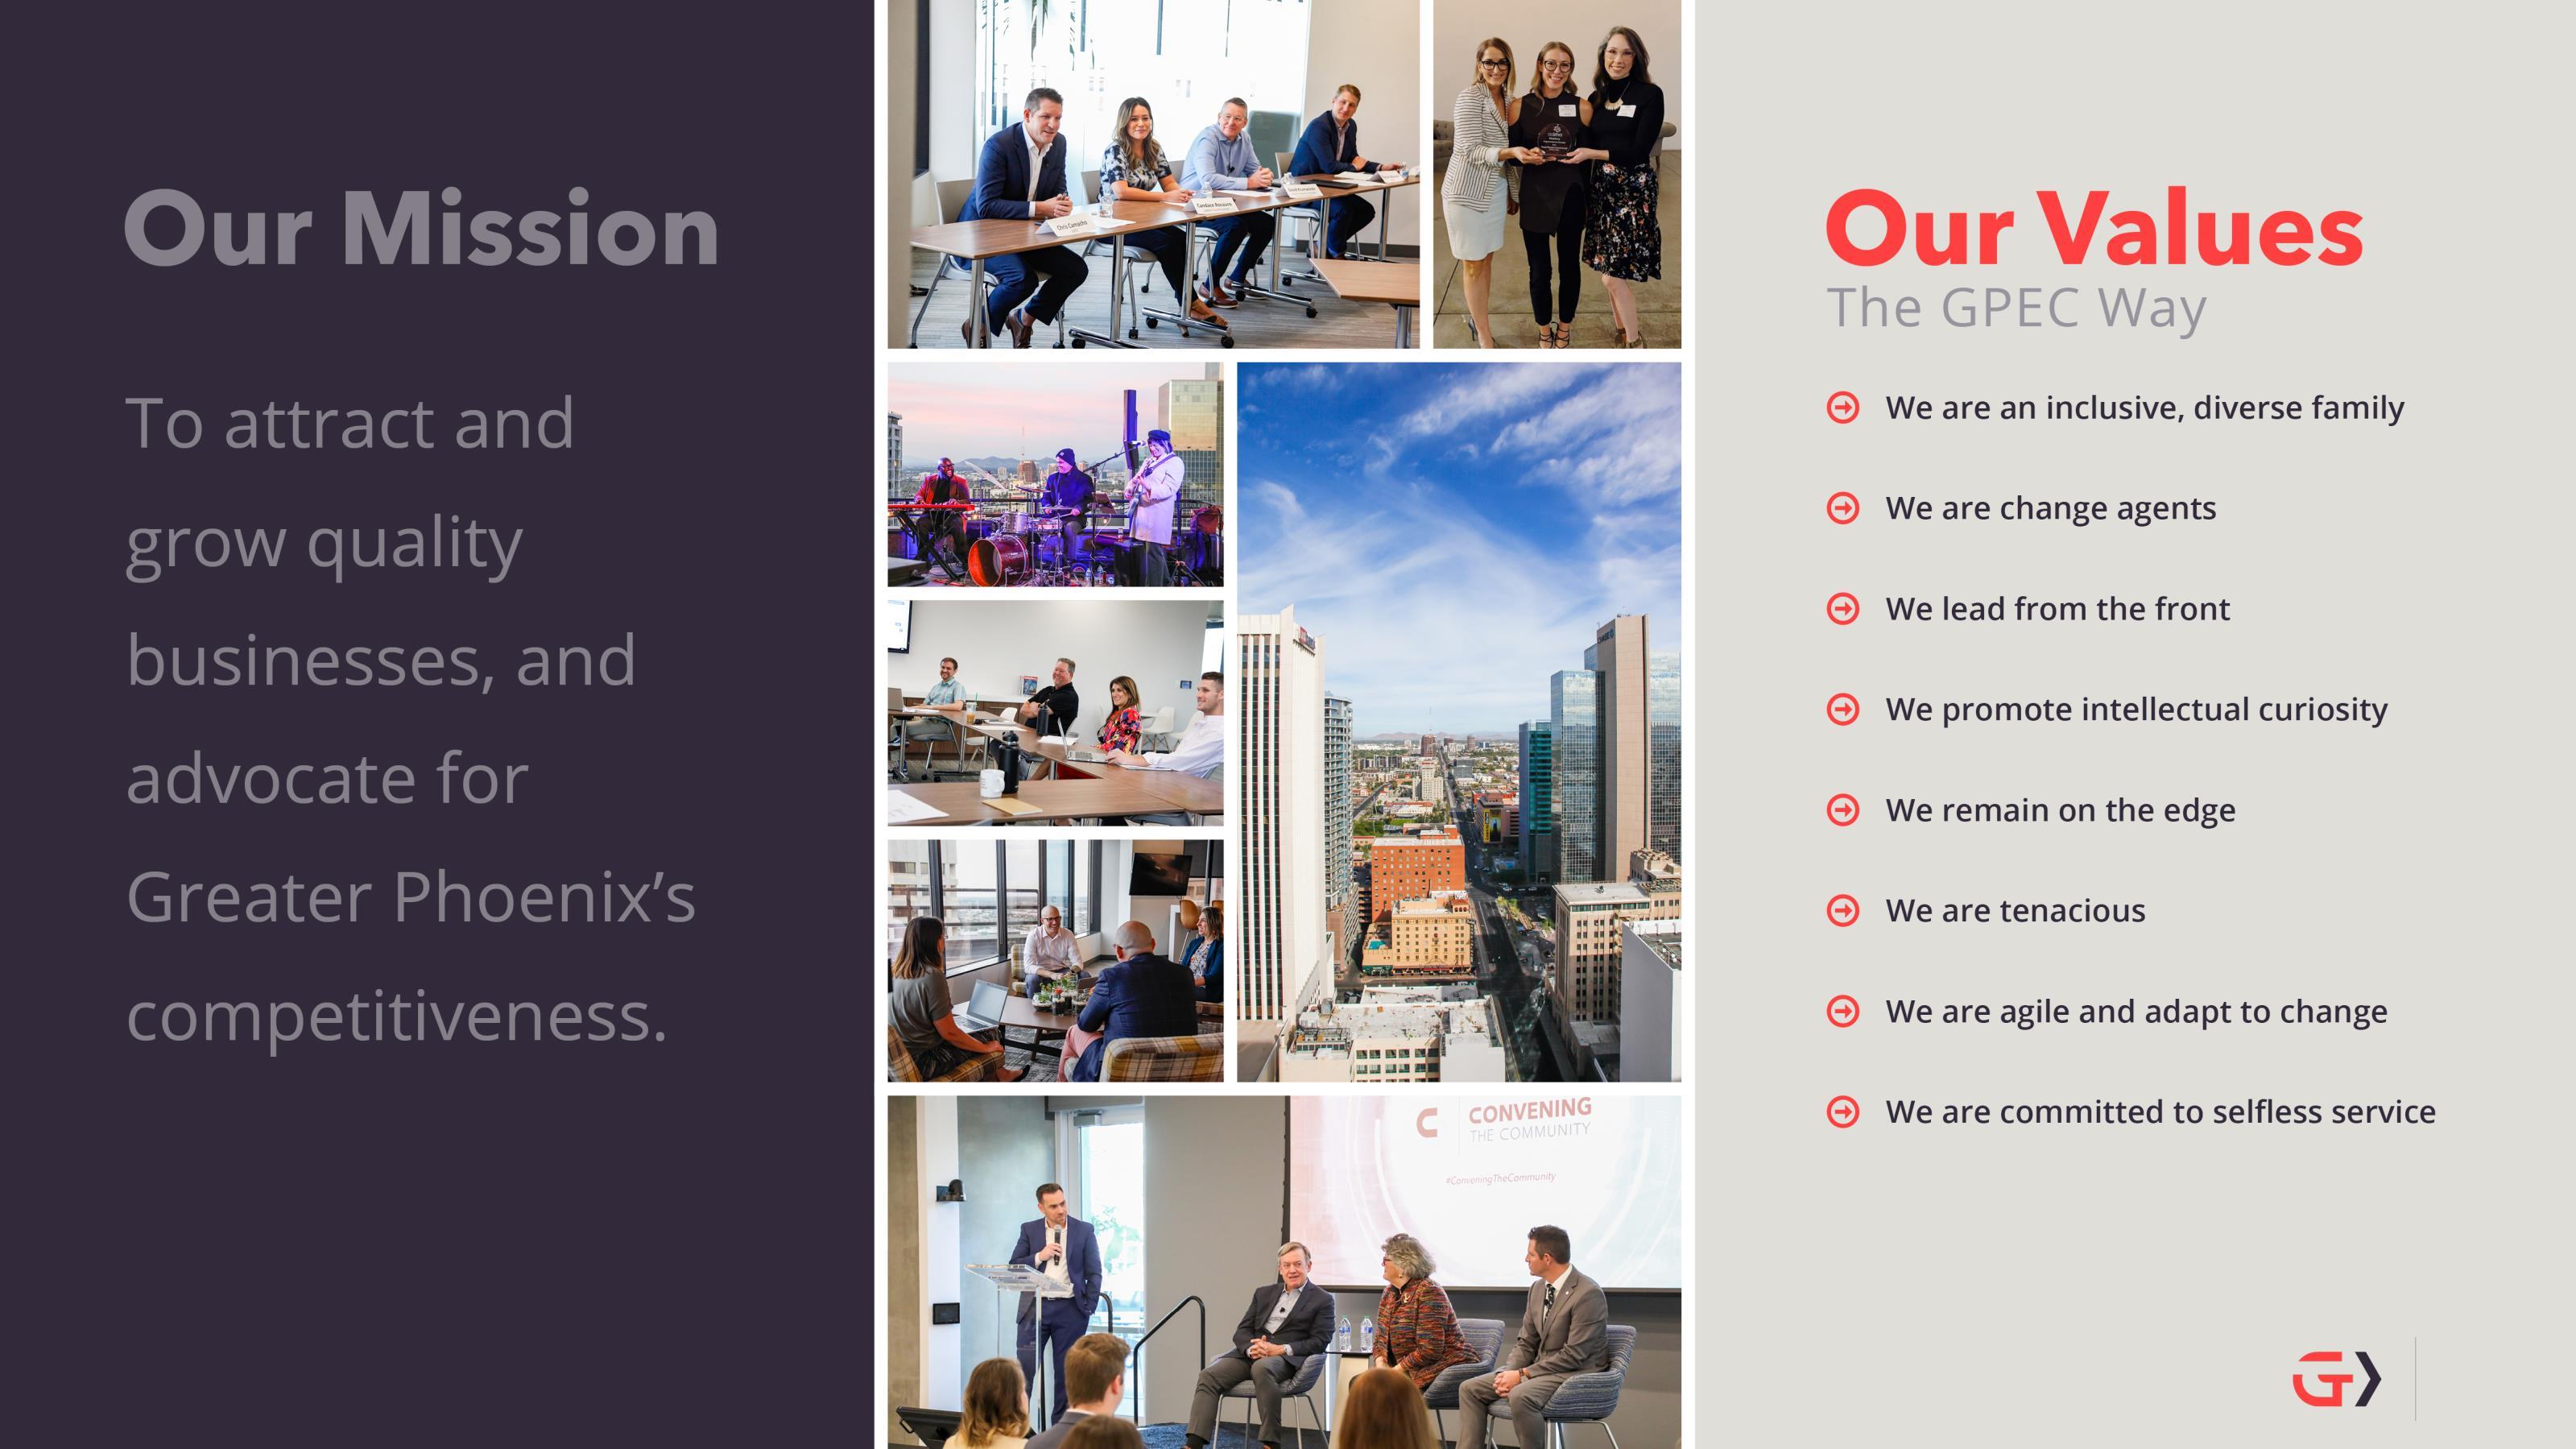
THE GPEC DATOS COMMITTEE
The Greater Phoenix Economic Council is always looking at ways to attract and grow local businesses to keep the Phoenix metro area competitive
EXCERPT | 70
2021 SMALL BUSINESS PROFILE – ARIZONA
A look at the small business climate in Arizona by the U.S. Small Business Administration
EXCERPT | 72
THE CORONAVIRUS PANDEMIC’S ECONOMIC IMPACT
Surveys done by the United States Census Bureau show the devastating effect the pandemic has had across all sectors of the economy
EXCERPT | 74
2021 LDC U.S. LATINO GDP REPORT
The Latino Donor Collaborative offers a factual view of the economic contributions of U.S. Latinos
EXCERPT | 76
2021 STATE LATINO GDP REPORT – ARIZONA
This report uses prior analysis to offer state-level calculations of the economic contributions of Latinos in Arizona
EXCERPT | 80
FACT SHEET: HISPANIC-AMERICAN OWNED FIRMS
The Minority Business Development Agency at the U.S. Department of Commerce offers some quick economic facts
EXCERPT | 82
2021 HISPANIC BUSINESS OWNER SPOTLIGHT
Bank of America asked Hispanic small business owners about the impact of the pandemic, their goals and priorities, and how local communities affect their businesses
In Trillions USD
NUMBERS IN
$21,433 $2,715
$18,718
$1,703 U.S. ECONOMY LATINO ECONOMY NON - LATINO ECONOMY 2010 2019
16% 46% 26% 8% 3% 36% 46% 12% 5% 2% LARGE
NEGATIVE EFFECT
NO E F FECT MODERATE
POSITIVE EFFECT LARGE POSITIVE EFFECT
L I TTLE OR NO E F FECT MODERATE POSITIVE EFFECT
LARGE POSITIVE EFFECT
LATINO WHITE
Source: Graduate School of Stanford Business, Latino Entrepreneurship Initiative, 2021 Research Report, "State of Latino Entrepreneurship," Marlene Orozco and Jonathan Furszyfer, principal investigators https://www.gsb.stanford.edu/sites/default/files/publication/pdfs/report-2021-state-of-latino-entrepreneurship.pdf
NUMBERS IN MILLIONS USD
Source: Stanford Graduate School of Business, Latino Entrepreneurship Initiative, "State of Latino Entrepreneurship," Marlene Orozco and Jonathan Furszyfer, principal investigators www.gsb.stanford.edu/sites/default/files/publication/pdfs/report-2021-state-of-latino-entrepreneurship.pdf
Source: Graduate School of Stanford Business, Latino Entrepreneurship Initiative, 2021 Research Report, "State of Latino Entrepreneurship," Marlene Orozco and Jonathan Furszyfer, principal investigators https://www.gsb.stanford.edu/sites/default/files/publication/pdfs/report-2021-state-of-latino-entrepreneurship.pdf
TOP REASONS BUSINESS FINANCING IS SOUGHT LATINOS VS. WHITES
BY PERCENTAGE
MEET OPERATING EXPENSES EXPAND BUSINESSES OR PURSUE NEW OPPORTUNITY
Source: Stanford Graduate School of Business, Latino Entrepreneurship Initiative, "State of Latino Entrepreneurship," Marlene Orozco and Jonathan Furszyfer, principal investigators www.gsb.stanford.edu/sites/default/files/publication/pdfs/report-2021-state-of-latino-entrepreneurship.pdf
Source: Graduate School of Stanford Business, Latino Entrepreneurship Initiative, 2021 Research Report, "State of Latino Entrepreneurship," Marlene Orozco and Jonathan Furszyfer, principal investigators https://www.gsb.stanford.edu/sites/default/files/publication/pdfs/report-2021-state-of-latino-entrepreneurship.pdf
OUTSTANDING BUSINESS DEBT LATINOS VS. WHITES 37% 32% 17% 10% 3% 1%
By percentage
43% 28% 15% 9% 3% 1% $0 $25,000 OR LESS $25,001 – $100,000 $100,001 –$250,000 $250,001 –$1,000,000 MORE THAN $1,000,000 LATINO WHITE
Source: Stanford Graduate School of Business, Latino Entrepreneurship Initiative, "State of Latino Entrepreneurship," Marlene Orozco and Jonathan Furszyfer, principal investigators www.gsb.stanford.edu/sites/default/files/publication/pdfs/report-2021-state-of-latino-entrepreneurship.pdf
Source: Graduate School of Stanford Business, Latino Entrepreneurship Initiative, 2021 Research Report, "State of Latino Entrepreneurship," Marlene Orozco and Jonathan Furszyfer, principal investigators https://www.gsb.stanford.edu/sites/default/files/publication/pdfs/report-2021-state-of-latino-entrepreneurship.pdf
Source: U.S. Small Business
NUMBERS IN TRILLIONS USD

ARIZONA, CALIFORNIA, FLORIDA, ILLINOIS, NEW JERSEY, NEW MEXICO, NEW YORK, AND TEXAS COLLECTIVELY CONTAIN NEARLY THREE-QUARTERS OF THE NATION’S LATINO POPULATION. THIS REPORT PROVIDES DETAILED ANALYSIS OF THE STATE-LEVEL LATINO GDP s FOR THESE 8 STATES, BENCHMARKED AGAINST THE BROADER U.S. LATINO GDP.
Source: 2021 State Latino GDP Report, Arizona Executive Summary https://www.uclahealth.org/ceslac/workfiles/Latino-GDP/2021/Arizona_ExecSummary_.pdf
Source: California Lutheran University and UCLA Health Center for the Study of Latino Health and Culture, “2021 State Latino GDP Report – Arizona,” Dan Hamilton, Matthew Fienup, David Hayes-Bautista and Paul Hsu www.uclahealth.org/ceslac/workfiles/Latino-GDP/2021/Arizona_ExecSummary_.pdf
Arizona, California, Florida, Illinois, New Jersey, New Mexico, New York, and Texas collectively contain nearly three-quarters of the Nation’s Latino population. This report provides detailed analysis of the state-level Latino GDPs for these 8 states, benchmarked against the broader U.S. Latino GDP.


U.S. Latinos currently are the second largest ethnic group in the U.S. According to the 2020 U.S. Census, there are 62.1 million Latinos in the U.S.—and this number is predicted to grow to 119 million by 2060. Consider these additional facts: The estimated Latino contribution to U.S. gross domestic product is $2.7 trillion and 85% of new American businesses are started by Latinos.
Latino Millennials (born between 1980 and 1995) and Gen Z (born between 1996 and the early 2010s) hold the key to significant financial growth in the immediate and long-term future. U.S. financial services have failed in the past to successfully attract, retain and increase the number of young Latino customers mostly because they do not address the group’s unique needs or speak directly to the Latino experience.
When it comes to banking and personal finance, U.S. Latinos are less likely to trust the financial system. Historically, discriminatory banking practices and inaccessible services have spread mistrust, causing approximately 50% of Latinos to not put their money in an established bank. Because of this situation, convincing Latinos to trust banks takes a combination of community building to foster trust and financial education coupled with state-of-the-art technology designed by the community for the community.
Fortunately, SUMA can help change this entrenched attitude against the banking industry. SUMA is a wealth building and financial education platform for Latino youth that was cofounded in 2020 by CEO Beatriz Acevedo and chairman Xavier A. Gutiérrez. Acevedo is a proud bilingual Latina entrepreneur, a community builder, a multi-award-winning producer and a cultural strategist. Gutiérrez is an experienced dealmaker, a business executive, a private equity investor, a commercial banker and a capital markets professional. They created SUMA to provide young Latinos with a solid financial education via in-culture content, financial technology tools and digital experiences—packaged on a highly engaging digital platform.
Based on these statistics, SUMA’s grand mission is to place a savings, investment and retirement account in every Latino household in the U.S. While SUMA’s vision is to close the Latino wealth gap, the SUMA platform is designed to offer its users smart suggestions and tools to increase their financial knowledge.
SUMA is a leader when it comes to using technology for financial education. The SUMA app, for example, which contains features that are informed by the Latino community, combines financial technology and educational technology on one platform. The SUMA Wealth Building Membership Badge, offered via a nonfungible token (NFT), grants VIP access to a complimentary one-year subscription to the SUMA app, providing the ability to unlock personalized artificial intelligence (AI) financial insights, invitations to Dinero Academy workshops and exclusive access to upcoming moneymaking experiences and events.


Another educational platform is the SUMA Academy. This platform helps users overcome money challenges and prepares them for a more prosperous future through culturally relevant content and virtual experiences. It provides financial education through entertainment and culture, offers users certificates from Arizona State University and proof of learning protocol (POLP) on the blockchain.
The SUMA Dinero Bootcamp brings financial literacy through funfilled, on-demand virtual experiences like its NFT challenge. Here, students compete to be the first in their group to finish the course and be named “Baller of the Class.” The winner will unlock access to an exclusive NFT designed just for them.
SUMA currently has more than 500,000 engaged users in the United States. They assist members of their community with questions pertaining to purchasing a home, paying off debt and even creating and/or purchasing NFTs.
By creating culturally relevant content, virtual experiences and providing financial tools, SUMA demystifies and reimagines financial inclusion. Through entertainment, it aims to become a trusted source to help the Latino community overcome their current financial challenges and create a more prosperous future.
Although SUMA is making tremendous progress to close the wealth gap, there is still a lot more work that must be done. If not now, when? We believe that future generations will depend on the
financial education that SUMA provides today—not only to prosper, but to survive.

Manuel Jesse Nieto Jr. is a second-generation Mexican American, who was born and raised in Southern California. He is a writer and producerwho hasworked on showsforDisneyand Netflix. He currently is creating an unscripted series that highlights the strengths of the Latinx community. He can be reached onTwitter: @ManuelNietoJr1.
SUMA WEALTH
CONTACT: sumawealth.com/contact-us
GET THE APP: app.sumawealth.com/auth/register sumawealth.com
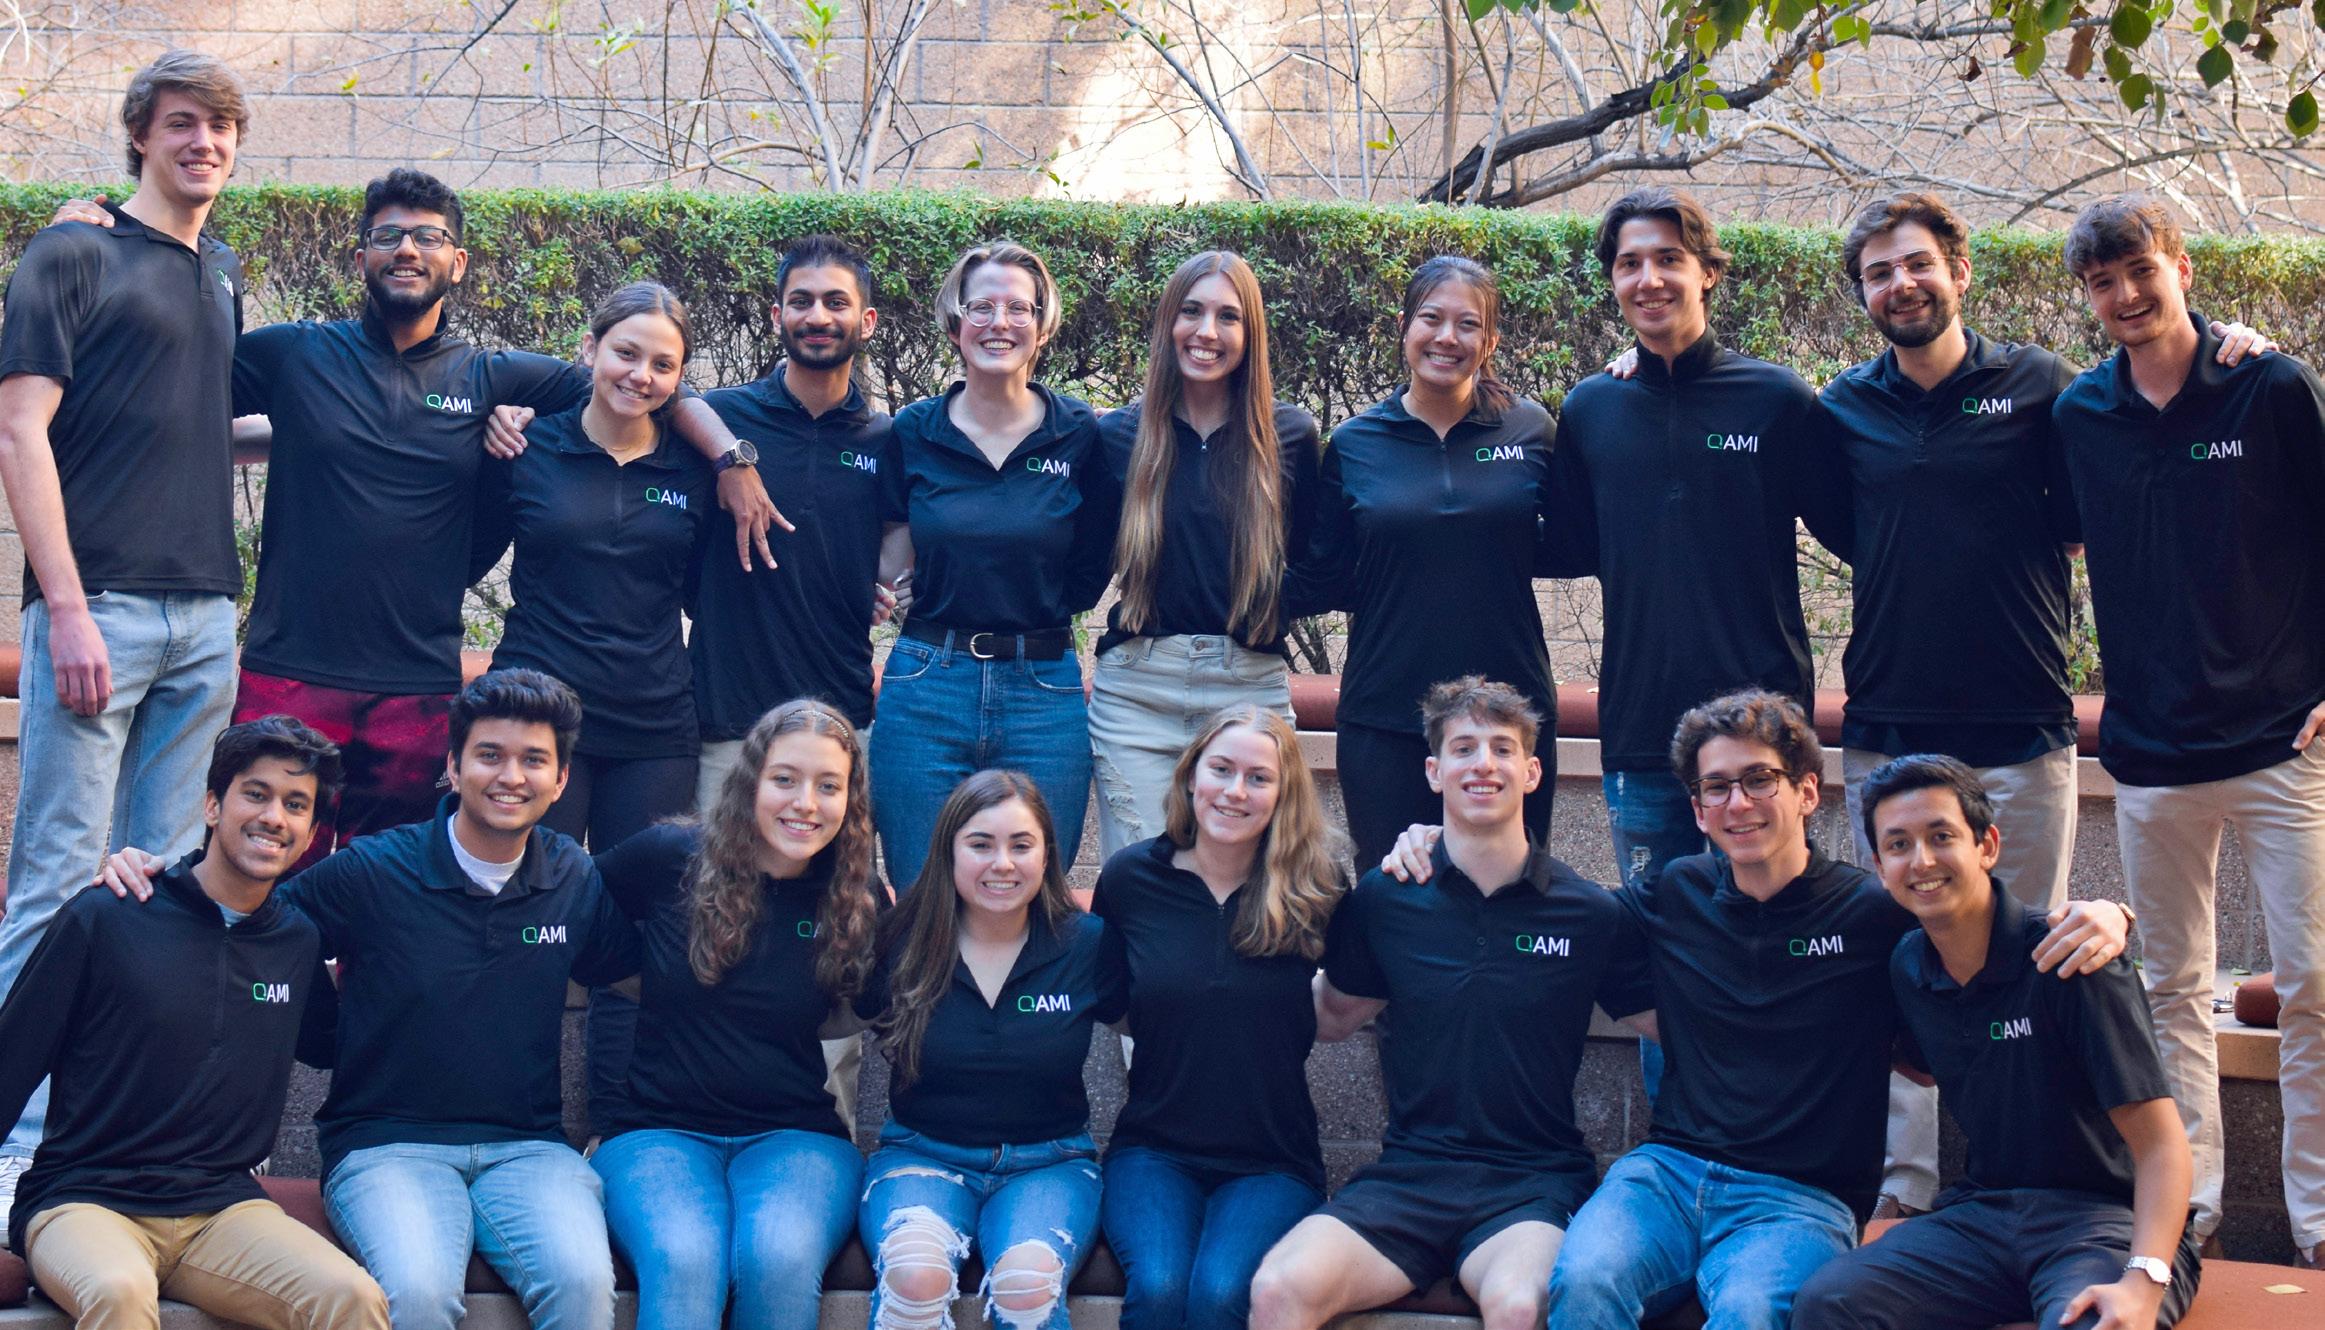
BY EUGENIA TRAKAL
Founded in 2011, the Arizona Microcredit Initiative (AMI) is entering its 11th year as a nonprofit assisting underserved entrepreneurs. AMI is affiliated with Arizona State University and its mission is to empower these entrepreneurs to start or expand businesses through free consulting services, microloans with low interest rates and educational resources. The company’s vision is to promote an Arizona where neither a challenging background nor a lack of resources can stand in the way of a passionate, entrepreneurial spirit.
Throughout the past decade, AMI has consulted with more than 75+ entrepreneurs, provided more than $75,000 in loans to 15 small businesses and created 40+ educational blog posts on business topics. The organization prides itself for its microloans: It funds entrepreneurial dreams while promoting self-sufficiency and business development through its loan pool, which offers lowinterest rate microloans up to $5,000 to fund hard assets essential to an entrepreneur's business operations.
Along with microlending, AMI staff members have helped build and expand many local businesses, include including restaurants, clothing lines and even an organic janitorial service. With a diverse clientele, AMI has also contributed to the success of minorityowned businesses such as the Million Dollar Teacher Project (MDTP). The MDTP was founded by Lloyd Hopkins in 2016 to elevate the teaching profession through increased support, compensation and recognition. It has served nearly 1,000 students and impacted 3,000 teachers.
“AMI helped us develop processes to better track and evaluate our impact, and develop tools to better understand our economic impact,” Hopkins says. “The professionalism of the AMI team is
unmatched. Their enthusiasm for our projects make our work together very enjoyable. We have a relationship that allows us to learn from each other and grow together.”
With the support of AMI, MDTP won the 2018 East Valley NAACP Education Equity Award and a $540,000 investment from the Department of Education in 2021.
“AMI has contributed to our overall growth,” Hopkins says, “from being a sounding board reviewing our business plan to being a partner helping us put processes in place to ensure the sustainability of our work.”
Leading this project is Zain Sidhwa, the current director of operations. When asked about his work, Sidhwa says, “As students, working with local, social enterprises such as the Million Dollar Teacher Project, we can truly see the tangible results of our efforts in the community surrounding us. We have an incredible opportunity to apply our academic and professional experiences to real-world pro bono consulting engagements.
“A few notable projects we’ve worked on recently,” Sidhwa says, “include a financial model to aid with revenue forecasting and a metric collection coupled with a fundraising pitch deck to adequately quantify their impact. Over our 3+ year relationship with Lloyd Hopkins, we’ve been able to see the organization grow from proof of concept to partnering with numerous schools, taking on new initiatives and touching the lives of over 30,000+ students and 2,500+ teachers in disadvantaged areas.”
AMI works with city-affiliated partners, entrepreneurial support partners and financial partners ranging from the Gilbert Chamber of Commerce, the City of Scottsdale Economic Development Department, the FABRIC Incubator, ASU Changemaker Central, Local First Arizona, Kiva and SEED SPOT.
“Given that AMI is now moving into its second decade of service,” Executive Director Kiran Ramakumar says, “the organization is looking to continue its effective client work, increase our visibility in the Phoenix area and continue to expand the impact of the organization.”
This April, SEED SPOT featured AMI staff members as speakers at their Startup Spring Training. Former Executive Director Nicole Harris and Director of Consulting Morgan Pearson made presentations to more than 20 entrepreneurs (60% Hispanic or Latino, 15% African-American and 56% women) about business registration and how to register as a 501(c)(3) nonprofit. Ramakumar and Senior Associate Monet Tam later spoke about the business model canvas and value proposition to an audience mainly composed of traditionally underrepresented entrepreneurs. A majority of the attendees later also scheduled separate consultations with AMI.
Looking back on the organization’s impact, Harris says, “Our motto as a team is to ‘Take the Initiative.’ We instill that in every member to find opportunities to grow the reach of the organization while making tangible contributions to our clients and the community.
“Arizona Microcredit is a powerful organization to be a part of,” Harris says. “Not only does it serve entrepreneurs in our local
community, but empowers us as students to take what we are learning in the classroom and apply it to build these amazing connections with our clients. The relationships I have fostered with local entrepreneurs in the city I was born and raised in is something very special to me. Business truly is personal.”
Eugenia Trakal is the director of education and a member of the executive board of the Arizona Microcredit Initiative, Tempe, AZ. She can be reached at eugenia@azmicrocredit.org.
ARIZONA MICROCREDIT INITIATIVE (AMI) PO Box 25886 Tempe, AZ
www.azmicrocredit.org
info@azmicrocredit.org
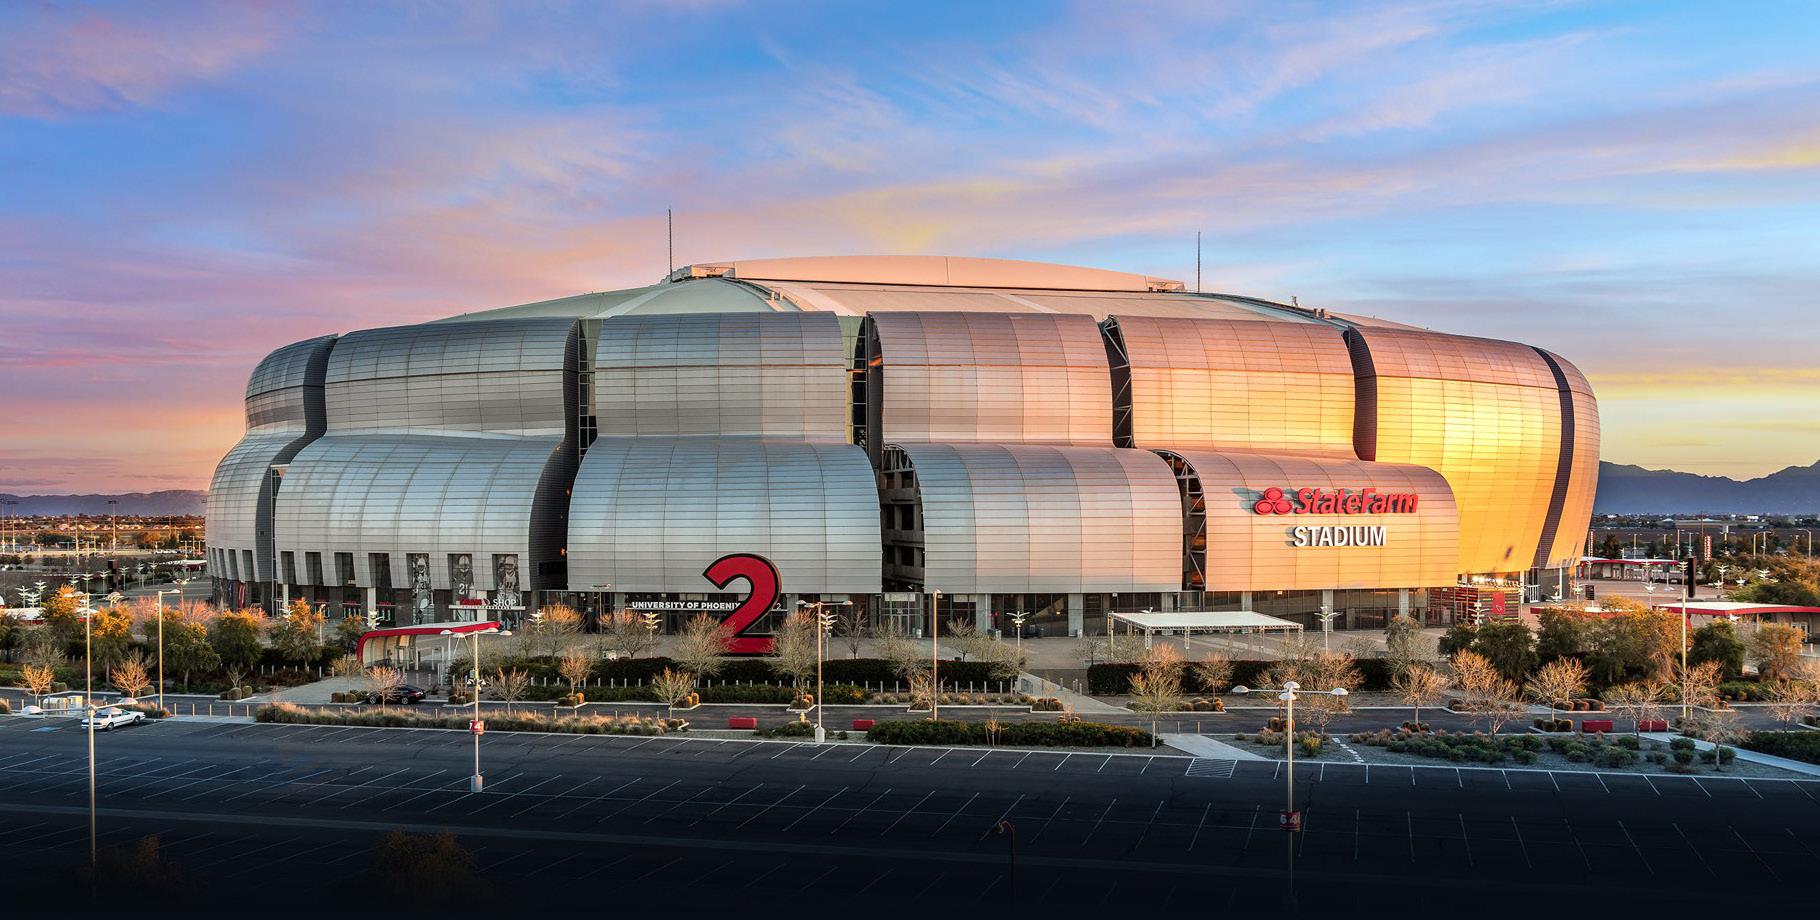
Super Bowl LVII is the fourth Super Bowl to be held in Phoenix since 1996. The last time Arizona hosted a Super Bowl was in 2015, when the New England Patriots beat the Seattle Seahawks 28–24 during Super Bowl XLIX at the University of Phoenix Stadium in Glendale. An independent study conducted by the W.P. Carey School of Business at Arizona State University determined that the total economic impact for the Valley of the Sun from Super Bowl XLIX was more than $719 million. Out-of-town visitors spend big money on lodging, food and beverages, retail, transportation and entertainment, significantly bolstering the regional economy.
"The exposure and economic impact it brings to the region is unmatched and so is the level of community support required to execute such a massive undertaking,” says Jay Parry, president and CEO of the Arizona Super Bowl Host Committee. “For 2023, the Arizona Super Bowl Host Committee is setting its sights even higher. The goal is to elevate everything from the experience to the social and economic impact.”
The Super Bowl is the world’s largest single-day sporting event, pitting the top two teams in the National Football League (NFL) against each other. Super Bowl LVII will be held Feb. 12, 2023, at the State Farm Stadium in Glendale, AZ. In late September, it was announced that Rihanna would perform the halftime show this year. It will be the first time she has publicly performed since the Grammys in early 2018. It is also the first year of the NFL’s new deal with Apple Music as the primary sponsor for the halftime show, replacing Pepsi.
Viewership continues to increase, and the number of fans worldwide keeps growing. As the Arizona Super Bowl Host Committee prepares for Super Bowl LVII , it’s clear the impact of hosting Super Bowl reaches far beyond the field.
The event generates tens of millions of social media interactions, over 100 million television eyes and leaves a huge impact on community organizations and nonprofits. The NFL Foundation and Arizona Super Bowl Host Committee have invested more than $2 million through grants to Arizona nonprofits who directly support Arizonans in the categories of education, health and wellness, diversity, equity and inclusion, and sustainability.
The Business Connect program, a supplier diversity initiative through the NFL and the Arizona Super Bowl Host Committee, works to promote equitable and inclusive procurement practices related to Super Bowl LVII contracting opportunities. The program is committed to supporting businesses owned by minorities, women, LGBTQ+ individuals and veterans.
More than 200 local Arizona businesses have already been awarded contracts as part of the Business Connect program. In addition to the main event in Glendale, more than 1 million people are expected to visit downtown Phoenix and the surrounding areas to enjoy the Super Bowl Experience presented by Lowe’s at both the Phoenix Convention Center and Margaret T. Hance Park. The free immersive experience in Hance Park will feature live music and entertainment, local cuisine and multicultural celebrations. Although the exact times and dates are still to be announced, the events will take place in the week prior to the big game.
The Arizona Super Bowl Host Committee is a nonprofit organization responsible for planning and executing Super Bowl LVII in 2023. The Host Committee’s goal is to galvanize local stakeholders in a united approach to host the largest single-day sporting event in the world by maximizing positive media exposure, fueling the economic engine of Arizona and leaving a lasting legacyinthe local community.
THE ARIZONA SUPER BOWL HOST COMMITTEE azsuperbowl.com
VOLUNTEER
Team AZ volunteers must commit to working three shifts ranging from four to eight hours each. azsuperbowl.rosterfy.com/register
FOR IMMEDIATE RELEASE
February 17, 2022
Contact: Andrea Katsenes (602) 694-1275 Andrea.katsenes@cox.com
PHOENIX — A study just released by Applied Analysis shows that Cox, a family-owned business serving the Phoenix Metropolitan area and Southern Arizona since 1995, has a $5.5 billion positive economic impact in Arizona annually.
The study focuses on key economic indicators upon which Cox impacts Arizona’s economy including:
• $5.5 billion in total economic impact in Arizona annually
• $84.2 million in annual state and local taxes and franchise fees
• 3,100+ direct Cox employees in Arizona
• 11,250 jobs supported in the state
• 51,000 hours volunteered annually by Cox employees
• $33 million in annual giving to nonprofits and community programs by Cox employees and the company
*Please view a short video illustrating the results from this recent economic impact survey:
https://www.dropbox.com/s/z5z9x2v66bgwv0j/AZ%202%3A3%3A22.mp4?dl=0
Cox has invested more than $2.7 billion over 10 years, providing 30,000 miles of fiber optic and coaxial infrastructure in Arizona, producing 1G speeds and the most bandwidth available in the residential and commercial markets. Not slowing down, Cox is continuing to expand our fiber-rich network in order to provide connections to more neighborhoods and communities throughout the state.
“Upholding the commitment to the communities where we work and live that was made by our founder, Governor James Cox, Cox is proud to have a history of contributing billions of dollars to the Arizona economy through investment and employment. We are committed to providing great service and the fastest internet speeds in the state, “said Cox Southwest Vice President and Region Manager, Percy Kirk. He adds, “Our employees proudly contribute approximately $33 million annually to nonprofits and community programs across Arizona. This year, on the 25th Anniversary of Cox Charities, Cox employees volunteered 51,000 hours in the community and donated nearly $500K to 113 Arizona nonprofit environment and sustainability programs, education and diversity programs.”
Underpinning Cox’s economic impact on Arizona is its fundamental commitment to close the digital divide through accessibility initiatives in Phoenix and Southern Arizona. Cox is proud to provide affordable Internet service to more than 69,000 qualified Arizona families in need with school-age children through Cox’s low-cost internet programs. Expanding its low-cost Internet programs, this year Cox added ConnectAssist serving qualified families in need without children in grades K-12, and those receiving Veterans Pension & Survivors Benefits, Tribal Assistance, Supplemental Security Income, and/or Medicaid.
In addition, Cox awarded 10 Cox Diversity Scholarships ($3,500 each scholarship) to Valley high school students to support their future education. Cox also provides 43 Cox Computer Labs throughout Phoenix and Southern Arizona in partnership with various nonprofits, including Boys & Girls Clubs, Chicanos Por La Causa and Goodwill.
About Cox Communications

Cox Communications is committed to creating meaningful moments of human connection through broadband applications and services. The largest private telecom company in America, we proudly serve seven million homes and businesses across 18 states. InmetroPhoenix,weserveapproximately2.5millionproductsubscribers,andinSouthernArizona,approximately400,000product subscribers,with residential and business digitaltelevision, 1G high-speed Internet, securitysystems and digitaltelephone service over its own nationwide IP network. We’re dedicated to empowering others to build a betterfuture and celebrate diverse products, people, suppliers, communities and the characteristics that make each one unique. The 3,100 Arizona employees of Cox are proud tohavetoppednumerousJ.D.PowerandAssociates’studiesofcustomersatisfactionandformanyyearstop“RankingArizona-Best ofArizona Business” list. Cox Communications is the largest division of Cox Enterprises, a family-owned business founded in 1898 byGovernorJames M. Cox.
With the depth of our expertise, resources and geographic reach, we are in a unique position to help promote economic opportunities for many different populations and advance strong economies worldwide. Bank of America is proud to support the Arizona Hispanic Chamber of Commerce, as we build communities that thrive, together, Visit us at bankofamerica.com/about.

This brief uses data from the U.S. Census Bureau’s Household PulseSurvey(HPS)fordifferenttimeperiodsbetween2020when the Census Bureau began collecting data and May 2022. It is important to note that these data underestimate people who are entrepreneurs because they include individuals who select selfemployment as their primary or only source of income. Therefore, thesedatadonotincludethosewhohaveanotherpart-orfull-time jobanduseself-employmentassupplementalincome.
1. Self-employed Latinas were concentrated in industries essential to the stability and security of the United States during the COVID-19 pandemic and were hardest hit at the beginning of the pandemic.
• The top three industries for self-employed Latinas between 2015 and 2019 included: health care and social assistance (20%), accommodation and food services (12%) and retail trade (12%).
2. During the early part of the pandemic, 40% of self-employed Latina women in Arizona lived in or supported lower-income households.
• A total of 40% of self-employed Latinas lived in or supported households making less than $50,000 a year compared to 27% of self-employed white women who lived in or supported households making less than $50,000 a year.
3. Self-employed Latina women faced incredible financial stress during the first 12 months of the COVID-19 pandemic.
• A total of 65% of self-employed Latinas lived in or supported households that experienced a loss of income during the first 12 months of the pandemic.
• Latina women suffered an income loss of 17 percentage points more than white men in the first 12 months of the pandemic.
• Latina women suffered an income loss of 9 percentage points more than white women in the first 12 months of the pandemic.
4. Self-employed Latina women disproportionately faced financial difficulties while paying household expenses in the aftermath of the pandemic.
• A total of 39% of Latina women reported difficulty in paying their household expenses, including food, housing, car payments and medical expenses.
• Compared to white women and white men, 16% more Latina women had trouble paying their household expenses.
5. Self-employed Latina women, Latino men, white men and white women appear to be behind on their rent/mortgage at similar rates, with only 1 or 2 percentage points separating each group.
• When asked if their households are caught up on rent or mortgage payments, 4% of self-employed Latina women in Arizona responded, “No.”
6. Self-employed Latina women continue to face financial stress and vulnerability during the periods of economic recovery (12+ months of COVID-19/Recovery)
• A total of 28% of self-employed Latinas continue to live in or support a household that has experienced a loss of income.
• Latina women have lost more than 14 percentage points more than white women in employment income.
• Latina women have lost more than 24 percentage points more than white men in employment income.
This information has been adapted from a Sept. 13, 2022, data brief written by Julia Hernandez Nierenberg, Silvia R. González and Paul M. Ong for the UCLA Latino Policy & Politics Institute. The data brief can be found at latino.ucla.edu/research/self-employed-latinas-arizona/
The Arizona Hispanic Chamber of Commerce designed this study to be a resource for businesses, organizations, educators, government agencies and individuals who want Minority Business Enterprises (MBEs) to succeed. This was funded by U.S. Department of Commerce, Minority Business Development Agency, Coronavirus Response and Relief Fund to assist with the following: a) identifying potential policy topics for MBDA to champion, b) comprehensive data collection which could be used in future MBE studies, c) information analysis on minority business enterprises, and d) information programming for business organizations. The MBE Study focused on providing insights regarding the challenges businesses faced during the pandemic and the strategies they used to overcome them. Other topics include challenges and strategies of being an MBE as well as gaining access to capital. Comparisons were also made with businesses located in Historically Underutilized Business Zones (“HUBZones”), (1) and businesses operating in Indigenous Communities.
A total of 1,983 telephone interviews were conducted with MBEs from January 15 through April 20, 2022. This was broken down into 870 MBEs and 1,113 non-MBEs. The original target was to contact 400+ MBEs in each state, but sample sources of minority businesses were significantly less in Nevada and Utah businesses because of the lower percentage of MBEs compared to Arizona. As a point of reference, the total number of MBEs with paid employees as defined by the 2018 U.S. Census by state were Arizona 16,438, Nevada 9,612, and Utah 4,866.
In addition, specific survey targets included economically disadvantaged businesses, especially those operating in rural areas (HUBZone locations – 699 interviews), and businesses with American Indians/those in Indigenous Communities (95 interviews).
WHAT WERE KEY TAKEAWAYS FROM THE STUDY?
PANDEMIC CHALLENGES/SOLUTIONS FOLLOWED A NATURAL PROGRESSION
– MBEs followed the same patterns as non-MBEs regarding the challenges they faced during the pandemic and how they dealt with the problems. The problems and solutions that MBEs faced was a natural flow of problems and businesses responses.
WHAT HAPPENED?
STAGE 1: Government shutdown businesses and mandates limiting operations
STATE 2: Conflicts adhering to CDC guidelines
STAGE 3: Return to business
STAGE 4: Parts of economy more affected than others
STAGE 5: Pandemic continues
HOW WERE BUSINESSES AFFECTED?
Immediate loss of revenue
Conflicts with employees/ customers/suppliers deciding whether to follow guidelines
Needing cash to replace lost business
Trying to replace workers
Supply chain issues
To be determined
WHAT DID BUSINESSES DO?
Cut expenses, laid off workers, shutdowns
Most stayed within government requirements
Applied for government loans/ grants; increased marketing efforts (e.g., started new lines of business)
Changed hiring practices
Accepting longer wait times, Tried new lines of business.
To be determined
SIMILAR BUT WITH GREATER URGENCY – The challenges and strategies used during the pandemic were generally consistent comparing MBEs vs. non-MBES, between states (Arizona, Nevada, and Utah), HUBZone vs. non-HUBZone and Indigenous Communities. NOTE: Individual reports by each state have been written and highlight the similarity in survey results, themes storylines and conclusions.
The economic, technological, and operational business problems created by the pandemic generally did not differ by type of businesses or ownership. Similarly, the strategies and solutions used were also common to most businesses; however, there were differences, not by types of problems and solutions, but by the urgency and impact they had on MBEs and the various target groups.
o More aggressive strategies - The main difference in the pandemic impact is that MBEs and those in HUBZone and Indigenous Communities appeared to be more severely affected financially by the pandemic than non-MBEs. As a result, they had to be more aggressive in their efforts to address the pandemic challenges, especially by expanding their marketing efforts to make up for lost revenue (such as starting new business lines and/or increasing advertising) and applying for loans.
ACCESS TO CAPITAL WAS A CONSISTENT THEME – MBEs were more likely to feel this was a significant challenge than non-MBEs, especially in HUBZone areas and for businesses in Indigenous areas. This is a critical focal point in trying to help these businesses. Because MBEs are often smaller in size than non-MBEs, many did not have as many financial resources to handle the pandemic. It was also clear that this issue is not just pandemic-related. Respondents’ comments highlighted the ongoing nature of this issue even prior to COVID and the difficultly in trying to grow the business and pursue larger projects due to capital constraints.
EMBRACING THE MBE STATUS – While it is clear that MBEs continue to have to overcome negative perceptions of being a minority-owned business, the top strategies they use are to embrace rather than hide their status by networking and promoting their minority foundation.
Arizona’s Hispanic/Latino (H/L) Voters Feel Anxious and Behind Schedule About Retirement
Arizona’s Hispanic/Latino (H/L) registered voters ages 25 to 64 do not feel financially prepared for retirement Most (90%) H/L voters ages 35 to 64 wish they had more money saved for retirement and one-third (35%) of younger voters do not think they will be able to save enough money for their retirement years Three-quarters (75%) of H/L voters ages 25 to 64 feel anxious about having enough money to live comfortably through their retirement years and about four in ten (42%) say they are behind schedule planning and saving for retirement
Anxiety About Having Enough Money for Retirement
(n=317 H/L RVs AGES 25-64 in Arizona)
Self-Reported Assessment of Saving for Retirement
(n=317 H/L RVs AGES 25-64 in Arizona)
42% Behind Schedule
8% Ahead of Schedule
75%
49% On Track
Arizona’s H/L Voters Concerned About Impact of Expenses on Retirement
Cost-of -living and health care expenses can make affording retirement a challenge for many workers Indeed, most (88%) H/L voters are concerned about increases in their cost-of -living expenses reducing their standard of living
(Very: 45%; Somewhat: 43%) In addition, over a third are not very (17%) or not at all (18%) confident they will have enough money to cover health care expenses in their retirement years
H/L Voters See Cost-of- Living and Health Expenses Impact Their Saving for Retirement
(n=317 H/L RVs AGES 25-64 in Arizona)
Arizona’s H/L Registered Voters Support Public -Private Retirement Savings Option
Support/Oppose Public-Private Managed Arizona Retirement Savings Program
(n=317 H/L RVs AGES 25-64 in Arizona)
4% 5% 3% 7% 37% 44% Not sure Strongly Oppose Somewhat Oppose Neither Support/Oppose Strongly/Somewhat Support 1% 2% 3% 5% 56% 32% Not sure Strongly Disagree Somewhat Disagree Neither Strongly/Somewhat Agree 1% Not sure
Agree/Disagree Elected Officials Should Support Legislation to Make Saving Easier for Workers


(n=317 H//L RVs AGES 25-64 in Arizona) 81% Support
Arizona’s H/L registered voters understand that a sound state-facilitated workplace savings program should include key features such as portability, small business employee access, voluntary participation, and automatic deduction
Most H/L registered voters say it is important to them that a retirement savings program be transferrable from one job to another, with about seven in ten saying this is a very important feature Voters also think it is important to have a retirement savings program available to all employees without a way to save for retirement at work, including small business employees – three in five say this feature is very important A retirement savings program that is voluntary, where participants are not required to contribute, is very important to half of all H/L registered voters in Arizona ages 25 to 64, and automatic payroll deduction is a very important feature to over half
Workplace Retirement Savings Program (n=317 H/L RVs AGES 25-64 in Arizona)
Portability-Can take to Next Job
Available to all, incl. small business employees
Contributions automatically taken each paycheck
Voluntary participation for employees
Data from this survey shows that three in four (76%) of Arizona’s H/L voters believe it is very important to be able to save for retirement while working Yet almost half of Arizona’s private sector employees (about 1,280,000) work for an employer that does not offer a retirement plan 1 Moreover, small businesses with fewer than 100 employees are less likely to offer a retirement savings plan than larger businesses Nearly two in ten (18%) working voters in this survey say their employer does not offer a retirement savings plan and the majority of them would be likely to take advantage of a way to save for retirement at work if offered (see Q7 and Q7A)
Likelihood of Taking Advantage of Way to Save for Retirement at Work if Employer Offered
(n=41 H/L RVs AGES 25-64 in AZ WITH NO ACCESS TO EMPLOYER PLAN)
*Note small base. Use caution when generalizing to the larger Arizona population.
Margin of error is +/- 5 5 percent All data are weighted by age and gender according to October 2021 Arizona state voter database statistics For more information visit www aarp org/retirementsecurityaz
1 2015 AARP, Workplace Retirement Plans Will Help Workers Build Economic Security David John and Gary Koenig AARP Public Policy Institute https://www aarp org/content/dam/aarp/ppi/2015-08/aarp-arizona-fact-sheet pdf

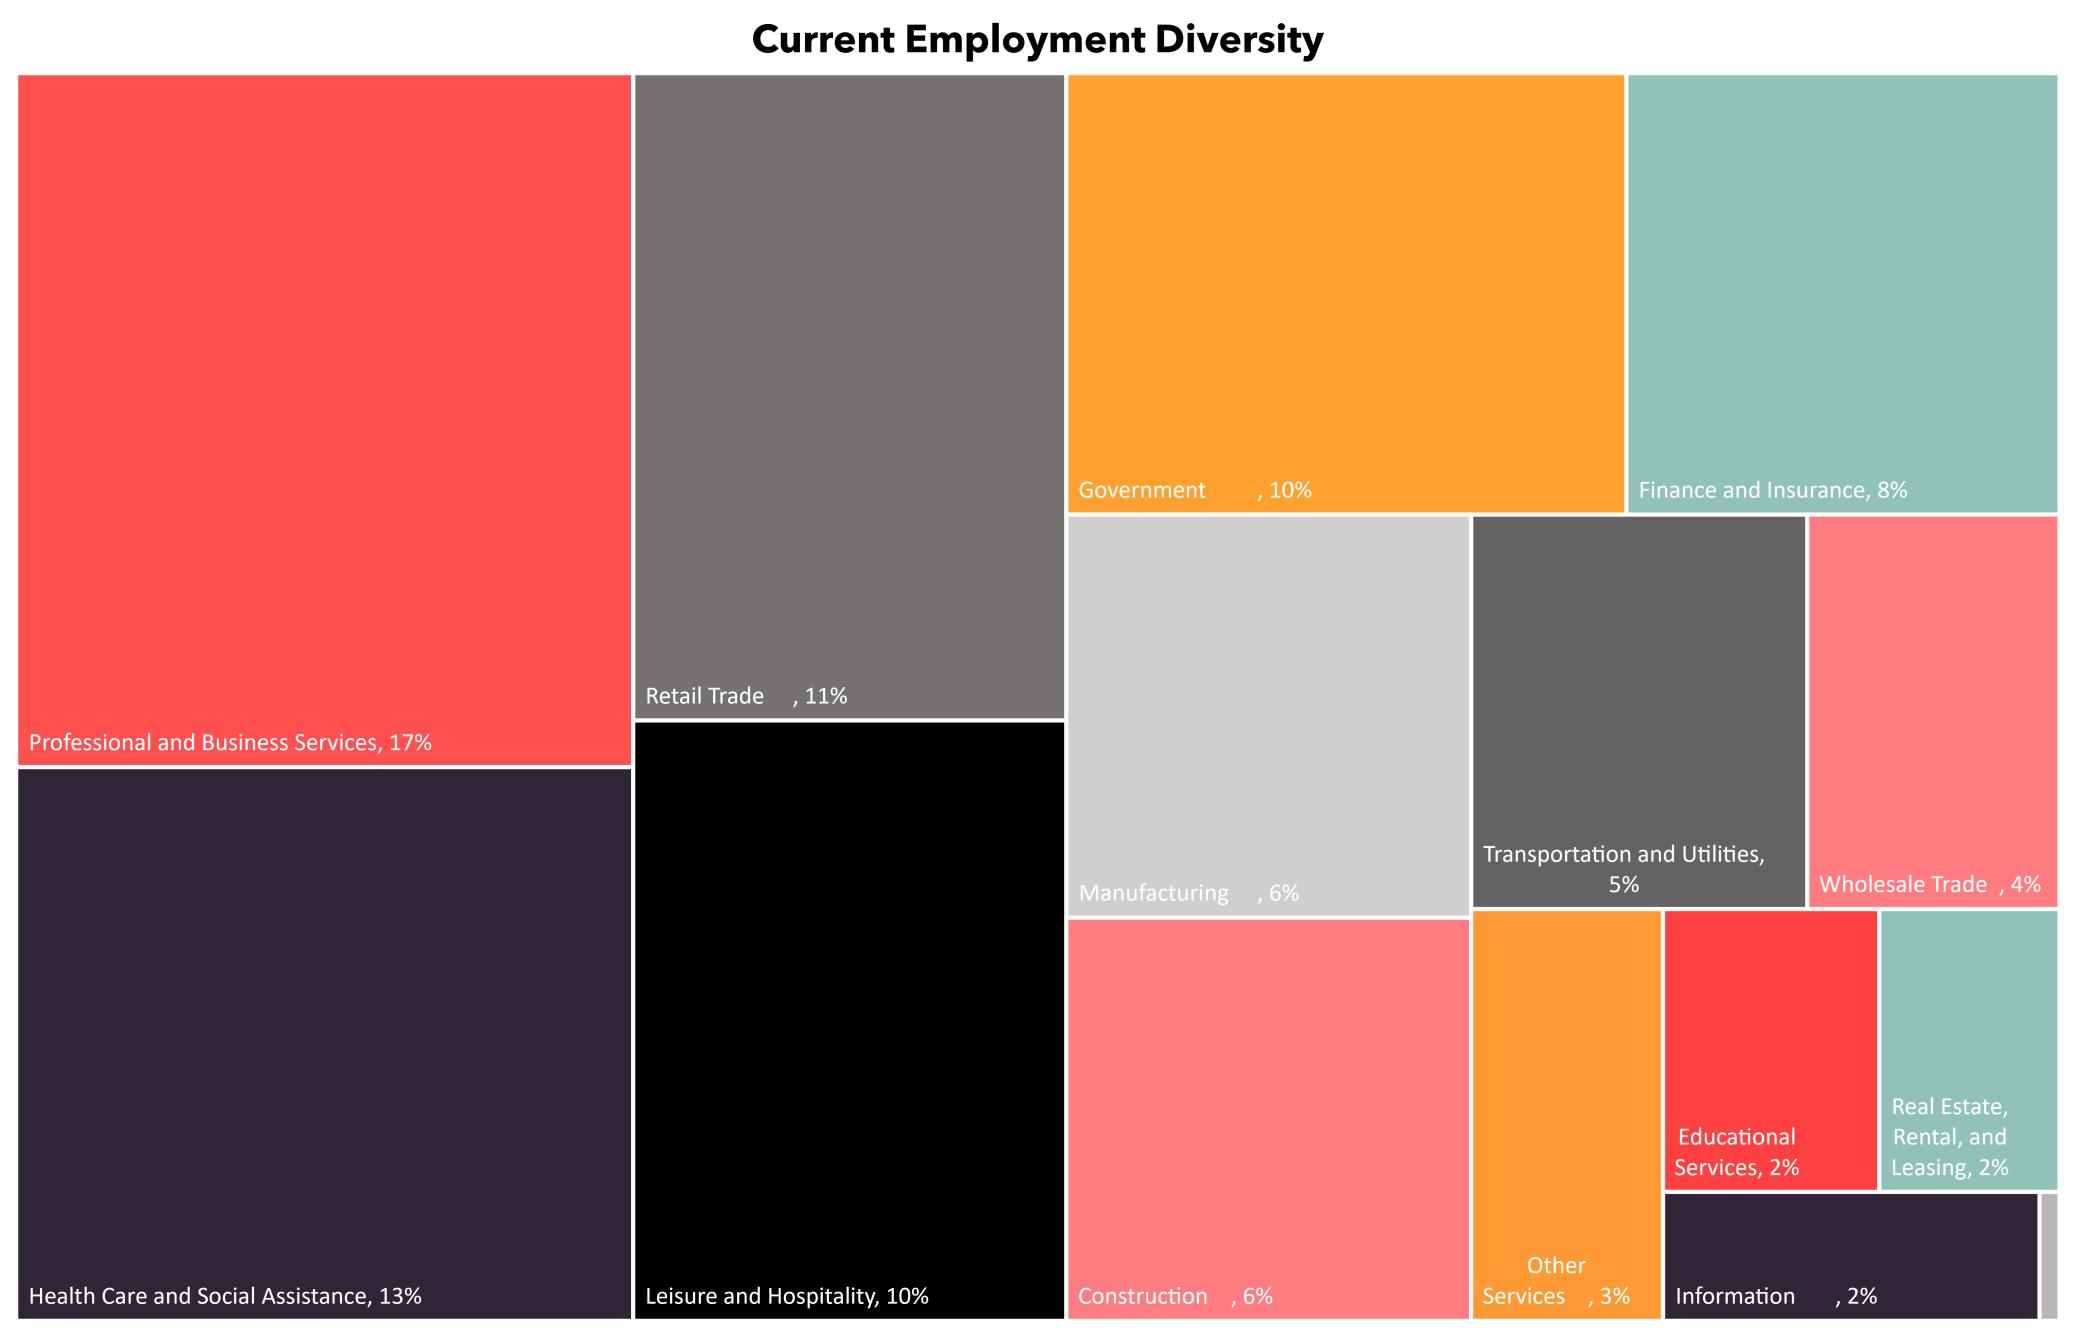
• The largest industries in Greater Phoenix are professional and business services and healthcare and social assistance
• Since the 2008 recession, the most significant changes are a relative growth in healthcare and social assistance and decline in construction and retail trade
• Greater Phoenix real GDP in 2020 was $240.7 billion, contracting by 0.5% over the previous year
• Arizona real GDP contracted 1.0% from 2019 to 2020
• U.S. real GDP contracted 3.4% from 2019 to 2020
• Home Health and Personal Care Aides, Laborers and Freight, Stock, and Material Movers and Fast Food and Counter Workers had the highest increase in the number of jobs between 2021 and 2022.
• The top three occupations that drove much of the region’s recent employment growth were industrial truck and tractor operators, Insurance Sales Agents and Home health and Personal Care Aides.


Establishments
Between March 2019 and March
2020, 18,512 Arizona establishments opened and 16,531 closed, for a net increase of 1,981. Employment expanded at 33,638 and contracted at 31,788. Small businesses accounted for 18,326 openings and 16,295 closings.
Opening and expanding Arizona establishments added 285,955 jobs, while closing and contracting establishments lost 227,613, for a net increase of 58,342 jobs. Small businesses contributed a net increase of 42,360 jobs, or 72.6 percent of that total.
Counts include temporary closures and reopenings
Source: Business Employment Dynamics (BLS)
Released July 2022
In March of 2020, the United States was hit with a global pandemic caused by the coronavirus. The coronavirus pandemic ushered in quarantines, mask mandates, product shortages, business closures, and businesses scrambling to figure out new ways to keep their doors open. The economic impact of this can be seen in the U.S. Census Bureau’s economic surveys.

The Census Bureau’s economic indicator surveys captured the initial shock of the coronavirus pandemic, as well as economic trends since the national emergency was declared on March 13, 2020. Figure 1 shows the impact across key sectors of the nation’s economy, including services, retail trade, wholesale trade, and manufacturing. The data from all four graphs show a dip in estimated sales, revenue, and value of shipments in 2020 followed by a recovery through the fourth quarter of 2021.
Source: www.census.gov/library/publications/2022/econ/coronavirus-pandemics-economic-impact.html
Note: Estimates are based on data for employer firms. Data adjusted for seasonal variation but not for price changes. Differences between estimates may be attributed to sampling or nonsampling error, rather than underlying economic conditions. Caution should be used in drawing conclusions from the estimates and comparisons shown. Information on the survey methodology, including sampling error (e.g., standard errors and relative standard errors) and nonsampling error is available at <www.census.gov/services/qss/how_the_data_are_collected.html>.
The Census Bureau has reviewed this data product for unauthorized disclosure of confidential information and has approved the disclosure avoidance practices applied (Approval ID: CBDRB-FY22-003).
Source: U.S. Census Bureau, Quarterly Services Survey, March 11, 2022, <www.census.gov/services>.
Note: Estimates are based on a sample of employer firms. Firms without paid employees, or nonemployers, are represented in the published estimates through the estimation procedure. Data adjusted for seasonal variation and holiday and trading-day differences but not for price changes. Differences between estimates may be attributed to sampling or nonsampling error, rather than underlying economic conditions. Caution should be used in drawing conclusions from the estimates and comparisons shown. Information on the survey methodology, including sampling error (e.g., standard errors and relative standard errors) and nonsampling error is available at <www.census.gov/retail/how_surveys_are_collected.html>.
The Census Bureau has reviewed this data product for unauthorized disclosure of confidential information and has approved the disclosure avoidance practices applied (Approval ID: CBDRB-FY22-001).
Source: U.S. Census Bureau, Advance Monthly Retail Trade Survey, May 17, 2022, <www.census.gov/retail>.
1 Excludes manufacturers’ sales branches and o ces.
Note: Estimates are based on data for employer firms. Data adjusted for seasonal variation and trading-day di erences but not for price changes. Di erences between estimates may be attributed to sampling or nonsampling error, rather than underlying economic conditions. Caution should be used in drawing conclusions from the estimates and comparisons shown. Information on the survey methodology, including sampling error (e.g., standard errors and relative standard errors) and nonsampling error is available at <www.census.gov/wholesale/www/how_surveys_are_collected/monthly_methodology.html>.
The Census Bureau has reviewed this data product for unauthorized disclosure of confidential information and has approved the disclosure avoidance practices applied (Approval ID: CBDRB-FY22-002).
Source: U.S. Census Bureau, Monthly Wholesale Trade Survey, May 9, 2022, <www.census.gov/wholesale>.
Note: Data adjusted for seasonality but not price changes. Statistical significance is not measurable for this survey. The Manufacturers' Shipments, Inventories, and Orders estimates are not based on a probability sample, so the sampling error of these estimates cannot be measured nor can the confidence intervals be computed.
The Census Bureau has reviewed this data product for unauthorized disclosure of confidential information and has approved the disclosure avoidance practices applied (Approval ID: CBDRB-FY22-100).
Source: U.S. Census Bureau, Manufacturers's Shipments, Inventories, and Orders Survey, May 13, 2022, <www.census.gov/manufacturing/m3>.
U.S. Census Bureau
The Coronavirus Pandemic’s Economic Impact
Source:
The 2021 LDC U.S. Latino GDP Report seeks to provide a factual view of the large and rapidly growing economic contribution of Latinos living in the United States. We estimate the U.S. Latino GDP based on a detailed, bottom-up construction which leverages publicly available data from major U.S. agencies. The most recent year for which the core data is available is 2019. Thus, this year’s report provides a snapshot of the total economic contribution of U.S. Latinos in that year. As a summary statistic for the economic performance of Latinos in the United States, the 2019 Latino GDP is extraordinary The total economic output (or GDP) of Latinos in the United States was $2.7 trillion in 2019, up from $2.1 trillion in 2015, and $1.7 trillion in 2010. If Latinos living in the U.S. were an independent country, the U.S. Latino GDP would be tied for the seventh largest GDP in the world. Tied with France, the Latino GDP is larger even than the GDPs of Italy, Brazil or Canada
The 2020 Decennial Census substantially increased the number of Latinos that we understand to be living in the United States. Adjusting the 2019 intercensal estimate of U.S. Latino population accordingly and recalculating the 2019 Latino GDP results in a GDP of $2.75 trillion. This places the U.S. Latino GDP above the GDP of France, in sole possession of the world’s 7th largest GDP.
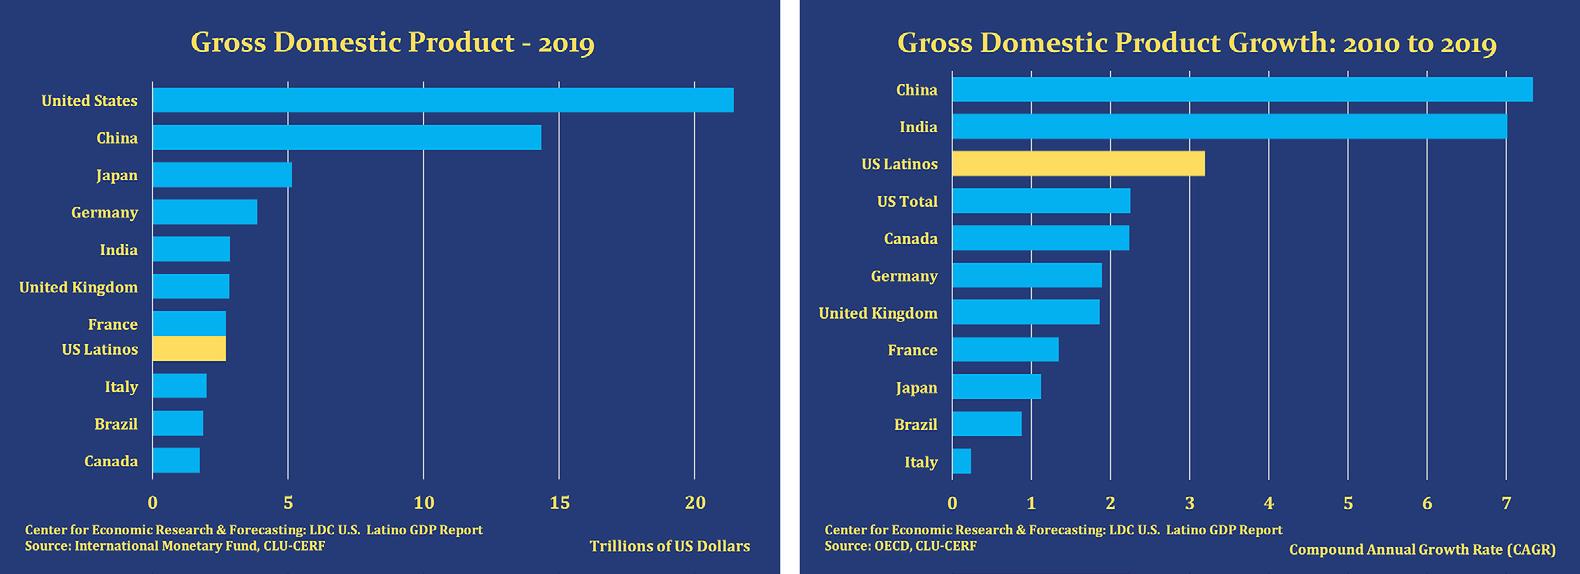
While impressive for its size, the U.S. Latino GDP is most noteworthy for its growth. Over the past 2 years, the growth of real Latino GDP averaged 5.63 percent, double the rate of the broader U.S. economy. Since 2010, real Latino GDP has grown 57 percent faster than real U.S. GDP and 70 percent faster than Non-Latino GDP. The growth of the U.S. Latino GDP even compares favorably on the world stage. From 2010 to 2019, the U.S. Latino GDP is the third fastest growing among the 10 largest GDPs, while the broader U.S. economy ranks fourth.
The $2.7 trillion U.S. Latino economy is both deep and wide. The U.S. Latino GDP’s top industry sector is Education & Healthcare, totaling $446 billion or 16.4% of U.S. Latino GDP. This is followed by Professional & Business Services ($327 billion or 12.0% of Latino GDP) and Finance & Real Estate ($252 billion or 9.3% of Latino GDP). The Latino GDP is not only an engine of economic growth but also a broad foundation of support for the larger U.S. economy.

The 2021 State Latino GDP Report1 builds on prior analysis by providing state-level calculations of the total economic contribution of Latinos living in the United States. Arizona, California, Florida, Illinois, New Jersey, New Mexico, New York, and Texas collectively contain nearly three-quarters of the Nation’s Latino population. This report provides detailed analysis of the state-level Latino GDPs for these 8 states, benchmarked against the broader U.S. Latino GDP.
The 2020 LDC U.S. Latino GDP Report2 provides a factual view of the large and rapidly growing economic contribution of Latinos living in the United States. In that report, we estimate the U.S. Latino GDP based on a detailed, bottom-up construction which leverages publicly available data from major U.S. agencies. At the time of its release, the most recent year for which the core building block was available is 2018. Thus, the report provides a snapshot of the total economic contribution of U.S. Latinos in that year.
As a summary statistic for the economic performance of U.S. Latinos, the 2018 Latino GDP is breathtaking. The total economic output (or GDP) of Latinos in the United States was $2.6 trillion in 2018 If Latinos living in the United States were an independent country, the U.S. Latino GDP would be the eighth largest GDP in the world. The U.S. Latino GDP is larger even than the GDPs of Italy, Brazil or South Korea.
While impressive for its size, the U.S. Latino GDP is most noteworthy for its extraordinary growth. Among the world’s 10 largest GDPs in 2018, the Latino GDP was the single fastest growing. Latino real GDP grew 21 percent faster than India’s and 30 percent faster than China’s. Over the entire period from 2010 to 2018, the Latino GDP was the third fastest growing, while the broader U.S. economy ranked fifth. Latino GDP grew a remarkable 74 percent faster than non-Latino GDP from 2010 to 2018
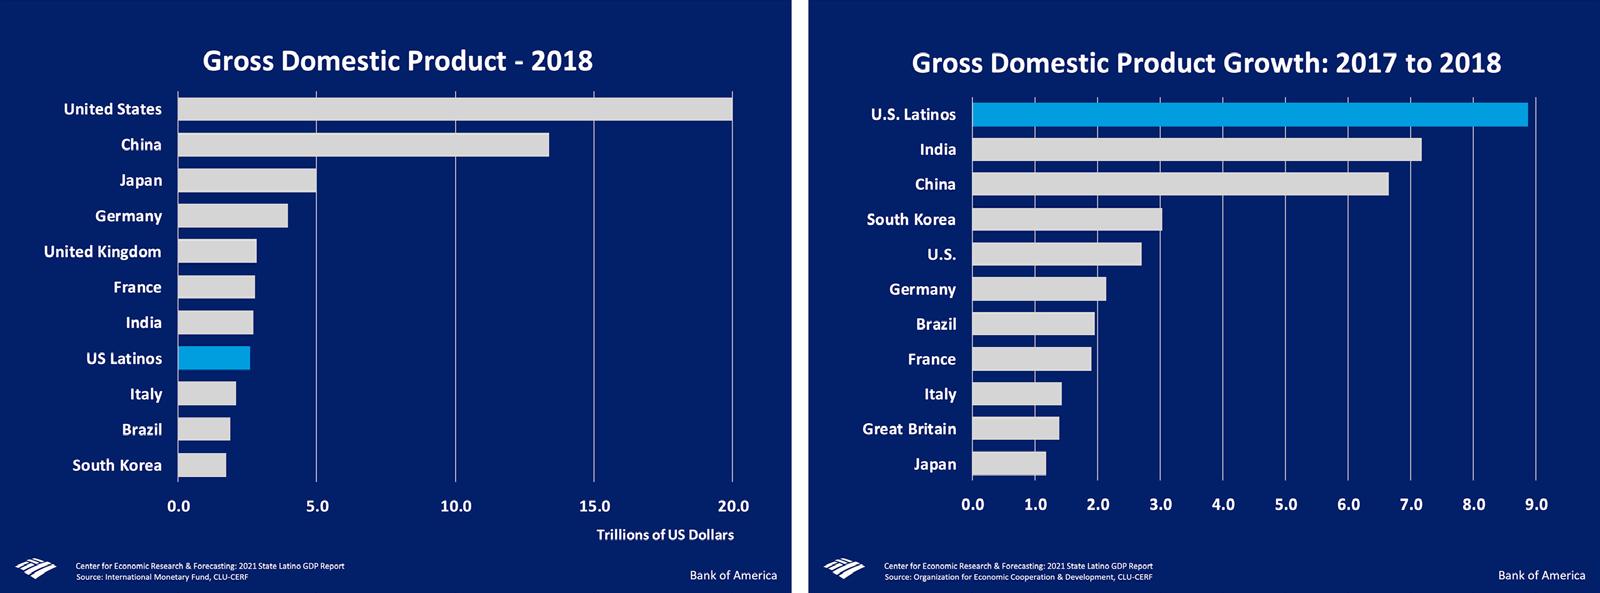
As with the broader U.S. Latino cohort, the performance of Latinos in the eight states targeted in this report is extremely impressive. The eight states had a combined 2018 Latino GDP of $2.0 trillion, representing 76 percent of the U.S. Latino GDP. If these Latinos were a single state, they
1 For questions about this report, please contact: Matthew Fienup, Chief Economist, www.clucerf.org, (805)493-3668; David Hayes-Bautista, Chief Demographer, www.uclahealth.org/ceslac, (310)794-0663

2 2020 LDC U.S. Latino GDP Report: https://www.clucerf.org/2020/09/28/2020-ldc-u-s-latino-gdp-report/
would produce the second largest state GDP in the nation. Second only to California, their GDP is 10 percent larger than the entire economy of Texas.
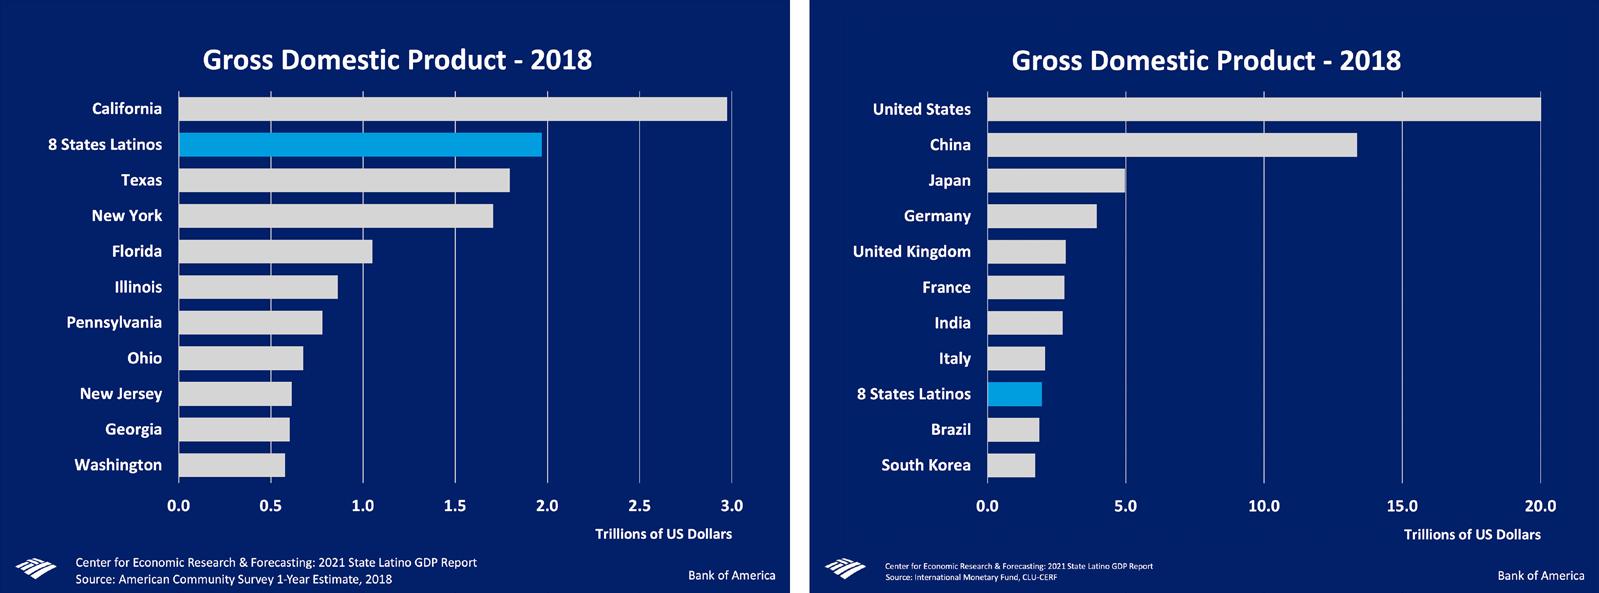
These eight state Latino GDPs are large even on the world stage. Treated as a single economy, Latinos in these eight states produce greater economic activity than the entire country of South Korea or Brazil Latinos in these eight states are the equivalent of the world’s 9th largest GDP.
A primary component of the dramatic economic performance of Latinos is personal consumption. From 2010 to 2018, real consumption among U.S. Latinos grew 135 percent faster than Non-Latino. 2018 aggregate consumption among Latinos in the 8 target states is $1.36 trillion. This represents a consumption market that is 30 percent larger than the entire economic output of the state of Florida. Robust consumption and rapid consumption growth are driven, in turn, by rapid gains in human capital and strong labor force participation.
Arizona’s 2018 Latino GDP is $91.9 billion, larger than the entire economic output of the state of New Hampshire The state’s top three 2018 Latino GDP sectors are: Education & Healthcare (16 9% share of the Arizona’s Latino GDP), Finance & Real Estate (12.9%), and Professional & Business Services (11 8%) As with the U.S. Latino GDP, the largest component of Arizona’s Latino GDP is personal consumption. Latino consumption totaled more than $60.7 billion in Arizona in 2018.
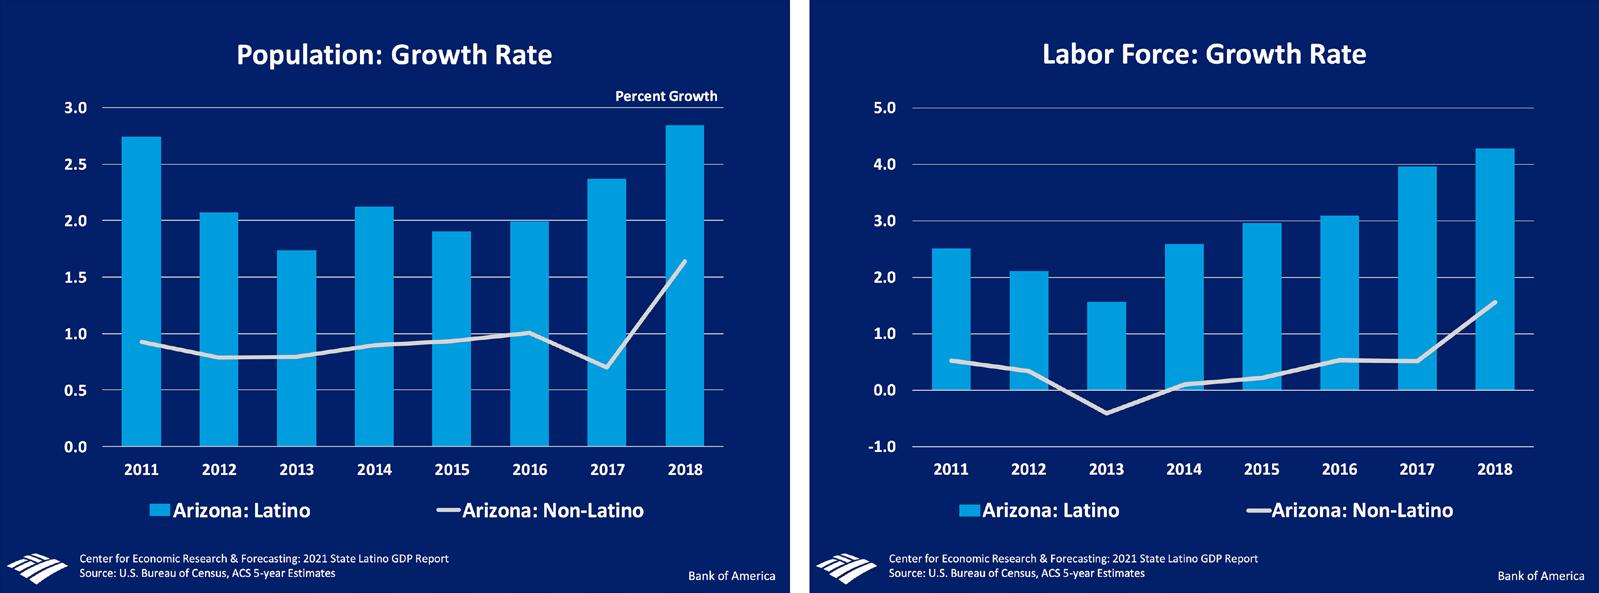
Latinos are making strong and consistent contributions to Arizona’s population and labor force. While the population of Arizona increased steadily from 2010 to 2018, Latino population growth was nearly two and a half times that of Non-Latinos. From 2010 to 2018, Arizona’s Non-Latino population grew by just less than 8 percent. Over that same period, the state’s Latino population grew by 19 percent. The Latino labor force growth premium is even more impressive. From 201018, Arizona Latino’s labor force grew nearly 7 and a half times as quickly as the Non-Latino labor force (25.5 percent growth for Latinos compared to only 3.4 percent for Non-Latinos).
As we do in the U.S. Latino GDP report, we note that the importance of labor force growth cannot be overstated. According to Federal Reserve economists, the number of people retiring in the U.S. is forecast to increase substantially over the next year, peaking in 2022 at close to 350,000 mostly non-Latino Baby-Boomers retiring each month. This dangerous shortage of workers is a demographic crisis which threatens the country’s ability to maintain even modest economic growth Fortunately, Latinos are already well on their way to mitigating this demographic time bomb, adding substantial numbers to the population of working age adults and to the labor force.
The economic contribution of Latinos in Arizona, as with U.S. Latinos broadly, is driven by rapid gains in human capital, strong work ethic, and a positive health profile. From 2010 to 2018, Latino educational attainment grew at a rate 2 5 times faster than the educational attainment of NonLatinos. Over those 9 years, Arizona Latino’s labor force participation rate was an average of 6 0 percentage points higher than Non-Latinos. In 2018, Latino labor force participation was a full 8.2 percentage points higher. Latinos in Arizona also boast lower age-adjusted mortality rates across the leading causes of death. Arizona Latinos’ age-adjusted mortality rate is 14 percent lower than the state’s White Non-Latinos for cancer and 19 percent lower for heart disease. Arizona Latinos enjoy greater longevity, with a life expectancy that is a full year longer than White Non-Latinos (81 1 years compared to 80.0).
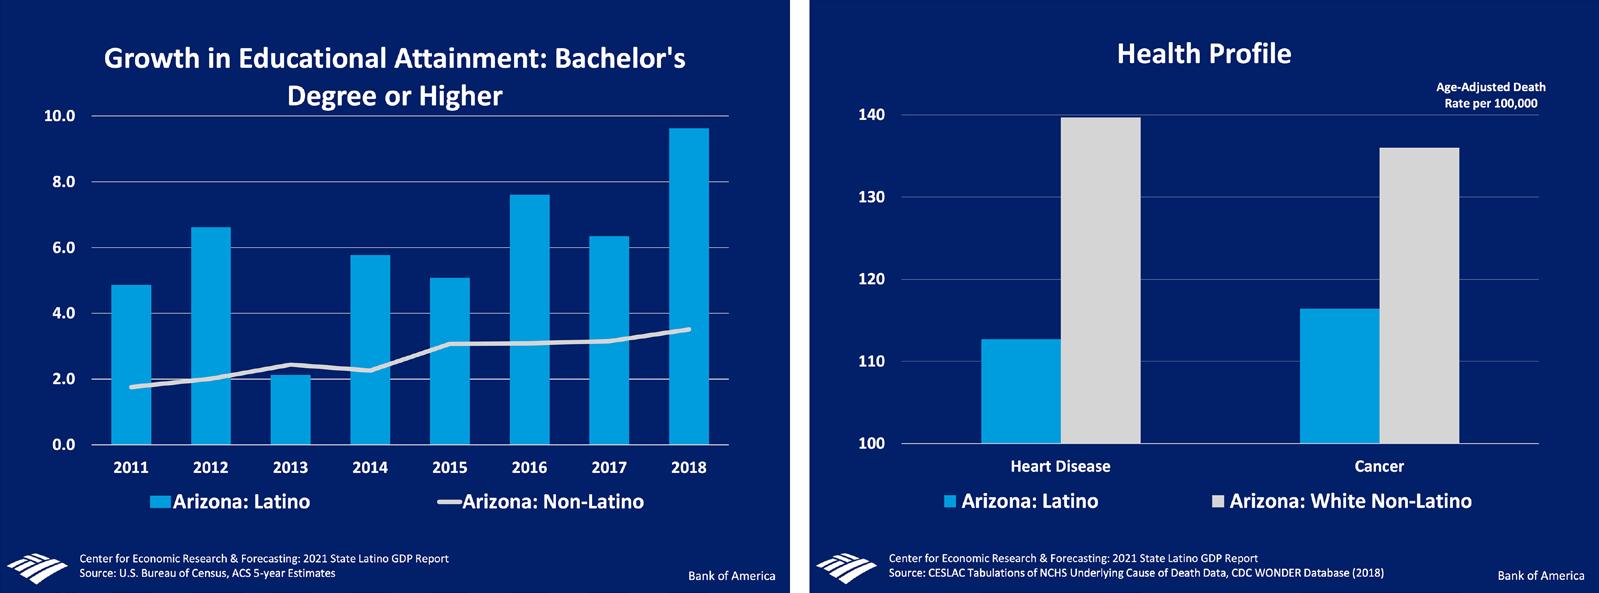
The family values, hard work, and strong health profile of Latinos in Arizona and in the U.S. are a tremendous source of economic vitality
Source: www.mbda.gov/sites/default/files/2022-06/Hispanic%20American-Owned%20Firms%20Fact%20Sheet%20-%20FINAL%206.10.2022.pdf


Hispanic entrepreneurs recognize their employees’ importance while acknowledging their own stressors

84% of Hispanic entrepreneurs have changed, or plan to change, their approach to employee wellness and benefits as a result of the pandemic, with top changes including:


Entering 2021, nearly half of Black small business owners expect their revenue to increase and believe their local and the national economies will improve. Nearly one-quarter also plan to hire.
84% of Hispanic entrepreneurs have changed, or plan to change, their approach to employee wellness and benefits as a result of the pandemic, with top changes including:
Nearly all (99%) Hispanic entrepreneurs say the pandemic created added stress around running their business. To cope with that stress, they have:
61% of Hispanic entrepreneurs cut their own pay to keep employees on staff.
Nearly all (99%) Hispanic entrepreneurs say the pandemic created added stress around running their business. To cope with that stress, they have:
To improve their financial situation, 49% of Hispanic entrepreneurs plan to apply for a bank loan or line of credit this year, and they’ll use that funding to:
To improve their financial situation, 49% of Hispanic entrepreneurs plan to apply for a bank loan or line of credit this year, and they’ll use that funding to:
While optimistic about their future business prospects, a majority of Hispanic entrepreneurs rate their current financial situation as fair:
Most Hispanic business owners expect their revenue to increase over the next year, while economic optimism and hiring plans have also increased since last fall.
Most Hispanic business owners expect their revenue to increase over the next year, while economic optimism and hiring plans have also increased since last fall.
Two-thirds of Hispanic business owners say they’ve felt an increase in support from their community over the past year
Hispanic business owners say the following resources have been helpful throughout the pandemic:
Two-thirds of Hispanic business owners say they’ve felt an increase in support from their community over the past year
Hispanic business owners say the following resources have been helpful throughout the pandemic:
Community support is a two-way street. While 36% said their community was hit particularly hard, 60% of Hispanic entrepreneurs say they’ve volunteered to help their local community during the pandemic.
1. Ipsos Public Affairs conducted the Bank of America 2021 Small Business Owner Report survey online between March 11th and May 1st, 2021 using a pre-recruited online sample of small business owners. Ipsos contacted a national sample of 995 small business owners in the United States with annual revenue between $100,000 and $4,999,999 and employing between two and 99 employees, as well as 300 interviews of Hispanic small business owners, 300 interviews of Black small business owners and 100 interviews of Asian American small business owners. In addition, approximately 250 small business owners were surveyed in each of ten target markets: Atlanta, Boston, Chicago, Dallas, Houston, Los Angeles, Miami, New York, San Francisco and Washington, D.C. The final results for the national, designated market area and demographic segments were weighted to national benchmark standards for size, revenue and region, while the final results for the Hispanic segment were weighted for size, revenue, region, and whether the respondents were primarily English-speaking or Spanish-speaking.

• ONE-YEAR ENROLLMENTS AT FOUR-YEAR COLLEGES — 2016–2020
• PERCENT OF HIGH SCHOOL GRADUATES ENROLLED IN POSTSECONDARY EDUCATION THE SEMESTER AFTER GRADUATING HIGH SCHOOL IN ARIZONA
• HIGH SCHOOL GRADUATION RATE IN ARIZONA IN 2021
• PERCENT OF 16–24 YEAR OLDS IN ARIZONA THAT WERE NOT GOING TO SCHOOL OR WORKING
• COLLEGE ENROLLMENT IN ARIZONA
• PUBLIC HIGH SCHOOL GRADUATION RATES 2018–2019
• COLLEGE ENROLLMENT RATES OF 18- TO 24-YEAR-OLDS
• GRADUATE AND UNDERGRADUATE COLLEGE ENROLLMENT 1970–2020
• COLLEGE ENROLLMENT RATES HAVE DROPPED IN NEARLY ALL STATES 2010–2019
• COLLEGE ENROLLMENT BY AGE
A closer look at schooling for ages 5–17 and 18+ in the Phoenix and Tucson Markets, courtesy of Univision Communications
The Global Citizens Project Scholars program at Northern Arizona University’s Education Aboard program helps students broaden their world view
BY LIZ SALAZAR
An easy-to-understand explanation of this often-polarizing subject
Who says women and members of historically minoritized communities cannot be STEM superstars?
This fiscal year 2021 report from the Arizona Board of Regents offers a greater understanding of postsecondary enrollment and completion trends to assess the educational attainment challenges and opportunities in Arizona
MAPA: THE STATE OF ARIZONA LATINO EDUCATION, POWER AND INFLUENCE REPORT
This All in Education report identifies existing gaps in our educational system to be able to find workable solutions
This mixed-methods research project by UnidosUS explores Latino college completion rates
Source: Making Action Possible (MAP) for Southern Arizona, High School Graduation Rates, 2021 mapazdashboard.arizona.edu/education/high-school-graduation-rates
Source: MAP AZ Dashboard, High School Graduation Rates, 2021 https://mapazdashboard.arizona.edu/education/high-school-graduation-rates
PERCENT OF 16—24 YEAR OLDS IN ARIZONA THAT WERE NOT GOING TO SCHOOL OR WORKING
Source: Education Forward Arizona, Opportunity Youth Progress Meter, 2021 educationforwardarizona.org/progress/indicators/opportunity-youth/?indicators=State::Arizona::Hispanic%20or%20Latino,State::Arizona::White
95.6% OF ENROLLED STUDENTS ATTEND
NOTE: INCLUDES 18- TO 24-YEAR-OLDS ENROLLED IN COLLEGE OR GRADUATE SCHOOL. DATA ARE BASED ON SAMPLE SURVEYS OF THE CIVILIAN NONINSTITUTIONALIZED POPULATION, WHICH EXCLUDES PERSONS IN THE MILITARY AND PERSONS LIVING IN INSTITUTIONS (E.G., PRISONS OR NURSING FACILITIES). RACE CATEGORIES EXCLUDE PERSONS OF HISPANIC ETHNICITY. ALTHOUGH ROUNDED NUMBERS ARE DISPLAYED, THE FIGURES ARE BASED ON UNROUNDED DATA.
Source: National Center for Education Statistics (NCES), “College Enrollment Rates,” May 2021 nces.ed.gov/programs/coe/pdf/2021/cpb_508c.pdf
Source: National Center for Education Statistics (NCES), “College Enrollment Rates,” May 2021 https://nces.ed.gov/programs/coe/pdf/2021/cpb_508c.pdf
NOTE: Includes 18- to 24-year-olds enrolled in college or graduate school. Data are based on sample surveys of the civilian noninstitutionalized population, which excludes persons in the military and persons living in institutions (e.g., prisons or nursing facilities). Race categories exclude persons of Hispanic ethnicity. Although rounded numbers are displayed, the figures are b ased on unrounded data.


The School of Transborder Studies at Arizona State University addresses the challenges and opportunities transborder communities face in the 21 century. The school’s pioneering teaching and research programs build on the expertise of an interdisciplinary and diverse faculty to connect knowledge and public policy analysis with the needs of transborder communities in Arizona and beyond.

By leveraging our location at the Arizona-Sonora transborder region and ASU’s strong global and innovative orientation, our school explores new ways of understanding borders and promoting cross border cooperation, while rigorously educating the next generation of border leaders

 BY KEVIN GUSTAFSON
The Global Citizens Project Scholars (GCPS) is a Northern Arizona University (NAU) Education Abroad program, in collaboration with the NAU Honors College, that provides resources and increases access to a global experience for NAU undergraduate students who may not otherwise have an opportunity to go abroad. Members of the first cohort participated in a series of predeparture classes and workshops on language, culture, global citizenship and cultural awareness. They subsequently spent 12 days in an NAUled program outside of Quito, Ecuador, where they studied and worked with members of the local community.
The NAU Honors College provides opportunities to pursue excellence and makes that experience accessible. GCPS participants were specifically chosen because they were firstgeneration students who had never traveled abroad and had demonstrated financial need. These student leaders were selected to become changemakers on campus and were provided with an immersive experience at the highly affordable rate of $650 per person, including round-trip airfare to Ecuador.
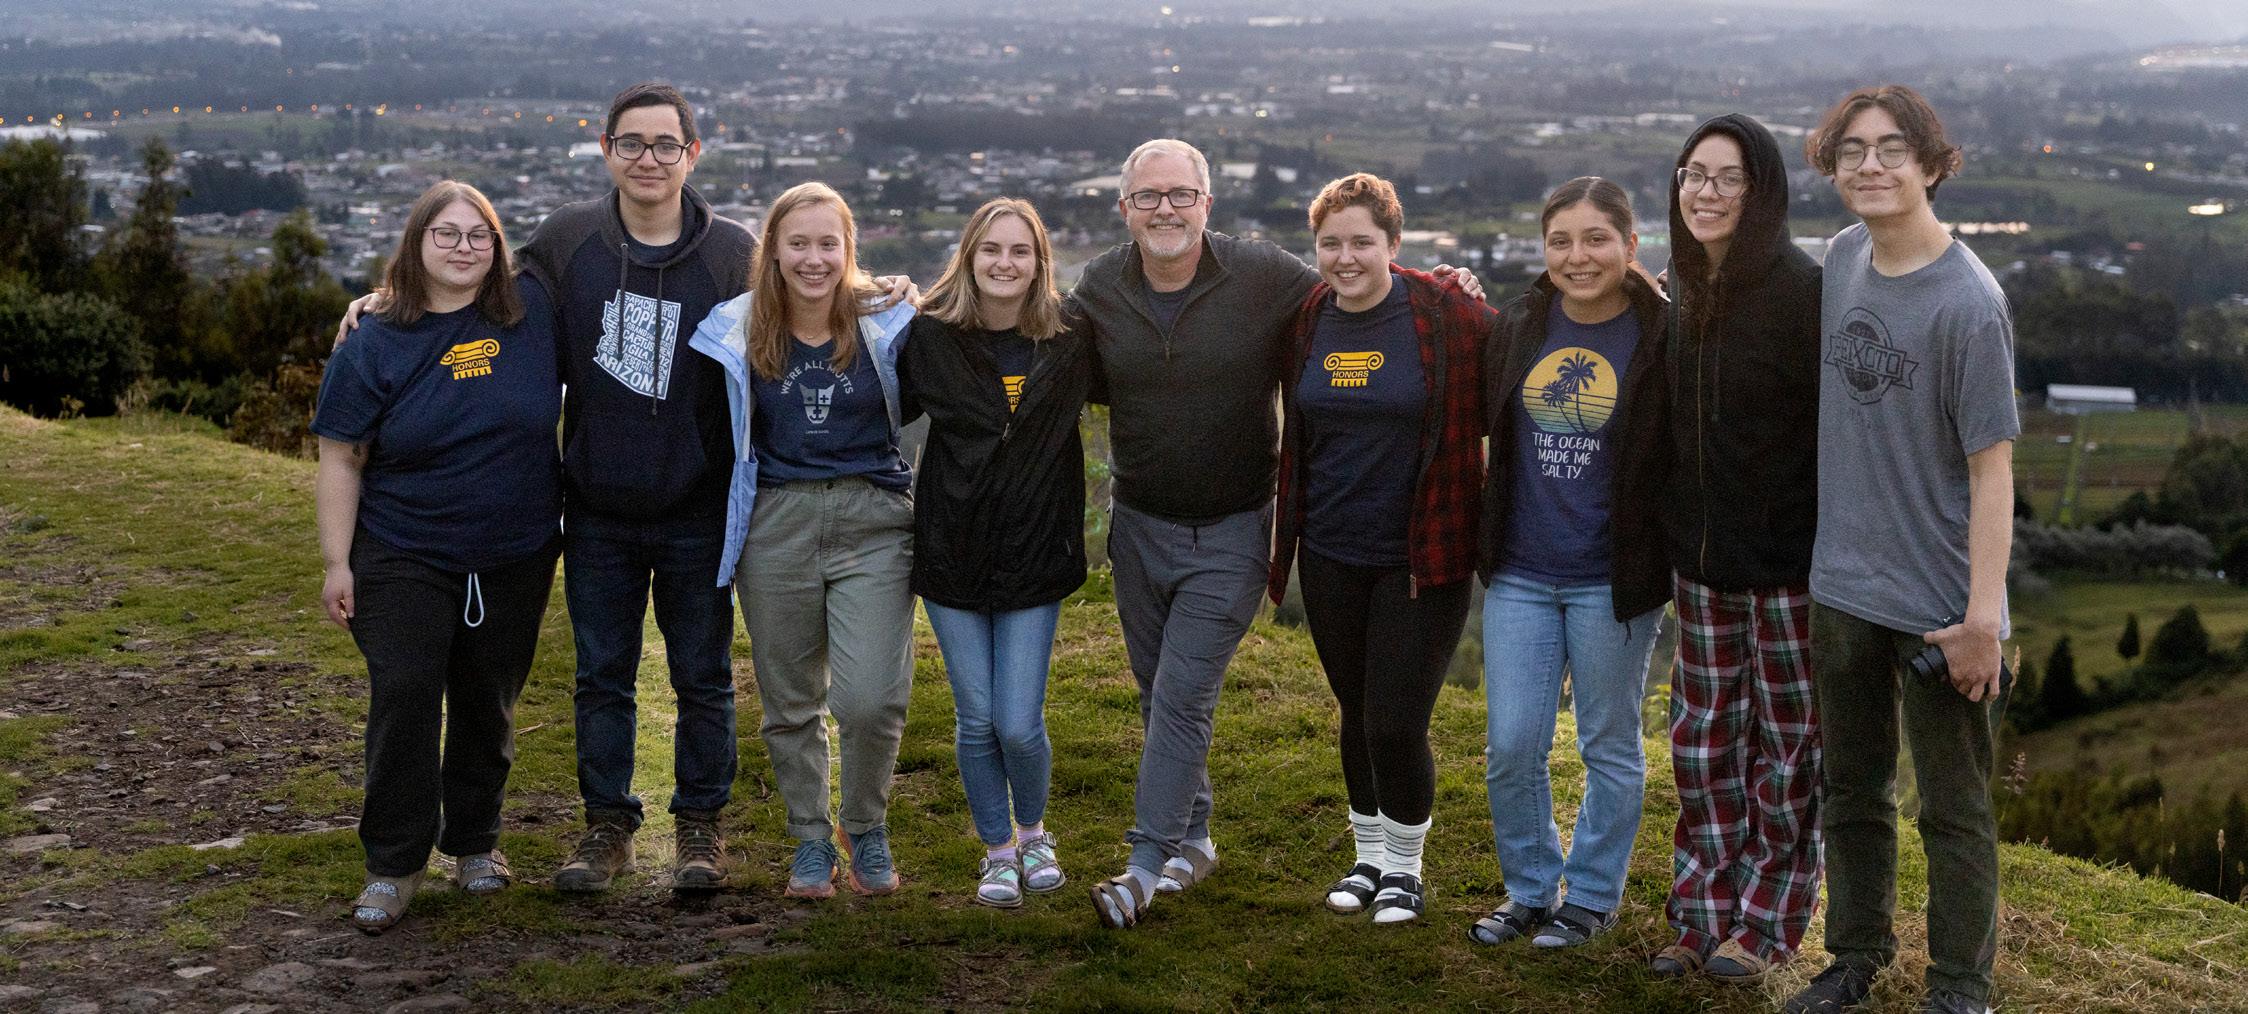
Once selected, students took a five-week course that focused on identity and global citizenship. They learned about cultural responsiveness within rural communities, gained an understanding of the language and culture, and learned about responsible volunteerism/service. I taught the course with the Director of Education Abroad Angelina Palumbo and then subsequently led the trip to Ecuador.
Students traveled to the rural communities of Parango and Oyambarillo, just east of Quito, Ecuador, and stayed at Casa Cielo, a mountainside farm. The main goal for this program was for students to learn about rural life by becoming immersed in the community and collaborating with residents on service projects. Each day, students learned about culture, community, education or the environment through real-word experiences. These experiences included small-scale farming, care of farm animals through maintenance of stalls and coops, English language instruction of local children and instructions on personal hygiene, water quality and nutrition.
To help the students gain meaningful international experiences, they were encouraged to meet and get to know the local communities by visiting the Otavalo market, playing soccer with members of the communities, trekking the mountainside and speaking with leaders about sustainable tourism. They also participated in a barter fair, had cooking lessons and learned about the local cuisine.
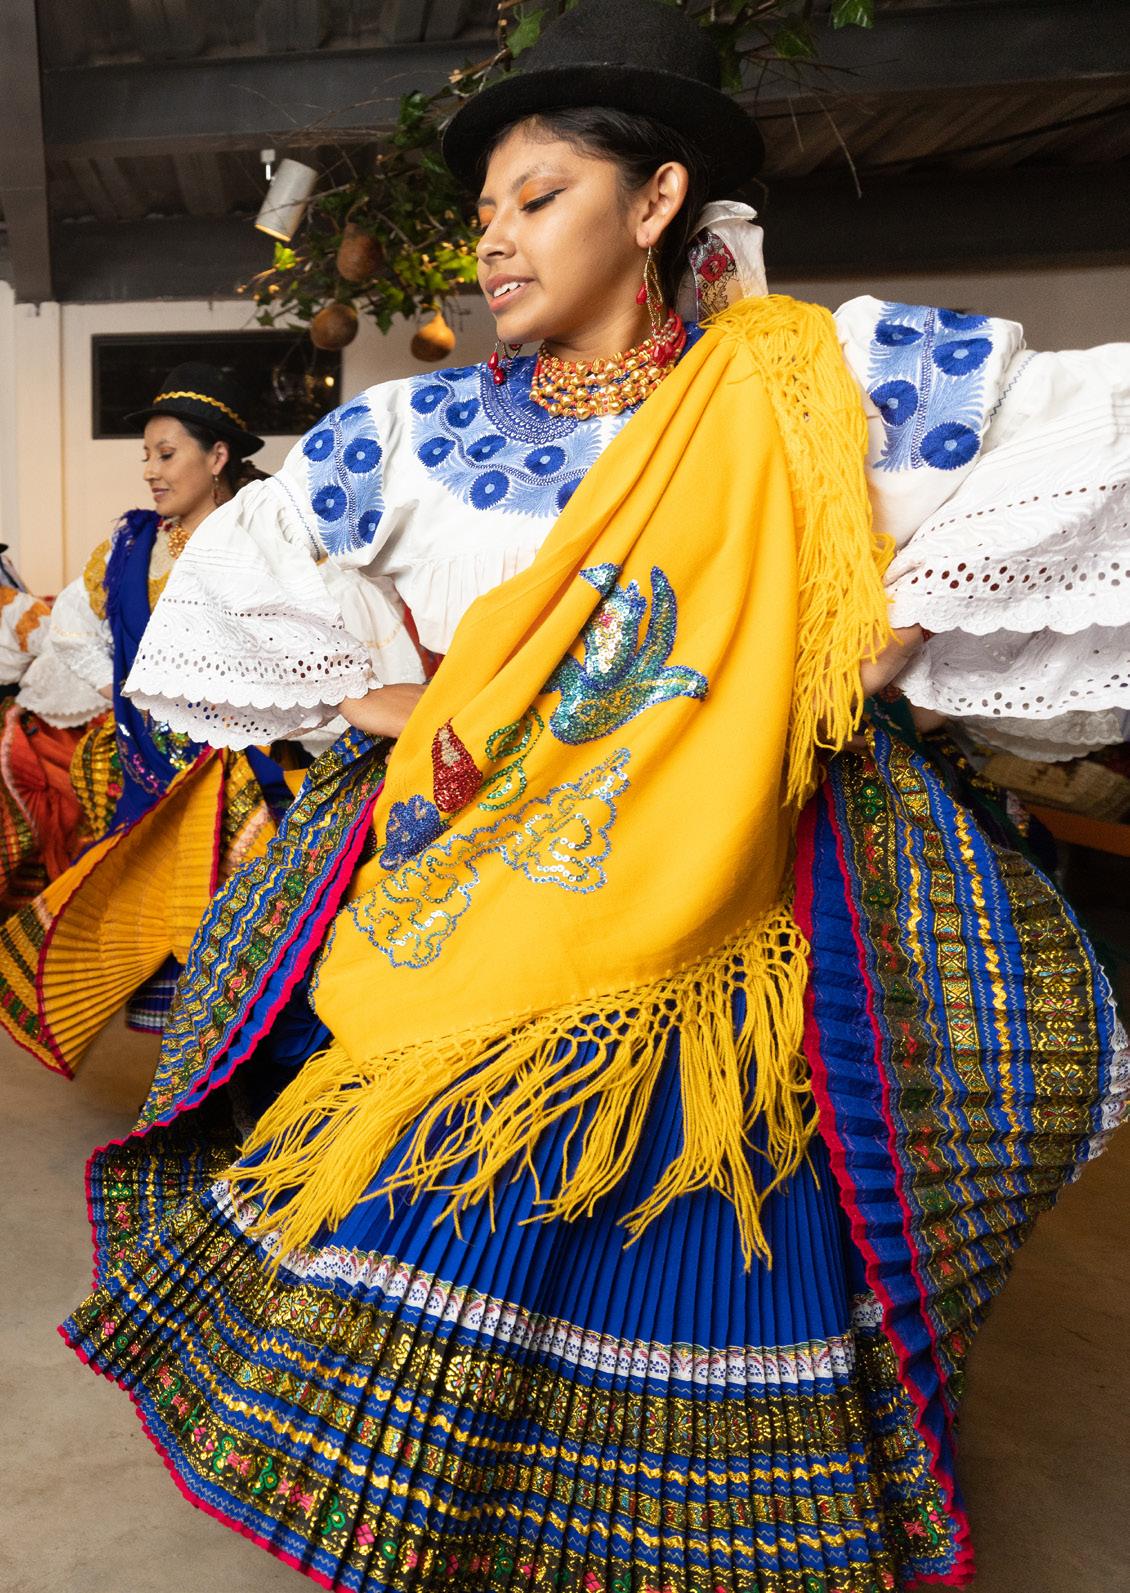
This program was incredibly impactful for students and fostered a sense of empowerment. After the trip, one student said, “This trip has helped me understand more about being a global citizen.... understanding their ways, disregarding anything I have done in the past that may have been similar and trying to do everything as authentically as possible.”
Kevin Gustafson is Dean of the Honors College at Northern Arizona University, Flagstaff.
NORTHERN ARIZONA UNIVERSITY Education Abroad nau.edu/education-abroad
The Global Citizens Project Scholars nau.edu/education-abroad/global-citizens-project-scholar Application Deadline is Oct. 21, 2022 for Spring 2023.
Critical race theory (CRT) is an academic term that refers to the idea that the history of racism in our country’s institutions has created barriers for people of color through racial biases in laws, policies and structures. An example commonly used to illustrate systemic oppression is redlining, a discriminatory practice that prevented certain populations from access to home loans. This systemic financial injustice continues to have adverse effects on communities today.
The word “critical” refers to critical thinking, and the use of the word “theory” is important because CRT is considered a school of thought with different factions. Generally, courses that teach using CRT are college-level courses that explore the intersection of race, class and ethnicity within major institutions like the criminal justice system, the education system and financial systems. This academic and social movement began in the mid-1970s and is mainly credited to former Harvard Law professor Derrick Albert Bell Jr.
Nearly 30 states have introduced or plan to introduce legislation that addresses CRT. The bills usually do not specifically mention the phrase “critical race theory” and instead use broad language referring to discussions on unconscious bias, inherent privilege and systems of oppression. This, in part, has to do with conflating CRT as it was originally intended with general academic content for students in the public K–12 educational system. CRT has unfortunately become a catch-all for the discussion of race and ethnicity in the classroom.
CRT opponents claim that teachers are indoctrinating students against the United States or that students learn certain races are better or worse than others for a multitude of reasons. Another common complaint against CRT is that students are taught that one race is “to blame” and they should feel bad if they are a member of that race.
• These topics are irrelevant to course content.
• CRT, ethnic and gender studies are too focused on our difference.
• Students will feel uncomfortable or guilty about their race or ethnicity.
• Institutional and systemic racism don't affect our society today.
• These topics are interwoven in the fabric of the country's history.
• We have to face history to learn from it and create a more just society for all.
• Bans have a chilling effect on teachers, leading them to present an edited and often inaccurate version of history.
• Institutional and systemic racism still affect our society today.
Those who fight against bans on CRT argue that a sanitized version of history is an inaccurate version. They also argue that systemic racism and its effects must be studied to be stopped, and that studying accurate history is how we learn from it. They are also concerned that content bans in school will have a chilling effect on teachers and students by stifling open dialogue in the classroom.
Long before CRT became a recurring topic in the news, Arizona was in the spotlight for a controversy over a Mexican American studies
• is an academic term;
• traditionally used in higher education;
• explores racial biases in law, policy and structures;
• critically analyzes the lasting effects of institutional racism; and
• began as a social movement in the mid-1970s.
Redlining is a good example of how historical racism in the banking industry still affects minorities today. Britannica explains redlining as “an illegal discriminatory practice in which a mortgage lender denies loans or an insurance provider restricts services to certain areas of a community, often because of the racial characteristics of the applicant’s neighborhood. Redlining practices also include unfair and abusive loan terms for borrowers, outright deception, and penalties for prepaying loans.”
The term is a reference to how loan corporations would use a red pen to outline mixed-race or African American neighborhoods. Neighborhoods deemed the most worthy of loans were outlined in blue or green, and a third tier, also deemed eligible for loans, was outlined in yellow.
program in the Tucson Unified School District (TUSD). In the early 2000s, the program was popular among students and had proven to help boost graduation rates by providing culturally relevant content to Mexican American students in Tucson. On the heels of a large student walkout on national immigration policy, activist Dolores Huerta gave a political speech at a Tucson high school in April 2006, drawing the ire of local conservative politicians for partisan remarks. By 2008, legislators asked TUSD to defend the program at the Capitol because some lawmakers accused the series of courses to be a “sweatshop for liberalism” and was “political indoctrination.” The program was disbanded in 2011 after a contentious public debate.
In the 1930s, federally backed loans weren't given to residents in South Phoenix. The neighborhood was labeled “hazardous,” but was the only place where minorities were allowed to live at the time, and they had limited access to home loans of any kind. The result?
Nearly 30 states have introduced or will introduce legislation to ban teachers from discussing, for example, topics such as race, ethnicity, gender, privilege and white supremacy. Some bans even include universities and teacher prep programs.
Education policy has become a highly polarizing issue that is pitting parents, teachers, students and lawmakers against each other against the backdrop of culture wars, pandemic fatigue and political unrest.
Fast-forward to 2022 and everything old is new again. Several versions of “anti-CRT” bills have been introduced during the Arizona legislative session that propose a ban on academic content that could be interpreted as placing blame for historical events based on race, ethnicity and gender. The different versions of the bills and the amendments have had varying degrees of success in the legislative process, with votes mostly falling on party lines, and one Republican outlier who did not want teachers fined under the law. Ultimately, the bills died amid the tense debates leading up to the end of the legislative session.
More anti-CRT bills or something similar will surely keeping come back in future legislative sessions throughout the country—and will again be met with passionate debate on both sides. If you’re interested in learning the facts about CRT, its origins and the current debate, research the topic from multiple points of view, including parents, teachers, students and historically oppressed populations. Seek out arguments from sources on the range of
the political spectrum because polarizing “culture war” topics are only further inflamed when people only seek out information that confirmations what they already believe.
Liz Salazar is the Arizona Senior Policy Strategist for UnidosUS. UnidosUS is the nation’s largest Latino civil rights and advocacy organization. Since its founding in 1968, it aims to contribute to a strongerAmericabyelevatingthevoicesofLatinosanddefendingand advancing the community’s concerns. UnidosUS lobbied against the passage ofanti-CRTbills duringthis legislative session inArizona.

For decades, there have been investments made to increase the diversity of science, technology, engineering and mathematics (STEM) students and professionals, primarily through education and outreach. Unfortunately, these efforts have not resulted in degrees attained or a professional workforce that reflects the demographics of Arizona, the Southwest region or the United States.
The Center for Materials Interfaces in Research & Applications (¡MIRA!) at Northern Arizona University (NAU) was created as a disruptive force in STEM, removing barriers between the worlds of STEM and cultural identities that often serve to limit the participation of women and historically minoritized communities. In ¡MIRA!, science, engineering, cultures and identities are woven together like a brightly colored sarape to create a scientific home where students, faculty, staff and community members are invited to engage in scientific discovery, education and innovation by bringing their individual and cultural identities to make ¡MIRA!— and our scientific communities—stronger.
How does ¡MIRA! accomplish this goal? It starts with what truly makes ¡MIRA! unique: its people. ¡MIRA! students and faculty are more than 50% women and historically minoritized individuals, a number unheard of for a physical science research center. These fields on average graduate just 2–5% Hispanic/Chicano/ Indigenous PhDs annually in the U.S. The center reflects Arizona and the Southwest—and this matters. When ¡MIRA! engages with communities, the engagement is a mirror of the Hispanic/Chicano and Indigenous faculty and students, and the interactions are often in the language of the community. ¡MIRA! students find a home where their cultural identities are not only reflected but invited in to create the unique fabric that is ¡MIRA!
Students, faculty and staff are encouraged to engage through the many outreach initiatives led by ¡MIRA! faculty (discussed in detail below). Importantly, ¡MIRA! is equally focused on two important missions: to diversify STEM and to promote excellence in scientific research. This approach sets a tone that success in one is not dependent upon sacrifice of the other; in fact, it’s just the opposite.
By creating a synergistic continuum of activities and engagement from research to diversity, ¡MIRA! is changing the game—once and for all—and diversifying STEM.
As a scientific research center ¡MIRA! is world-class, with internationally recognized and award-winning scientists and engineers, performing and communicating cutting-edge research that tackles tomorrow’s greatest challenges (i.e., energy, the environment and health) through materials technology development. ¡MIRA! scientists are advancing next-generation virus detection (e.g., COVID), generating networks for the nearfuture quantum computing age and much more. Our diverse students, from first-semester undergraduates to final-semester Ph.D.s, work hand in hand with the research center’s faculty and staff to solve tomorrow’s problems today.
¡MIRA! supports students in three key ways:
• The ¡MIRA! Student Council provides professional and educational development opportunities in a supportive environment;
• The ¡MIRA! Scholars program provides financial support to undergraduate students to perform cutting-edge research alongside the research center’s faculty. Students are paid
a research stipend that allows them to participate in research without having to make financial sacrifices; and
• It also encourages students to attend STEM conferences such as the annual National Diversity in STEM Conference led by the Society for the Advancement of Chicanos/ Hispanics and Native Americans in Science (SACNAS). This year’s conference will be Oct. 27–29 in San Juan, Puerto Rico. NOTE: At press time, SACNAC was monitoring the situation in Puerto Rico because of Hurricane Fiona, but no changes had been made to the date or location. Please check the SACNAC website for updates.
This kind of support is extremely important for first-generation and historically minoritized students, who typically need to work during their college years and thus often miss out on important pathways to scientific research. Although only two years old, the ¡MIRA! Scholars program is having a tremendous impact, creating opportunities for science students to work as actual scientists.
The impact of ¡MIRA! begins in the lab, but the real impact is felt in the community. ¡MIRA! is a hub of outreach. Through partnerships that include multiple national agency-sponsored collaborations and the incredible commitment of ¡MIRA! faculty and staff, ¡MIRA! is helping to not only bring the world of discovery and innovation to local, regional and national communities, it is doing it by a strong commitment to maintaining the different cultures within the ¡MIRA! community. ¡MIRA!, for example, has supported the Sparking Curiosity in Quantum Science (SPARCQS) initiative of the Center for Quantum Networks (CQN). The initiative, led by Dr. Inès Montaño, an NAU associate professor, applied and material science, has been designed to bring quantum science to the communities of Arizona and beyond.
This summer, the SPARCQS team visited Arizona summer camps, engaged high school interns through the NAU CARES program led by Dr. Naomi Lee, an assistant professor in the Department of Chemistry and Biochemistry. The team also engaged thousands of students at the Mall of America’s 30th anniversary Celebration of STEAM event. (NOTE: STEAM adds the arts to the STEM initiative). SPARCQS involves not just students but also their families and communities—and does so in English and Spanish. It is a great representation of the unique approach and impact of ¡MIRA! and its partners.
¡MIRA! is flipping the script on scientific discovery and innovation— and helping Arizona lead the way.
Gabriel A. Montaño is the founder and director of the Center for Materials Interfaces in Research and Applications (¡MIRA!) and a professorofappliedphysicsandmaterialsscienceatNorthernArizona University, Flagstaff.
CENTER FOR MATERIALS INTERFACES IN RESEARCH & APPLICATIONS (¡MIRA!)
Northern Arizona University Flagstaff, AZ 928.523.7541
mira@nau.edu mira.nau.edu
CENTER FOR QUANTUM NETWORKS
1630 E University Blvd. Tucson, AZ 85721-0094 cqn-erc.org
SOCIETY FOR THE ADVANCEMENT OF CHICANOS/HISPANICS AND NATIVE AMERICANS IN SCIENCE (SACNAS)
MAILING ADDRESS: P.O. Box 8526 Santa Cruz, CA 95061 831.459.0170 sacnas.org
FISCAL YEAR 2021

The information in this report denotes the following:
• Forty-six percent of Arizona’s 2020 high school graduates pursued education beyond high school.
• The pandemic has impacted college enrollments at two-year institutions.
• Approximately 28 percent of Arizona’s 2020 high school graduates pursued a four-year degree. According to the American Community Survey and Arizona state demographer, this is less than the number of estimated bachelor’s degree holders who will be aging out of the workforce.
• Arizona public universities enrolled roughly 68 percent of Arizona high school graduates that chose a four-year degree program.
• Where students went to high school correlates with whether they enrolled in and completed a fouryear degree.
• The number of Black and Hispanic high school graduates enrolled in a four-year degree program continues to increase, while Native American enrollment has decreased.
• Year-over-year, the percent of high school graduates enrolling in a four-year college slightly decreased, and the enrollment gap continues between Black, Hispanic and Native American high school graduates and White or Asian high school graduates.
• Although a college completion gap persists, the percentage of degree completers improved among all racial and ethnic groups over the last five years.
• Arizona female high school graduates enrolled and completed college at much higher rates than their male counterparts.
• For the first time, the report contains information on graduates that are economically disadvantaged and English learners. Also, for the first-time, the report contains data on high school graduates diagnosed with a disability who qualify for services under the Federal Individuals with Disabilities Education Act.

REPORT 2021 - 22

In Arizona, 45% of PK-12 students are Latino, but only 14% of state education board members are Latino, including the Arizona State Board of Education, the Arizona State Board for Charter Schools, and the Arizona Board of Regents. While the numbers of Latinos serving on our education boards tell a bleak story, when looking at the education workforce there’s an even more somber tale. In this year’s report we look at both school administrators and the teaching workforce. With 16% of the teaching workforce and school administrators identifying as Latino, we know the vast majority of critical decisions impacting Latino students are being made without the community’s perspective.
As mentioned in the 2020-21 MAPA report, the disproportionate representation in positions of leadership and power has been a critical component to why students and families continue to face inequities in the systems that are there to support them. There’s a growing body of research that indicates that test scores, suspension rates and attendance are impacted by the demographic match between teachers and students (Figlio, 2017). The longer we wait to address the issues that have long plagued Latino students and their families, the more significant the damage to our future economic growth and stability. The current 45% of PK-12 students, represent a large majority of Arizona’s future workforce. At our current trajectory, we are failing to prepare these students to take on the jobs required to secure the welfare of our state and nation. We have a moral and economic obligation to choose a path that rejects harmful and discriminatory policies that impact Latino and communtities of color. It is time for us to realize that these policies have created division, are ineffective and are responsible for the rise in poverty and decrease in educational achievement for Latino students and their families.
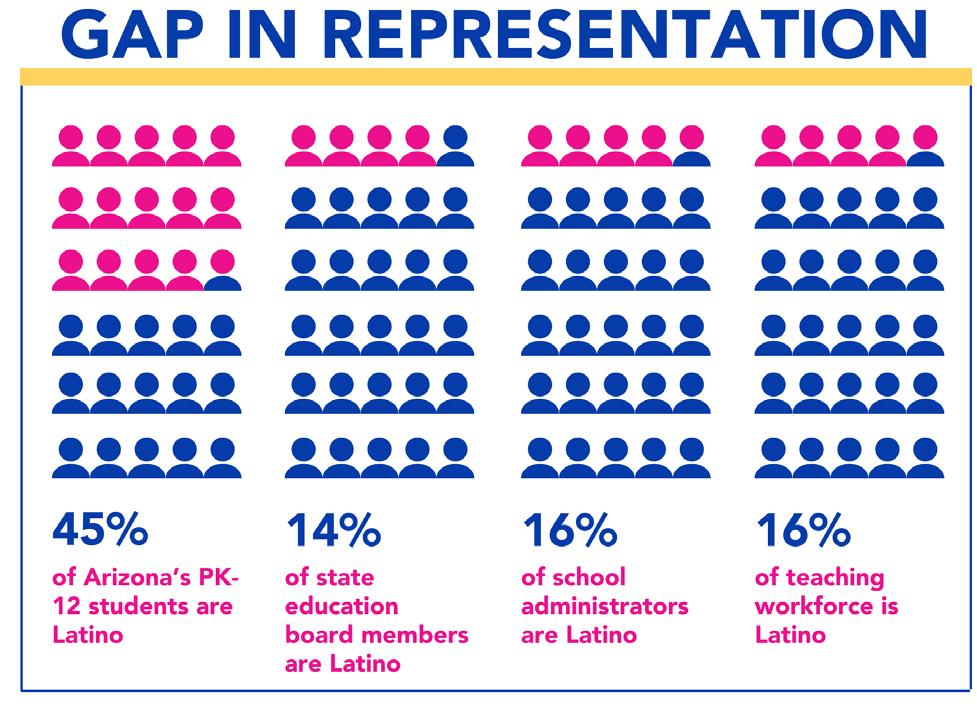
ALL In Education realizes that in order to enact significant and long-lasting change in our systems, we must also present solutions. Our response has been the successful launch of our Parent Educator Academy, Adelante Fellowship and LISTO (Leaders In Support Of Transformational Opportunities) Academy. Adelante is currently comprised of 25 emerging leaders and is designed to provide them an understanding of advocacy in education and explore the role that identity and lived experience play in influencing systems change. LISTO graduated its first cohort of 13 values-based leaders that have gained the skills and knowledge to make decisions through a data driven, equitable lens.
We are committed to our work and will update our findings annually so that they reflect the work that has been done and what we have accomplished as a state in regards to addressing the issue of equity and providing students with access to opportunities and justice in our systems.
Kate Sablosky Elengold, Jess Dorrance, Amanda Martinez, Patricia Foxen, and Paul Mihas
Source: www.unidosus.org/publications/dreams-interrupted-a-mixed-methods-study-assessing-latino-college-completion/
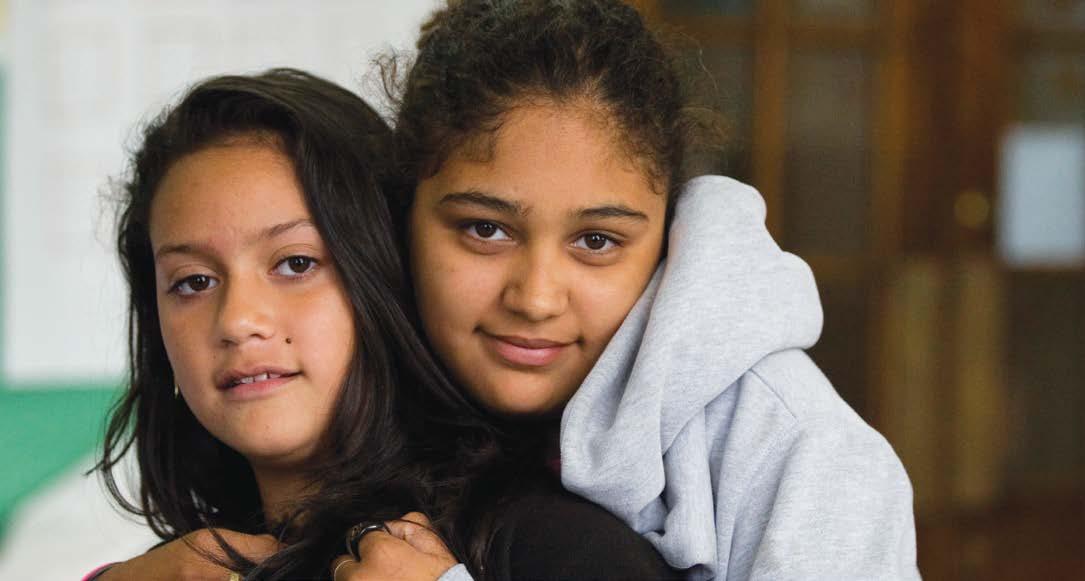
The current literature on the Latino college experience makes clear that there are many barriers to college completion that disproportionately affect a diverse array of Latino students.45 Although there has been a lot of discussion about debt aversion in the Latino community,46 including in higher education,47 there has been little research done on the relationship between debt aversion and college completion. This is particularly important in light of the outsized negative effects for those who take on student debt but fail to achieve a degree.48 This is especially true for borrowers of color, as “the cost of America’s runaway student debt crisis falls disproportionately on Black and Latinx communities.”49
Our research gives weight to the conclusion that Latinos are more debt averse than non-Latinos. But it does not do so in a vacuum. Rather, it recognizes the complexity of debt aversion and how it is impossible to disentangle debt aversion from either other barriers to completion or from the lived realities of Latinos in America. Without a healthy respect for that entanglement, targeted interventions may fall flat.
Therefore, we offer a series of insights arising from our data and analysis. In keeping with our overall approach to understanding and calling attention to the complexity of higher education equity, these insights are also connected.
When discussing debt aversion as related to Latino college completion, it is essential to communicate the complexity of the construct. Discussing debt aversion as either a personal failure or a personal virtue fundamentally misconstrues college financing as a personal decision divorced from the structural scaffolding of higher education policy and financing. Rather the “impossible dilemma” of how to finance higher education arises because of the nation’s turn to an individualized and debt-financed college system.50
Messaging that debt aversion is a simple financial decision also risks pitting vulnerable groups against each other — encouraging Black borrowers to be more debt averse, for example, or encouraging Latino students to borrow more. As our data shows, individual approaches to debt are developed from a variety of inputs and connected to a variety of outputs.
At a concrete level, this means that interventions must not be solely targeted to the individual student. Asking a student simply to take on more or less debt to start or finish a degree ignores the complex conditions our data exposes. In the absence of large structural change like free or reducedprice college programs, interventions like completion grants and emergency grants are advisable.


• HISPANIC HOMEOWNERSHIP RATE 2000–2021
• HISPANIC OWNERSHIP EXPECTED TO REACH 50% BY 2025
• STATES WITH THE HIGHEST LATINO MIGRATION
• PERCENT OF INCOME SPENT ON HOUSING
• SHARE OF INCOME SPENT ON HOUSING
• SHARE OF LOW AND VERY LOW-INCOME HOUSEHOLDS WITH A LOW HOUSING COST BURDEN
• INCOME NEEDED TO AFFORD A MEDIAN-PRICED HOME IN EACH OF THE TOP 10 MOST POPULOUS LATINO MARKETS
• TOP 10 MARKETS THAT ADDED THE MOST HISPANIC-OWNER HOUSEHOLDS TO THE U.S. ECONOMY BETWEEN 2019–2021
• MARICOPA COUNTY IS IN THE TOP 5 MOST POPULOUS HISPANIC COUNTIES
• MORTGAGE-READY ADULTS AGED 45 AND UNDER
REAL ESTATE
A look at home improvement and real estate holdings for Hispanics in the Phoenix and Tucson markets, courtesy of Univision Communications
THE STARTER HOME PROJECT HELPS
LOW-INCOME FAMILIES OWN HOMES BY GRACIELA MARTINEZ
Habitat for Humanity of Northern Arizona is breaking the cycle of poverty for low-come families with its Starter Home Project
2021 STATE OF HISPANIC HOMEOWNERSHIP REPORT
This report from The National Association of Hispanic Real Estate Professionals (NAHREP) says Hispanic homeownership continues to increase at a steady rate
THE GAP – A SHORTAGE OF AFFORDABLE HOMES
The National Low Income Housing Coalition says there is a limited number of affordable rental homes available to extremely low-income renters


ACCORDING TO FREDDIE MAC, 32% OF LATINO ADULTS AGED 45 AND UNDER HAVE THE CREDIT CHARACTERISTICS TO QUALIFY FOR A MORTGAGE. THAT NUMBER RISES TO 40.8% WHEN CONSIDERING ONLY LATINO FAMILIES WHO DON’T ALREADY HAVE A MORTGAGE.


 BY GRACIELA MARTINEZ
Northern Arizona’s breathtaking scenery makes it a desirable place to live; however, the lack of affordable housing is often a dealbreaker for low-income families. In Flagstaff, for example, the median house price has reached $710,000, which is a 66% increase from 2019.
This is when Habitat for Humanity of Northern Arizona (HFHNA) decided to get involved to help low-income families afford to stay in the Flagstaff area. HFHNA is an affiliate of the global nonprofit housing organization that was founded in 1976 by Millard and Linda Fuller. It operates in local communities in all 50 U.S. states and more than 70 countries. It currently has more than 80 U.S. affiliates, and HFHNA is one of its 13 affiliates in Arizona.
In light of skyrocketing rental prices, HFHNA has partnered with local contractors and volunteers to provide families with homeownership opportunities. Supporters include WesPac Construction, Buzzard Construction and Coconino Community College (CCC). To address the lack of affordable housing, Karl Eberhard, an architect and past Habitat board president, developed the Starter Home design concept.
The starter homes have 400 square feet of living space that is designed for two adults and one child. They are priced at $100,000, and a qualifying family can purchase a home with just a $1,000 down payment and a monthly mortgage of $833 with 0% interest. In addition to being affordable, these starter homes are energy efficient and environmentally conscious.
To make its homes affordable, HFHNA says that it uses a variety of resources. It partners with municipalities to get access to affordable land leases or set up land trusts, works with local contractors to keep construction costs low, and uses volunteer labor. Donations and grants cover the upfront costs, which the partner families repay through 0% interest mortgages. Those mortgage payments then go back into the organization’s build fund to support construction of the next house. In this way, all donations cycle over and over again through the community.
This cycle is part of HFHNA’s core ethos: A hand up, not a handout. According to the organization, Habitat homes are not free; all HFHNA homeowners buy and own their homes. The starter home
project was set up to help families own their homes. It is made possible by low down payments, affordable mortgages and sweat equity. Sweat equity is essentially community service that goes toward the construction of a family’s own starter home and other programs.
HFHNA prepares families for success by giving them the opportunity to build equity through the Starter Home Project. When a family is ready to leave and purchase a larger home, the family will sell their original home back to HFHNA, which will then resell the home to another qualifying family. As part of the program requirements, families in the program also create savings plans, which they then “earn back” to help finance their new homes and other ventures.
This unique approach has a simple, but vitally important goal: to break the cycle of poverty to help build stable families and communities.
‘…DONATIONS CYCLE OVER AND OVER AGAIN THROUGH THE COMMUNITY. THIS CYCLE IS PART OF HFHNA’S CORE ETHOS: A HAND UP, NOT A HANDOUT. ACCORDING TO THE ORGANIZATION, HABITAT HOMES ARE NOT FREE; ALL HFHNA HOMEOWNERS BUY AND OWN THEIR HOMES.’
Source: nahrep.org/downloads/2021-state-of-hispanic-homeownership-report.pdf


In 2021, the Hispanic homeownership rate increased to 48.4 percent, up from 47.5 in 2019, an increase consistent with the trendline over the last seven years. Latinos added a total of 657,000 owner households between 2019 and 2021. Since 2014, the first year of positive homeownership growth following the Great Recession, Latinos have added a net total of 1.9 million owner households.1
I' m glad t ha t t he home ow nership r at e incr eased , bu t i t to o k an incr edible amoun t o f w ork and c ommi tm en t fr o m t he pr of essionals to ge t t h em to c losing . It w a s n ot easy to ge t t hose o ers ac ce pt ed. Eve r y s ingle one o f t hese new homeo wn ers i n t h e d at a had to go th ro ugh a lot of hoops just to ge t to t h e fini s h l ine and ge t t heir key s.”
No ra Ag uirr e , Nor a A g uirr e Team w it h Ce ntur y 21 Amer ic an a, Las Vegas , N V


and continued renting. Accordingly, mortgage data indicates that Latinos experienced a 19.1 percent home purchase denial rate for conventional loans and were 81 percent more likely to be denied than their non-Latino counterparts. 3
In a sharp reversal of trends, the non-Hispanic White population accounted for over half (55.1 percent) of homeownership growth and 41.5 percent of household formation growth since 2017. While Latinos accounted for the lion’s share of homeownership and household formation growth in the earlier part of the decade, Latinos accounted for just 20.6 percent of homeownership growth and 29.2 percent of household formation growth respectively during that same period. 2 Speculatively, the unexpected boom in non-Hispanic White household formations since 2017 (2.7 million) resulted primarily from Millennials who formed
households at a slower rate when compared to previous generations and who relied on generational wealth. These individuals were able to take advantage of recordlow interest rates and enter the homeownership market. However, given demographic tailwinds in favor of Latinos, this trend is not predicted to continue.
While Latinos are twice as likely to use Federal Housing Administration (FHA) to finance their homes than their non-Hispanic White counterparts, 85 percent of survey participants in NAHREP’s 2021 Top Real Estate Practitioners Study indicated that their FHA borrowers faced competitive disadvantages, 44 percent worked with their clients to switch them to conventional financing, and 17 percent reported that their FHA borrowers gave up on their home searches completely
Latinos are concentrated in areas experiencing the most severe housing inventory and affordability challenges in the country. Arizona (28.6 percent) and Florida (25.6 percent) experienced the highest home price appreciation in 2021, pricing out many would-be firsttime homebuyers.4 These two states are home to 12.7 percent of the Latino population. 5 In the 10 most populous Latino markets, housing underproduction significantly worsened from 2012 to 2019, with Texas and Florida, two states that house more than a quarter (27.6 percent) of the Latino population exhibiting the steepest increases. 6 Additionally, like much of the country, Latino would-be homebuyers are losing a significant proportion of housing
Wit h t h e cli en t s I w as wo r king with on the Hispanic side, it was challenging acr os s t he boar d because th e en tr y pric e poin t w a s m ov ing so quickl y and demand was pushing t h e p rice s so much over t h e l is t p ric e w her e i t wa s al l abo ut w h o had mor e cash . On a ve rage , i t pr obabl y took 6 to 10 o ers to fina ll y ge t to a c losing .”
Anthon y Gibson , A us ti n Pr oper ti e s G ro u p w it h Ke ll er W illi ams R ealt y, Au st in , T X
AMONG NON-MORTGAGE HOLDERS
SO UR CE: FR EDDIE MAC
stock to institutional investors. In Q3 of 2021, at least 23 percent of properties were purchased by investors in each of the top 20 most populous Latino markets. Among these, several markets experienced investors purchase shares as high as 38 to 39 percent.7
The San Bernardino-RiversideOntario metro area in California, locally known as the Inland Empire, produced the most new Latino homeowners between 2019 and 2021, adding a total of 88,051 new Latino owner households. 8 Looking


ahead, 40.8 percent of Latino adults aged 45 and younger who don't currently have a mortgage, are mortgage ready. 9 A list produced in conjunction with Freddie Mac ranked all metros by the number of mortgage-ready Latinos and compared the percentage of those who can afford the medianpriced home to the amount of housing stock available. Findings showed the McAllen, El Paso, and Brownsville, Texas markets offer the greatest opportunities for Latino homeownership growth. Additional opportunity markets that topped the list were Las Cruces, NM in the Southwest, Memphis, TN in the South, and Cleveland, OH in the Midwest.10
With a median age of 30, Latinos are 14 years younger than the non-Hispanic White population and continue to be in their prime homebuying years. Nearly 2 in 3 Latinos are aged 40 or younger.11 Between 2010 and 2020, Latinos accounted for over half (51 percent) of the nation’s population
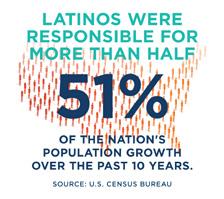
growth12 and were responsible for the overwhelming majority (80.8 percent) of labor force growth.13 Projections show these trends will continue, with Latinos predicted to account for 78 percent of net new workers between 2020 and 2030.14 Furthermore, predictions indicate that between 2020 and 2040 Latinos will account for 53.1 percent of household formations, while projections show the number of non-Hispanic White households will decline.15
In 2021, the Hispanic homeownership rate continued its upward trajectory, consistent with the trendline of the last seven years. This positive growth comes despite a hostile 2021 real estate market, particularly for low-wealth, first-time homebuyers who rely on low down payment loan products. While the proportional share of new Latino homeowners decreased from its peak of 68.0 percent in 2015 to only 18.1 percent in 2021,16 the pendulum shift occurred while housing inventory dipped to historic levels. Additionally, rising price points pushed homeownership out of reach for many first-time homebuyers, particularly in the heavily Latino-populated markets of California, Florida, and New York. Notably, many of the largest homeownership gains occurred in more affordable and less Latino-populated markets in the Midwest and the South.
The widening housing inventory shortage, compounding underproduction of housing, and the rise in institutional investors sweeping up single-family homes have exacerbated the affordability crisis. NAHREP’s survey of real estate practitioners reaffirms these problems, indicating a strong seller bias in favor of institutional investors, conventional borrowers, and individuals able to make large down payments or all-cash purchases.
Latino youth, high workforce participation, and unwavering commitment to homeownership attainment reassure that future growth in the homebuyer market remains largely dependent on the Latino population. Congruently, the Urban Institute predicts that Latinos will account for 70 percent of homeownership growth over the next 20 years. However, NAHREP warns that this prediction is not guaranteed. Inventory challenges must be solved, and the U.S. housing and home lending industries must create an environment that is more conducive to first-time homebuyers, especially for communities of color. Failure to address the housing supply crisis could result in a steep decline in the overall homeownership rate and have a devastating impact on the nation's GDP and economic well-being.

THE GAP A SHORTAGE OF AFFORDABLE HOMES, 2022
Note: Extremely low-income (ELI) renter households have incomes at or below the poverty level or 30% of the area median income. Source: NLIHC tabulations of 2020 5-Year ACS PUMS Data.
TABLE 1: LEAST AND MOST SEVERE SHORTAGES OF RENTAL HOMES AFFORDABLE TO EXTREMELY LOW-INCOME HOUSEHOLDS ACROSS THE 50 LARGEST METROPOLITAN AREAS
Source: NLIHC tabulations of 2020 5-Year ACS


• DEFINITIONS
• PERCENTAGE OF HOUSEHOLDS WITH FOOD INSECURITY
• PERCENTAGE OF HOUSEHOLDS WITH FOOD INSECURITY BY STATE
• FOOD INSECURITY AMONG HOUSEHOLDS WITH CHILDREN
• U.S. FOOD SECURITY 1995–2020
• ARIZONA HAS GREATER FOOD INSECURITY THAN THE NATIONAL AVERAGE
• PERCENTAGE OF FOOD INSECURE CHILDREN ARIZONA AND MARICOPA COUNTY VS. U.S.
• HOUSEHOLD FOOD INSECURITY AMONG FAMILIES WITH SCHOOL-AGE CHILDREN
• U.S. BLACKS AND HISPANICS HAD THE HIGHEST FOOD INSECURITY IN HOUSEHOLDS WITH CHILDREN – 2010–2019
This special feature, courtesy of Univision Communications, examines Hispanic habits in the Phoenix and Tucson markets when it comes to grocery shopping and dining out
After the year 2000, this global health organization, headquartered in Phoenix, decided it also should help families in its own backyard. Twenty-two years later, it is on track this year to serve more than 10,000 families in the Valley with four main programs
READERS SHOULD NOTE THAT THESE ARE 2019 STATISTICS COLLECTED IN DECEMBER 2019 AND DO NOT REFLECT THE POTENTIAL IMPACT OF THE CORONAVIRUS DISEASE (COVID-19) PANDEMIC THAT BEGAN IN 2020.
• FOOD INSECURITY – At times during the year, these households were uncertain of having, or unable to acquire, enough food to meet the needs of all their members because they had insufficient money or other resources for food. Food-insecure households include those with low food security and very low food security.
• LOW FOOD SECURITY – These food-insecure households obtained enough food to avoid substantially disrupting their eating patterns or reducing food intake by using a variety of coping strategies, such as eating less varied diets, participating in federal food assistance programs or getting food from community food pantries .
• VERY LOW FOOD SECURITY – In these food-insecure households, normal eating patterns of one or more household members were disrupted and food intake was reduced at times during the year because they had insufficient money or other resources for food.
U.S. AVERAGE: 10.7%
MARRIED COUPLES WITH CHILDREN
WITH CHILDREN < 18
WITH CHILDREN < 6
SINGLE MEN WITH CHILDREN
28% 16% 15% 15% 12% 10% SINGLE WOMEN WITH CHILDREN
Source: U.S. Department of Agriculture, Economic Research Service, Food Security in the U.S., Key Statistics and Graphics (Using data from the Current Population Survey Food Security Supplement, U.S. Census Bureau) www.ers.usda.gov/topics/food-nutrition-assistance/food-security-in-the-u-s/key-statistics-graphics/
Source: U.S. Department of Agriculture, Economic Research Service, Food Security the U.S. (Using data from the Current Population Survey Food Security Supplement, U.S. Census Bureau) https://www.ers.usda.gov/topics/food-nutrition-assistance/food-security-in-the-u-s/key-statistics-graphics/
Source: United Health Foundation, America's Health Rankings, 2021 Health of Women and Children Report www.americashealthrankings.org/explore/health-of-women-and-children/measure/food_insecurity_household/state/AZ
Source: United Health Foundation, America's Health Rankings, 2021 Health of Women and Children Report https://www.americashealthrankings.org/explore/health-of-women-and-children/measure/food_insecurity_household/state/AZ
Source: Maricopa County 2019 CCHNA: Community Health Status Report (October 2020) www.maricopa.gov/DocumentCenter/View/66054/2019-Community-Health-Status-Report
Source: Maricopa County 2019 CCHNA: Community Health Status Report (October 2020) www.maricopa.gov/DocumentCenter/View/66054/2019-Community-Health-Status-Report
WITH SCHOOL-AGE CHILDREN
15.1%
39.1% 40.8% WHITE HISPANIC/LATINX BLACK
* PERCENTAGES BASED ON A 30-DAY PERIOD, SEPTEMBER 2020
Source: Urban Institute, "Forty Percent of Black and Hispanic Parents of School-Age Children Are Food Insecure," Poonam Gupta, Dulce Gonzalez and Elaine Waxman (December 2020) www.urban.org/research/publication/forty-percent-black-and-hispanic-parents-school-age-children-are-food-insecure
* Percentages based on a 30-day period, September 2020
Source: Source: Urban Institute, "Forty Percent of Black and Hispanic Parents of School-Age Children Are Food Insecure," by Poona Gupta, Dulce Gonzalez and Elaine Waxman (December 2020) www.urban.org/sites/default/files/publication/103335/forty_percent_of_black_and_hispanic_parents_of_school_age_children_are_food_insecure_0.pdf
Source: United States Department of Agriculture, Household Food Security in the United States in 2019 (September 2020) www.ers.usda.gov/webdocs/publications/99282/err-275.pdf?v=6168.9
Source: United States Department of Agriculture, Household Food Security in the United States in 2019 (September 2020) https://www.ers.usda.gov/webdocs/publications/99282/err-275.pdf?v=6168.9


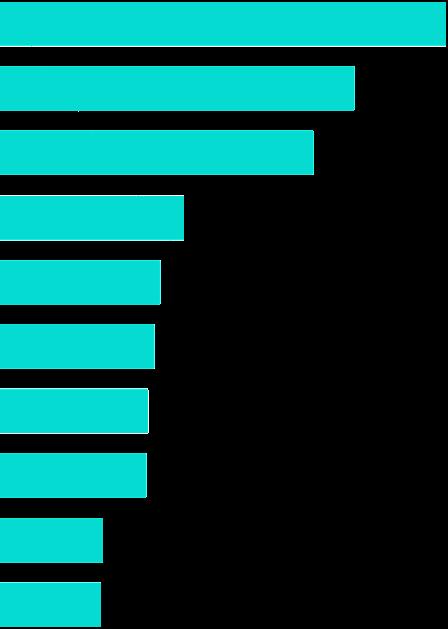


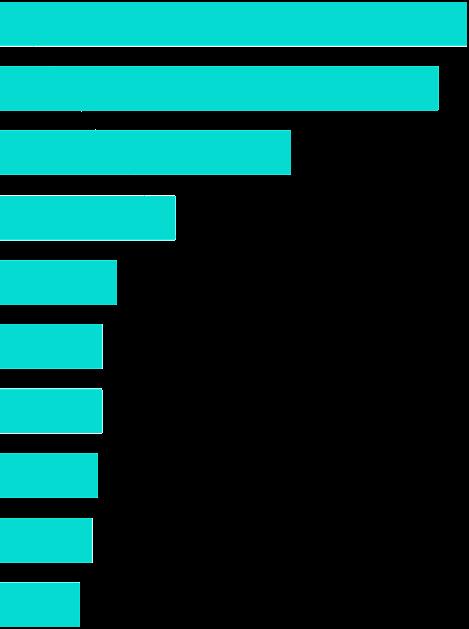

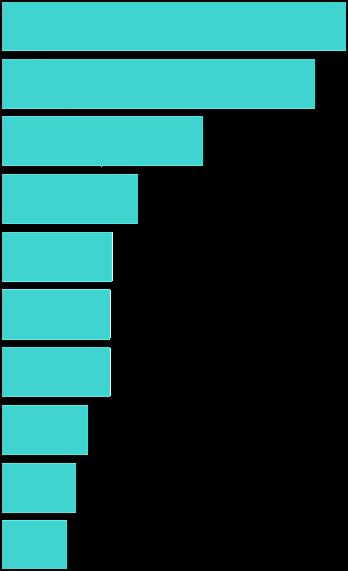


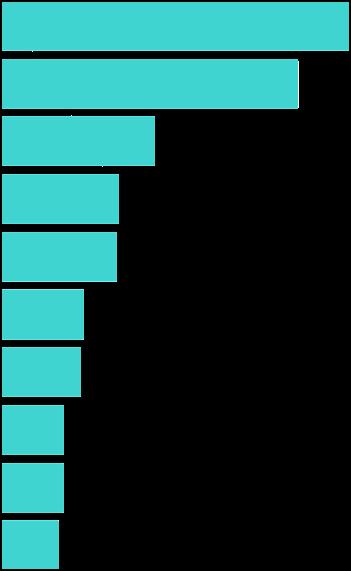 BY MARIA VALENZUELA
Esperança is a global health organization founded in Phoenix in 1970. Their vision—health equity for everyone—touches 50,000 families each year in Arizona and six countries—Bolivia, Ecuador, Nicaragua, Mexico, Mozambique and Peru.

At Esperança, we believe in a world where every person can thrive, have new possibilities and a promising future. In the communities we serve, that world often can feel unreachable. When children grow up in unsafe environments, when the healthcare infrastructure simply doesn’t exist in their community, and when a good education is an unattainable luxury, it is incredibly difficult for families to focus on anything other than simple survival.
We believe that, no matter what, the community comes first. It is not our place to tell people what they need; our job is to listen. That’s why we provide a wide range of services that respond to the unique needs of each community we serve.
Until the year 2000, Esperança’s focus had been international, supporting health programs for countries around the world, but a growing prevalence of health disparities influenced the organization’s leadership to focus inward and address the needs of families in Phoenix, where the organization has its headquarters. Funding was secured to assess and serve the health needs of Latino families in the Fowler School District in West Phoenix. I was hired as the one community health worker that would pilot the program. As a Mexican immigrant raised in South Phoenix, I have experienced firsthand the inequities faced by minorities navigating Arizona’s healthcare system, so I was excited to have the opportunity to change that for future generations.
Hispanic seniors suffer disproportionately from diabetes (47% prevalence) and obesity (25% prevalence), which is a risk factor for diabetes. Almost half (47%) of Hispanic women 65–74 years old are obese compared to 38% of non-Hispanic women. In Arizona, more half (52%) of kindergarten children have a history of tooth decay, most of whom come from minority communities. Needless to say, there was much work to be done.
Fast forward 22 years and Esperança has grown to a team of eight Arizona-focused staff members working collaboratively with school districts, health centers and affordable housing facilities to remove barriers and provide direct services. We are on track to serve more than 10,000 Arizona families in 2022 through four main programs:
1. Su Salud con Sabor Latino: This 12-session, evidencebased curriculum published by Esperança, aims to empower Latino adults to improve health outcomes by changing behaviors and improving knowledge about nutrition and physical activity. Workshop topics include understanding food labels, hands-on food preparation, increasing water consumption, portion size, mindful eating, chronic diseases, mental health, oral health and physical activity.
2. Diabetes Education and Empowerment Program (DEEP): DEEP™ is an eight-week evidence-based diabetes self-management program that was developed Esperança
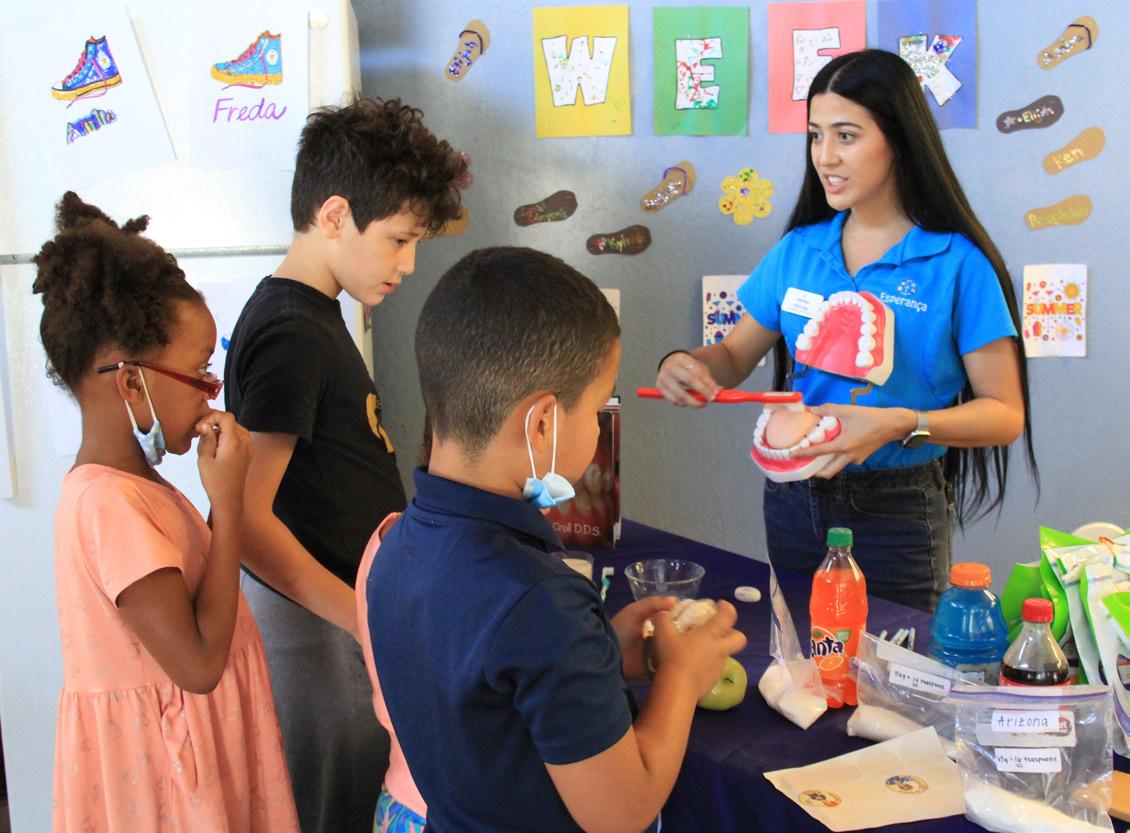
to empower Latinos to make informed decisions if they are diagnosed with pre-diabetes and/or to manage their existing diabetes. Curriculum topics include, but are not limited to, mindful eating, medication adherence, blood sugar monitoring, oral health, stress and depression, cardiovascular considerations, blood pressure, sodium intake and physical activity.
3. Oral Health Education: These one-time workshops for all ages educate attendees about the importance of proper daily hygiene practices and the need for routine dental visits. Esperança provides each participant with a Smile Bag that contains an age-appropriate toothbrush, toothpaste and dental floss as well as referrals to dental providers who offer low-cost or free dental care.
4. Stove to Table: Fruits and vegetables grown in Esperança’s own community garden are transformed into 200 healthy meals every week, and delivered to the doors of some of Arizona’s most under-resourced seniors. This program was developed when we discovered that low-income seniors were suffering from food insecurity resulting from pandemic-fed apprehension to leave their homes to shop and little money to purchase healthy foods. While access to food boxes was abundant, they struggled to cook their own meals due to problems such as arthritis, poor vision and just general poor health.
These programs combat the root source of chronic illness that too often plagues communities of color. They also fill a gap in the current healthcare system: culturally appropriate preventative health programs taught in Spanish by community health workers (CHWs) from the communities they serve.
Graduates from Esperança programs show important results: Many have a decrease in A1C levels, body weight and visceral fat, and an increase in water intake, weekly exercise and nutrition knowledge. Quite simply, they improve their daily lives and increase their life expectancy.
One of the primary reasons these programs have seen tremendous success in recent years is thanks to the individuals who deliver
the curriculum. Esperança’s CHWs relate to community members because many of them come from the communities they serve. They know from personal experience what it is like to have a loved one live with diabetes. Many grew up in monolingual Spanish households, so they speak the language and understand the culture.
Arizona is a rich tapestry made up of people from many different backgrounds and cultures, which is why a one-size-fits-all model to improve health outcomes cannot succeed. Esperança has been successful because it customizes its approach to each community’s unique needs to improve the health for all families in the community.
Maria Valenzuela joined Esperança in 2000. In her current role as the seniorprogramdirector,sheoverseesteamsimplementingcommunityled health programming in the U.S. and six countries. Valenzuela is also a key member of several community advisory boards: ASU College of Health Solutions, Mayo Clinic and the Health Improvement Partnership of Maricopa County. Valenzuela has done presentations about her progressive approach to preventative health programming for the United States Congress and at two World Health Organization (WHO) globalforums. Shewas chosenfortheAspen Institute’s Healthy Communities Fellowship in 2019. In 2022, she graduated from Valle del Sol's Hispanic Leadership Institute and received the Rosa Carrillo Torres Humanitarian Award.
ESPERANÇA
1911 West Earll Dr. Phoenix, AZ 85015 602.252.7772
Info@Esperanca.org esperanca.org
HOURS
8:30am–4:30pm,
Caring, giving and making things better. It all starts by working together. Join us in celebrating the power of community.

• GLOBAL WARMING IS A TOP PERSONAL CONCERN – HISPANICS VS. NON-HISPANICS
• PERCENT OF LATINOS WHO SAY GLOBAL CLIMATE CHANGE AFFECTS THEIR LOCAL COMMUNITY
• ENVIRONMENTAL PROBLEMS ARE A BIGGER CONCERN IN HISPANIC COMMUNITIES
• HISPANICS AND LATINOS ARE MORE CONCERNED ABOUT GLOBAL WARMING
• HISPANICS/LATINOS AND BLACKS ARE MORE WILLING THAN WHITES TO LOBBY ELECTED OFFICIALS TO ADDRESS GLOBAL WARMING
• SEVENTY-EIGHT PERCENT OF LATINOS SUPPORT STATE CLEAN ENERGY STANDARDS TO PREVENT GLOBAL WARMING AND CLIMATE CHANGE
• EIGHTY-SIX PERCENT OF LATINOS SUPPORT INCREASED CONSERVATION OF WATER
• TOP 10 STATES BY LATINO POPULATION LIVING IN COUNTIES ABOVE EPA'S LEVEL OF CONCERN FOR CANCER RISK
• CHINA AND THE UNITED STATES EMIT THE MOST CARBON DIOXIDE
THE BRA RECYCLERS WORK TO HELP FAMILIES IN NEED
BY GRACIELA MARTINEZA husband-and-wife team started this recycling company to be part of the solution, not the problem
PROTECTING LATINO FAMILIES FROM THE ENVIRONMENT
BY CAROLINA PEÑA-ALARCÓNEcoMadres is addressing the negative effects of climate change and air pollution in their local communities
HEAT ACTION PLANNING GUIDE
Nature’s Cooling System Project is tackling the problem of urban heat—and is helping three Phoenix area neighborhoods create their own Heat Action Plans
Hispanics and Latinos have high participation in weatherexposed industries, such as construction and agriculture, which are especially vulnerable to the effects of extreme temperatures. With 2°C (3.6°F) of global warming, Hispanic and Latino individuals are 43% more likely to currently live in areas with the highest projected reductions in labor hours due to extreme temperatures. With regard to transportation, Hispanic and Latino individuals are about 50% more likely to currently live in areas with the highest estimated increases in traffic delays due to increases in coastal flooding.
BY PERCENTAGE
ALL LATINOS
U.S. BORN
22% 26%
FOREIGN BORN
FOREIGN BORN LIVING IN THE U.S. ≤ 21 YEARS
FOREIGN BORN LIVING IN THE U.S. ≥ 21 YEARS
Source: Pew Research Center, "Most U.S. Latinos say global climate change and other environmental issues impact their local communities," Lauren Mora and Mark Hugo Lopez, October 4, 2021 www.pewresearch.org/fact-tank/2021/10/04/most-u-s-latinos-say-global-climate-change-and-other-environmental-issues-impact-their-local-communities/
30%
36%
25%
Source: Pew Research Center, "Most U.S. Latinos say global climate change and other environmental issues impact their local communities," by Lauren Mora and Mark Hugo Lopez, October 4, 2021 https://www.pewresearch.org/fact-tank/2021/10/04/most-u-s-latinos-say-global-climate-change-and-other-environmental-issues-impact-their-local-communities/
LACK OF PARKS AND GREENSPACE
SAFETY OF DRINKING WATER
AIR POLLUTION
PO L LUTION OF LAKES, R IVE R S AND STREAMS
T OO M UCH GARBAGE, WASTE AND LANDFILLS
36% 38%
49% 57% 60%
53% 56% 70% 71% 72%
Source: Pew Research Center, "Most U.S. Latinos say global climate change and other environmental issues impact their local communities," Lauren Mora and Mark Hugo Lopez, October 4, 2021 www.pewresearch.org/fact-tank/2021/10/04/most-u-s-latinos-say-global-climate-change-and-other-environmental-issues-impact-their-local-communities/
Source: Pew Research Center, "Most U.S. Latinos say global climate change and other environmental issues impact their local communities," by Lauren Mora and Mark Hugo Lopez, October 4, 2021 https://www.pewresearch.org/fact-tank/2021/10/04/most-u-s-latinos-say-global-climate-change-and-other-environmental-issues-impact-their-local-communities/


METHODOLOGY: THE SURVEY INCLUDED A NATIONAL SAMPLE AND 1,200 COMPLETE INTERVIEWS BY LANDLINE, CELL AND ONLINE WITH LATINO REGISTERED VOTERS IN ENGLISH AND SPANISH AT RESPONDENT’S DISCRETION. THE SURVEY WAS PERFORMED IN JUNE AND JULY OF 2015. THESE RESULTS ARE FOR THE NATIONAL WEIGHTED SAMPLE, WITH A NOMINAL MARGIN OF ERROR OF +/- 2.8%


METHODOLOGY: THE SURVEY INCLUDED A NATIONAL SAMPLE AND 1,200 COMPLETE INTERVIEWS BY LANDLINE, CELL AND ONLINE WITH LATINO REGISTERED VOTERS IN ENGLISH AND SPANISH AT RESPONDENT’S DISCRETION. THE SURVEY WAS PERFORMED IN JUNE AND JULY OF 2015. THESE RESULTS ARE FOR THE NATIONAL WEIGHTED SAMPLE, WITH A NOMINAL MARGIN OF ERROR OF +/- 2.8%
 BY GRACIELA MARTINEZ
Underwear is one of the most requested, yet least donated, items for families in need. To address this issue, Elaine Birks-Mitchell and her husband Johnny Mitchell Jr. founded The Bra Recyclers in 2008 to provide families in need with underwear while encouraging environmentally friendly and sustainable practices. Birks-Mitchell, who is the company’s CEO, developed a creative solution with the help of the community and through partnerships with several organizations.
Birks-Mitchell’s upbringing inspired her to give back to the community: “It was ingrained in me,” she says.
She spent 25 years as an information technology professional before deciding to pursue her passion to make essential items accessible to communities in need. Her social and environmental efforts have not gone unrecognized: She was awarded the JP Morgan Elevate Together grant this year. Elevate Together is a “nonprofit initiative designed to accelerate the creation, growth and prosperity of Black and Hispanic small businesses.” The ODP Corp., the parent company of Office Depot, is the founding partner of Elevate Together. JPMorgan Chase is the newest corporate contributor to this initiative.
One of the biggest challenges Birks-Mitchell faced when she started The Bra Recyclers was understanding the textile and recycling industry. A total of 95% of worn or torn textiles can be recycled—but there is a cost.
“Doing good costs money,” Birks-Mitchell says.
With this realization, the couple developed a social enterprise model for their business that helped them succeed. Elaine hopes
Consumers who throw away their used clothing are considered the main offenders [for textile waste]. Only 15% of post-consumer clothing is recycled, while textile and clothing manufacturers recycle more than 75% of clothing.
—U.S. ENVIRONMENTAL PROTECTION AGENCY ON THE GENERATION AND DISPOSITION OF MUNICIPAL SOLID WASTE (MSW) 2018 REPORT
her transparency about her business model will shift the mindsets of individuals and corporations who refuse to work with for-profit businesses.
The Bra Recyclers’ approach to their business is simple:
1. Negotiate with businesses to purchase overstock and returns or to start a recycling program.
2. Donate to 120+ organizations and programs (more than 33 are local Arizona shelters and programs). More than 4 million bras have been donated to 120 nonprofits throughout the world.
3. Sell leftover items to textile recyclers or clothing exporters around the world.
Individuals can send their donations by mail to The Bra Recyclers or drop off their donations at one of the more than 250
Donations are important, but the labor that goes into sorting the undergarments is just as important. Donations are graded by quality and only lightly used and new items are kept. The Bra Recyclers has partnered with two local nonprofits (Gompers and Epi-Hab) that help individuals with
disabilities find meaningful employment. In this way, the company also is helping to create new job opportunities in Arizona.
The Bra Recyclers also has created a program for companies that will help them be more sustainable and also engage their customers.
MORE INFO
THE BRA RECYCLERS 480.988.2283 Ambassadors@BraRecycling.com www.brarecycling.com
MAILING ADDRESS 4904 S. Power Rd., Ste 103-441 Mesa, AZ 85212
FIND A DROP-OFF LOCATION soma.com/locations
ELEVATE TOGETHER info@elevatetogether.org elevatetogether.org
GOMPERS PHOENIX 6601 N 27th Avenue Phoenix, AZ 85017 602.336.0061 gompers.org
NOTE: There also are locations in Glendale and Peoria, AZ.
EPI-HAB PHOENIX, INC. 2125 W. Fillmore St Phoenix, AZ 8500 602.254.7027 learnmore@epihab.org epihab.org
EPI-HAB was started in 1958 by business and medical professionals who volunteered their time and efforts to form a company “to provide employment opportunities for individuals with epilepsy.”
Through the Ambassadors Program, companies can:
• Donate overstock/return items;
• Collect preloved bras and new underwear by offering customers a discount on their next purchase when they donate items;
• Promote The Bra Recyclers to customers and followers; and
• Specify an item to donate and donate one item for every item purchased.
Individuals in the community can also participate by hosting bra recycling drives. In return, ambassadors receive scorecards that highlight the environmental impact of donating bras and underwear.
The couple is launching a nonprofit organization in October 2022 that will be an extension of The Bra Recyclers.
“Through our philanthropic arm, The Undie Chest, we will extend our support to men and boys, meaning we can provide underwear for the entire family, ” Birks-Mitchell says. “My vision was to make a living from giving. I wanted to provide for families in need all around the world while also protecting our planet.”
We provide science-based, culturally relevant bilingual resources, build community through events and cafecitos, and work with Latinos to demand laws, policies and programs that protect our children’s health. Our vibrant team is composed of state-based EcoMadres organizers across the country located in Arizona, Colorado, Florida, Iowa, Nevada, New Mexico and Texas. Moms Clean Air Force has state chapters in 29 states plus Washington, D.C.
EcoMadres is a national community of parents and caregivers working together to protect Latino families from climate change and air pollution, which disproportionately affects the health and well-being of Latinos in the United States. EcoMadres is a program affiliate of Moms Clean Air Force, a community of more than 1 million moms and dads united against air pollution—including the urgent crisis of our rapidly changing climate—to protect our children’s health and future generations.
Climate change, including severe wildfires, plus a longer allergy season and the negative effect on mental health, are just a few of the environmental consequences families and communities experience today. In Arizona, extreme heat fueled by climate change is especially dangerous, and Latino and Hispanic communities are among the most vulnerable to heat-related illness because of where they live and work. Nationally, Hispanics
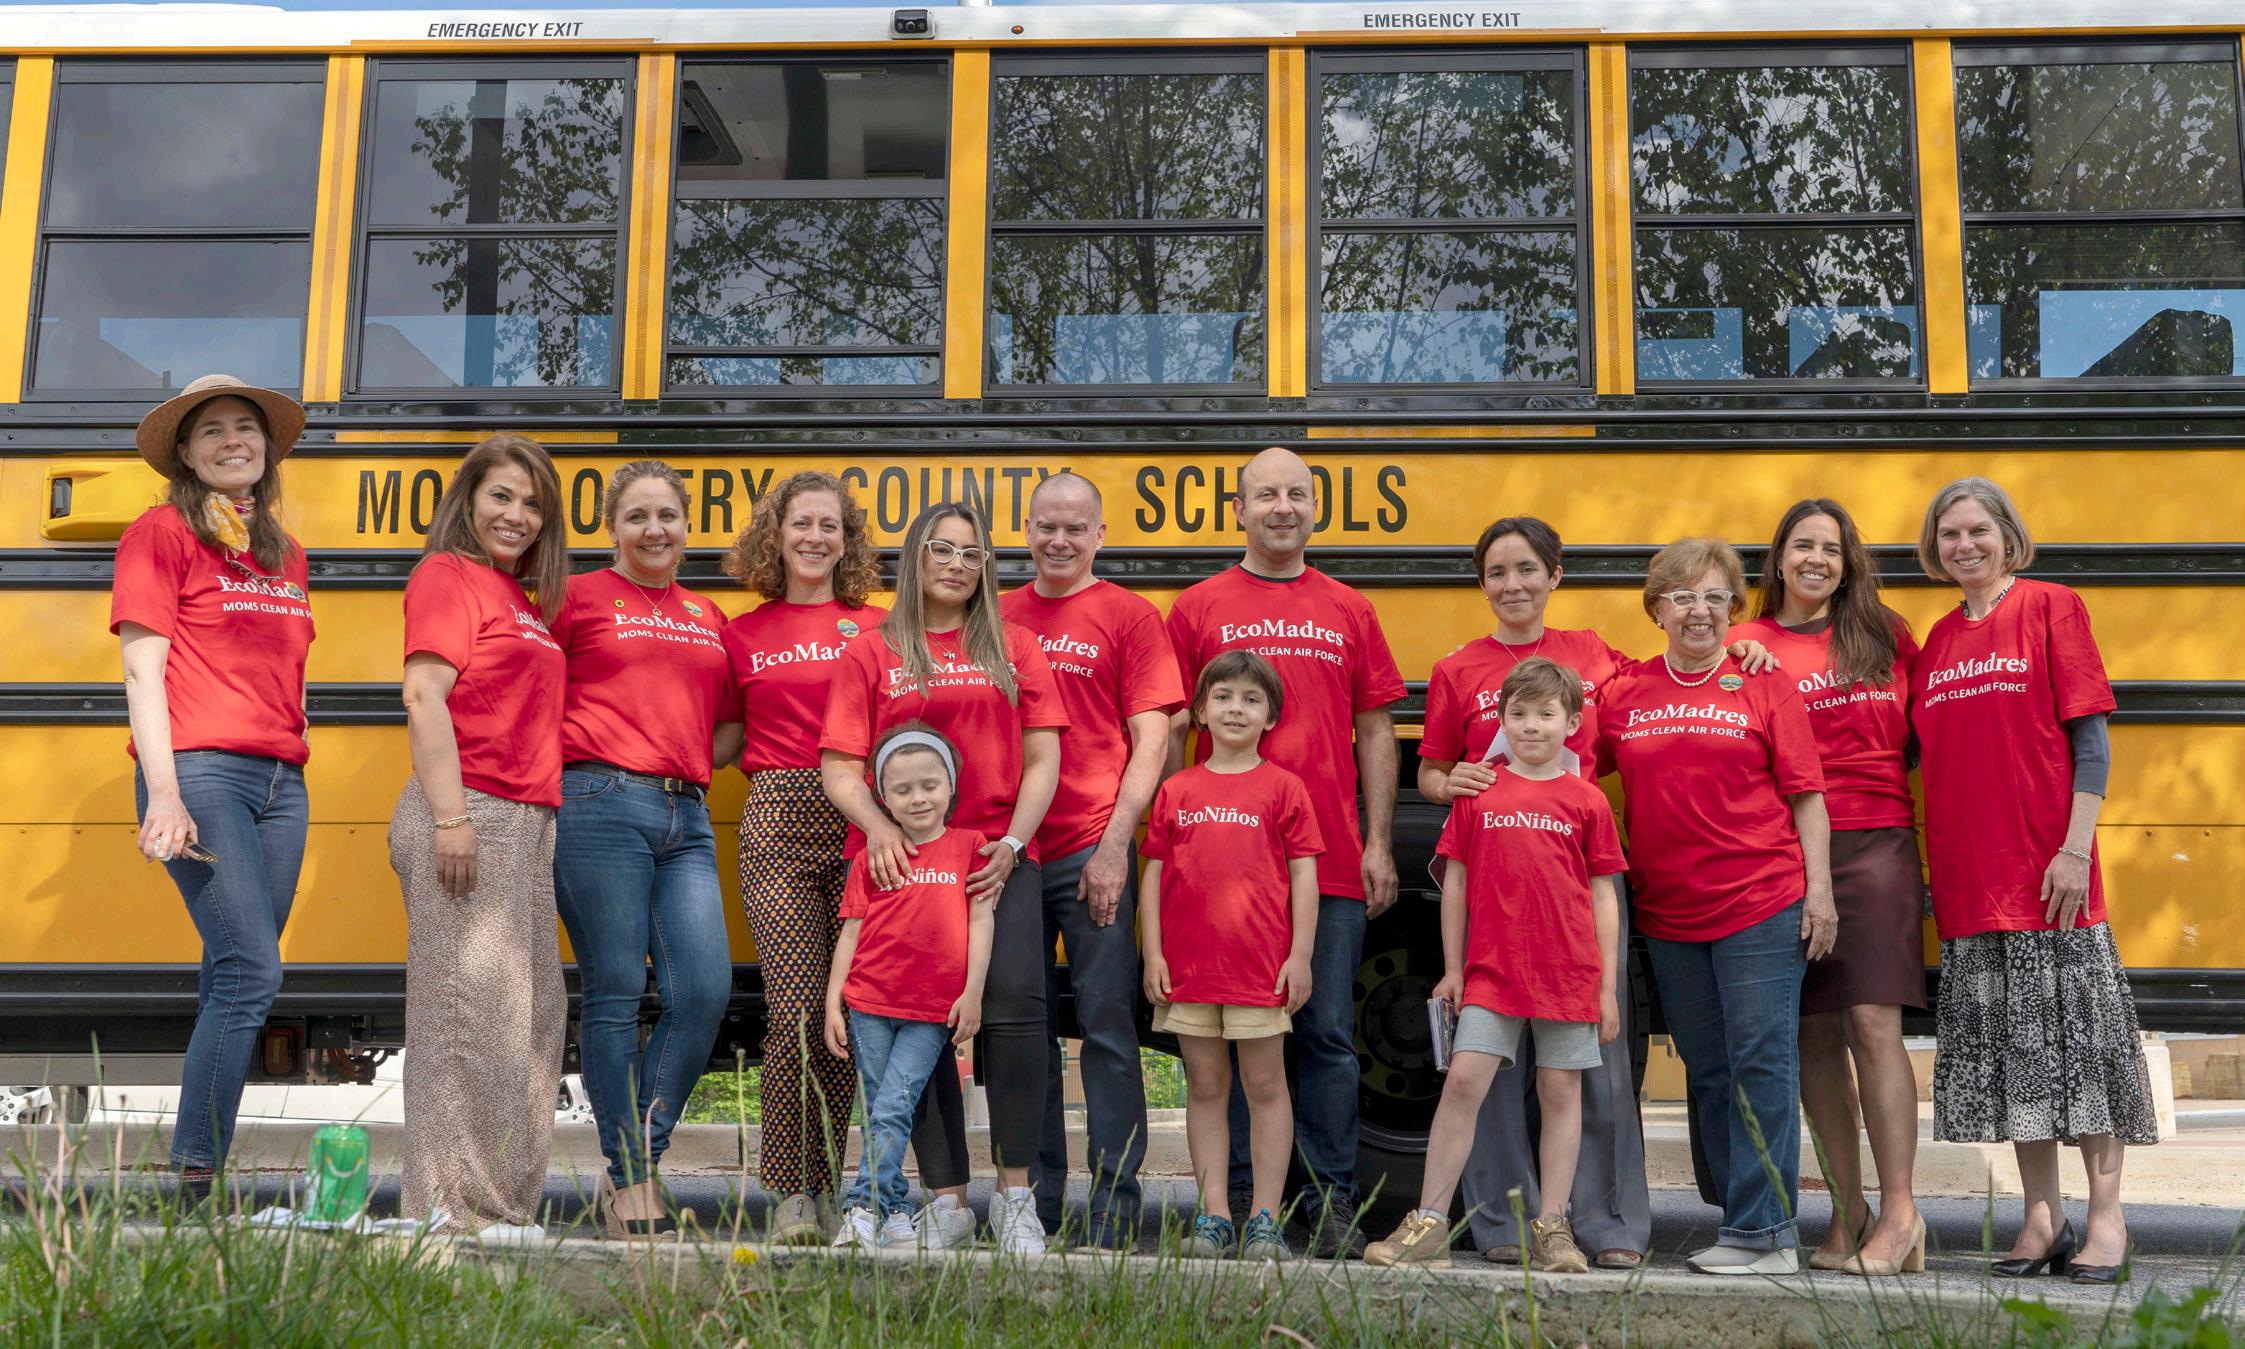
are 21% more likely than the non-Hispanic white population to live in urban heat islands, which can be up to 22°F hotter than the surrounding areas. Members of these communities also make up a large portion of the outdoor workforce, with an estimated 80% of farm workers self-identifying as Hispanic/Latino.
Latino communities are also three times more likely to be negatively affected by air pollution, and Latino children are at 60% higher risk of having asthma attacks exacerbated by air pollution compared to their white counterparts. These health issues are compounded by the fact that Hispanics also are more likely to lack health insurance than members of other racial groups. In 2019, 16.7% of Hispanics were uninsured, compared to only 5.2% of non-Hispanic whites. Without health insurance coverage, Hispanic communities have less access to the care they need to treat and prevent asthma attacks and heat-related illnesses.
Columba Sainz, our Arizona-based state coordinator, joined EcoMadres and Moms Clean Air Force because she was concerned about the air pollution in her community and how it was affecting her children. One of her daughters started wheezing after the family moved to South Phoenix, an area with poor air quality. She quickly learned that air pollution could be the cause of her daughter’s wheezing.
Both of her children ended up needing inhalers and one was prescribed asthma medication. She later learned that Maricopa County had an “F” grade for dangerous air quality from the American Lung Association. Unfortunately, her family’s experience is not unique. She is just one of the more than 40% of Americans who live in areas where the air is unsafe to breathe.
Going to the playground, working outside or simply taking a breath of air shouldn’t be dangerous. Everyone has the right to breathe
clean air, which is why EcoMadres advocates for health-protective policies that will clean up the air for everyone.
In August, the Biden administration celebrated the passage of the Inflation Reduction Act (IRA), a historic investment in clean air and climate security. The IRA has dedicated $369 billion to tackle the current climate crisis and reduce air pollution. We are especially excited about the investments in electric-powered, zero-tailpipe pollution vehicles like electric cars and electric school buses. Exhaust from diesel-powered school buses can trigger asthma attacks, harm developing brains and cause cancer. Electric-powered vehicles do not expose community members to this type of dangerous pollution.
The IRA will also help alleviate the threat that climate change poses to Arizona’s economy. According to recent data from Climate Central, an independent group of scientists and communicators who research and report the facts about the changing climate and how it affects people’s lives, both Phoenix and Tucson are in the top 10 fastest-warming cities and Arizona is currently the fifth-fastest warming state. Heat wave days are expected to more than triple by 2050, leading to lost crop yields and lost earnings. According to the research article, “Estimating Economic Damage from Climate Change in the United States,” which appeared in the June 30, 2017, issue of Science, the impacts of climate change would cost Arizona more than $17.4 billion annually by 2100 if climate pollution were to continue to rise unchecked. We’re grateful that the historic investments in this package are pointing us in a different direction.
The IRA sets the U.S. on the path toward a healthier and safer future, but it is just a starting point. At press time, 68% of Latinos in the U.S. were still living in areas that do not meet federal air quality standards. Outdoor workers are still up to 35 times more likely to die from heat exposure than the general population. EcoMadres works hard to remind our leaders and lawmakers that there are real people behind these statistics. They are our children, mothers, fathers and friends. We will continue to fight every day for our families’ health until everyone is guaranteed clean air and a livable climate. We invite you to join us.
Carolina Peña-Alarcón is the program manager for EcoMadres. She is dedicated to empowering community members and policymakers to take action to reduce greenhouse gas emissions. Her work with EcoMadres has beenfeaturedonTelemundoDCandElZolRadio,andinHispanicLA.Sheisa native ofBoliviawho currentlylives inAlexandria,VA.
MOMS CLEAN AIR FORCE
C/O ENVIRONMENTAL DEFENSE FUND
257 Park Ave. South New York, NY 10010 momscleanairforce.org
MomsCleanAirForceisanaffiliate ofthe Environmental Defense Fund.
NATIONAL ECOMADRES
momscleanairforce.org/ecomadres
ARIZONA ECOMADRES
momscleanairforce.org/state-chapters/arizona
AMERICAN LUNG ASSOCIATION
1.800.586.4872 (1.800.LUNGUSA) lung.org
CLIMATE CENTRAL
climatecentral.org
Anindependentnonprofitgroupofscientistsandcommunicators whoresearchandreportthefactsaboutthechangingclimateand howitaffectspeople’slives
FROM CLIMATE CENTRAL (APRIL 20, 2022)
Earth Day: U.S. Warming Rankings climatecentral.org/climate-matters/earth-day-warming-rankings
CLIMATE IMPACT LAB
Journal Article
Estimating Economic Damage from Climate Change in the United States
FACT SHEETS
Climate Change and Latinos
momscleanairforce.org/resources/climate-change-and-latinos
EXTREME HEAT AND LATINO COMMUNITIES
momscleanairforce.org/resources/extreme-heat-and-latinocommunities
AIR POLLUTION AND LATINOS
www.momscleanairforce.org/resources/air-pollution-and-latinos/

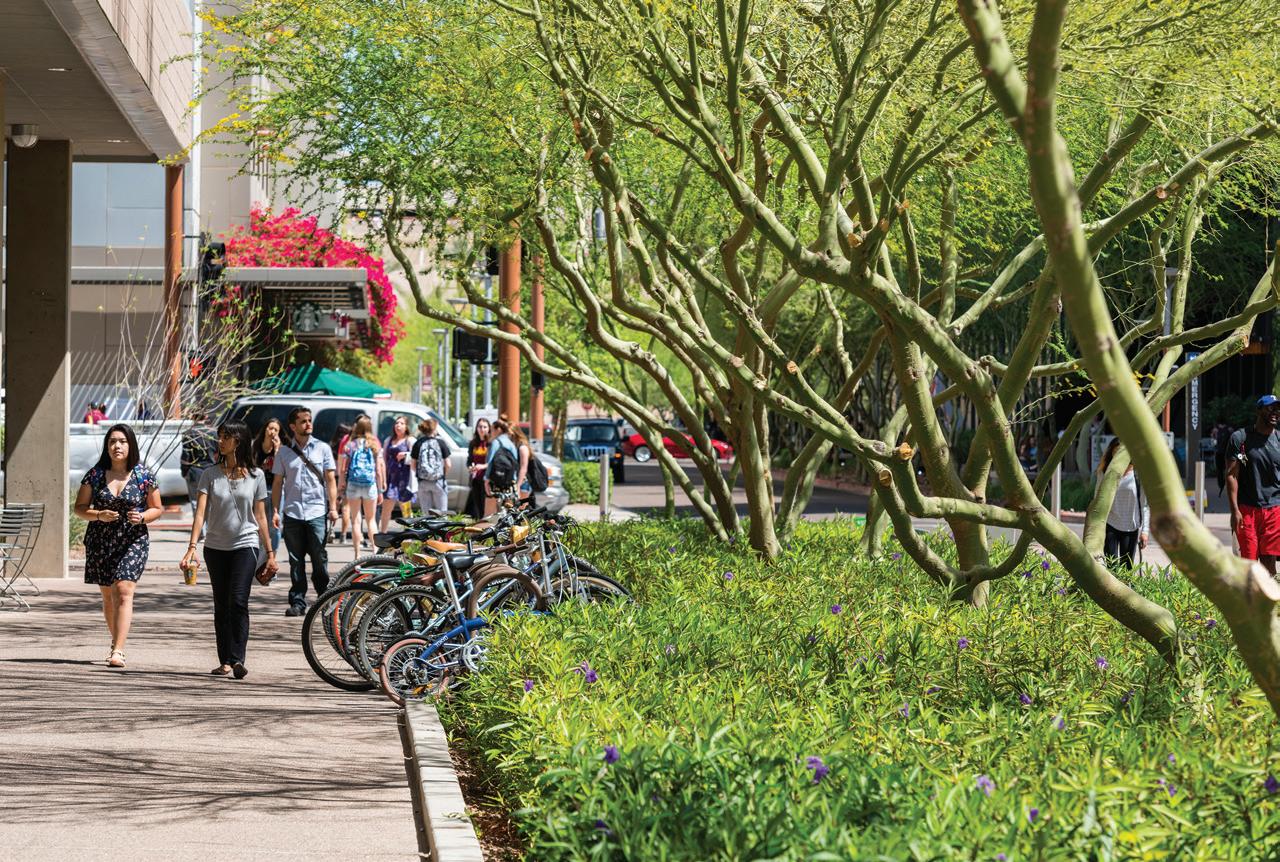
In Greater Phoenix, urban heat is impacting health, safety, and the economy and these impacts are expected to worsen over time. The number of days above 110˚F are projected to more than double by 2060. In May 2017, The Nature Conservancy, Maricopa County Department of Public Health, Central Arizona Conservation Alliance, Urban Resilience to Extremes Sustainability Research Network, Arizona State University’s Urban Climate Research Center, and Center for Whole Communities launched a participatory Heat Action Planning process to identify both mitigation and adaptation strategies to reduce heat directly and improve the ability of residents to deal with heat. Community-based organizations with existing relationships in three neighborhoods selected for Heat Action Planning later joined the project team: Phoenix Revitalization Corporation, RAILMesa, and Puente Movement. Beyond building a community Heat Action Plan and completing demonstration projects, this participatory process was designed to develop awareness, agency, and social cohesion in underrepresented communities. Furthermore, the
Heat Action Planning process was designed to serve as a model for future heat resilience efforts and create a local, contextual, and culturally appropriate vision of a safer, healthier future. The iterative planning and engagement method used by the project team strengthened relationships within and between neighborhoods, community-based organizations, decision-makers, and the core team, and it combined storytelling wisdom and scientific evidence to better understand current and future challenges residents face during extreme heat events.
As a result of three workshops within each community, the residents brought forth ideas that they want to see implemented to increase their thermal comfort and safety during extreme heat days. As depicted below, residents’ ideas intersected around similar concepts, but specific solutions varied across neighborhoods. For example, all neighborhoods would like to add shade to their pedestrian corridors but preferences for the location of shade improvements differed. Some
Heat action in neighborhoods should be supported through strengthened relationships between various levels of organization and governance.
neighborhoods prioritized routes to public transportation, others prioritized routes used by children on their way to school, and others wanted to see shaded rest stops in key places. Four overarching strategic themes emerged across all three neighborhoods: advocate and educate; improve comfort/ability to cope; improve safety; build capacity. These themes signal that there are serious heat safety challenges in residents’ day-to-day lives and that community, business, and decision-making sectors need to address those challenges.
Heat Action Plan elements are designed to be incorporated into other efforts to alleviate heat, to create climate-resilient cities, and to provide public health and safety. Heat Action Plan implementation partners are identified drawing from the Greater Phoenix region, and recommendations are given for supporting the transformation to a cooler city.
To scale this approach, project team members recommend a) continued engagement with and investments into these neighborhoods to implement change signaled by residents as vital, b) repeating the heat action planning process with community leaders in other neighborhoods, and c) working with cities, urban planners, and other stakeholders to institutionalize this process, supporting policies, and the use of proposed metrics for creating cooler communities.
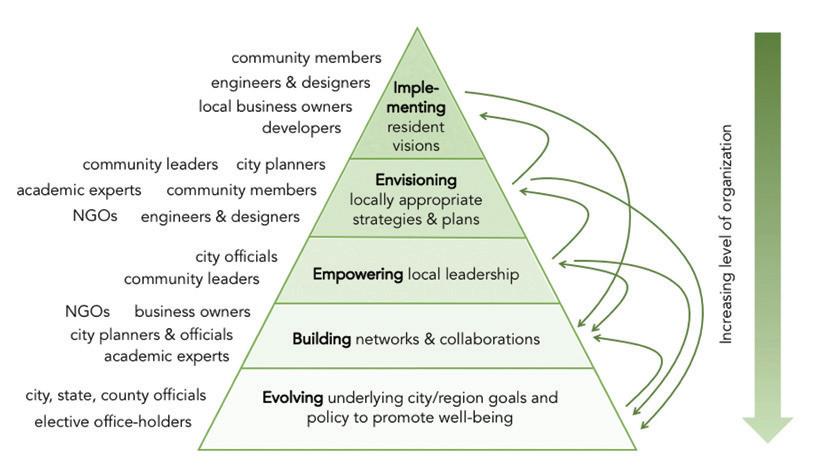
“I ride the bus and sometimes I go to the bus stop and it is really hot. Also, my apartment, it’s also really hot in there….I have to go to bus stations and there is no shade structure. There is nothing. There are no trees along the way…I wish that there were more trees where I live…because there is nothing.”
- Edison-Eastlake Resident
“With conversations with neighbors in South Phoenix, what is very interesting to me is that they say, “Oh it’s hot, that’s normal.” And I think that’s the interesting part of the conversation. It is hot, but it’s not normal. There is something that we can do.”
- Community Organizing Partner
“What makes this project unique is that we’re focused on improving quality of life, we’re not just recording facts about heat and shade, etc., you need people’s experiences to drive the process of change”
- Core Team Partner

• PERCENT OF UNINSURED POPULATION IN ARIZONA 2015–2020
• PERCENT OF UNINSURED POPULATION IN THE UNITED STATES 2015–2020
• PERCENTAGE OF UNINSURED ADULTS JANUARY–JUNE 2021
• SHARE OF TOTAL UNINSURED POPULATION LATINO VS. NON-LATINO 2010–2019
• COVID-19 CASES IN U.S. AS OF APRIL 2022
• COVID-19 DEATHS AS OF APRIL 2022
• HISPANIC ADULTS ARE MORE LIKELY THAN WHITES OR BLACKS TO CHOOSE A COMMUNITY CLINIC FOR HEALTH CARE
• HISPANIC LIFE EXPECTANCY AT BIRTH DECLINED THE MOST 2019–2020
• HISPANIC LIFE EXPECTANCY
MEDICAL AND DENTAL HEALTH
A look at the dental and medical/mental health options for Hispanics in the Phoenix and Tucson markets, courtesy of Univision Communications
TAKING CARE OF THE CHILDREN
BY KATIE KAHLEThe Chandler Children’s Medical & Dental Clinic is making sure that children living in poverty in the Chandler area have access to free dental and medical care
IN
WHOLE PERSON CARE IS THE BEST APPROACH TO COMPLETE HEALTH AND WELL BEING BY SUSAN BOYLES
Adelante Healthcare believes a holistic approach to health care is the best solution to patients’ needs
STATE OF HEALTH
AMONG HISPANICS 2022
This chart pinpoints the leading causes of death for Hispanics and the most common conditions
THE STATE OF MENTAL HEALTH IN AMERICA
Youths of color are much less likely than white youth to receive treatment for depression
COUNTY HEALTH RANKINGS & ROADMAPS – ARIZONA
A look at how Arizona compares to national rankings for health outcomes and health factors
AND ALASKA
Source: United States Census Bureau, Selected Characteristics of Health Insurance Coverage in the United States (March 2022) https://data.census.gov/cedsci/table?t=Health%20Insurance&tid=ACSST1Y2019.S2701&hidePreview=false
Source: United States Census Bureau, Selected Characteristics of Health Insurance Coverage in the United States (March 2022) https://data.census.gov/cedsci/table?t=Health%20Insurance&tid=ACSST1Y2019.S2701&hidePreview=false


Source: KFF, "Health and Health Care Experiences of Hispanic Adults," Samantha Artiga, Liz Hamel, Audrey Kearney, Mellisha Stokes and Alauna Safarpour. (July
Source: KFF, "Health and Health Care Experiences of Hispanic Adults," by Samantha Artiga, Liz Hamel, Audrey Kearney, Mellisha Stokes and Alauna Safarpour. (July 14, 2021) https://www.kff.org/coronavirus-covid-19/poll-finding/health-and-health-care-experiences-of-hispanic-adults/
—AMERICAN MEDICAL ASSOCIATION, COMMENTING ON THE CDC'S FIRST REPORT ON HISPANIC HEALTH
“CONSISTENT WITH PREVIOUS RESEARCH REFERENCES TO THE “HISPANIC PARADOX,” THE CDC REPORT HIGHLIGHTS
LONGER LIFE EXPECTANCY AND LOWER MORTALITY, DESPITE POTENTIAL BARRIERS TO GOOD HEALTH AND WORSE PROFILES FOR SOME SOCIAL DETERMINANTS OF HEALTH AMONG LATINOS.”
PHOENIX HISPANICS & DENTAL OPPORTUNITIES

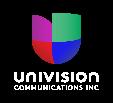
533K

Or 47% of Hispanics in Phoenix Visited
DENTAL SERVICES CONSUMER PROFILE
HISPANICS ARE YOUNG *
60% of Hispanics are between 25-54 years; whereas, 56% of Non-Hispanics are over the age of 50
HISPANICS HAVE MORE CHILDREN **
52% of Hispanic households have children compared to 22% of Non-Hispanics
HISPANICS ARE SPENDING $1.4 BILLION
26K


Or 2% Used an Orthodontist in the Past Year vs. 5% Non-Hispanics
91K Or 8% Received Dental Implants in the Past 3 Years
484K Or 44% Have Dental Insurance
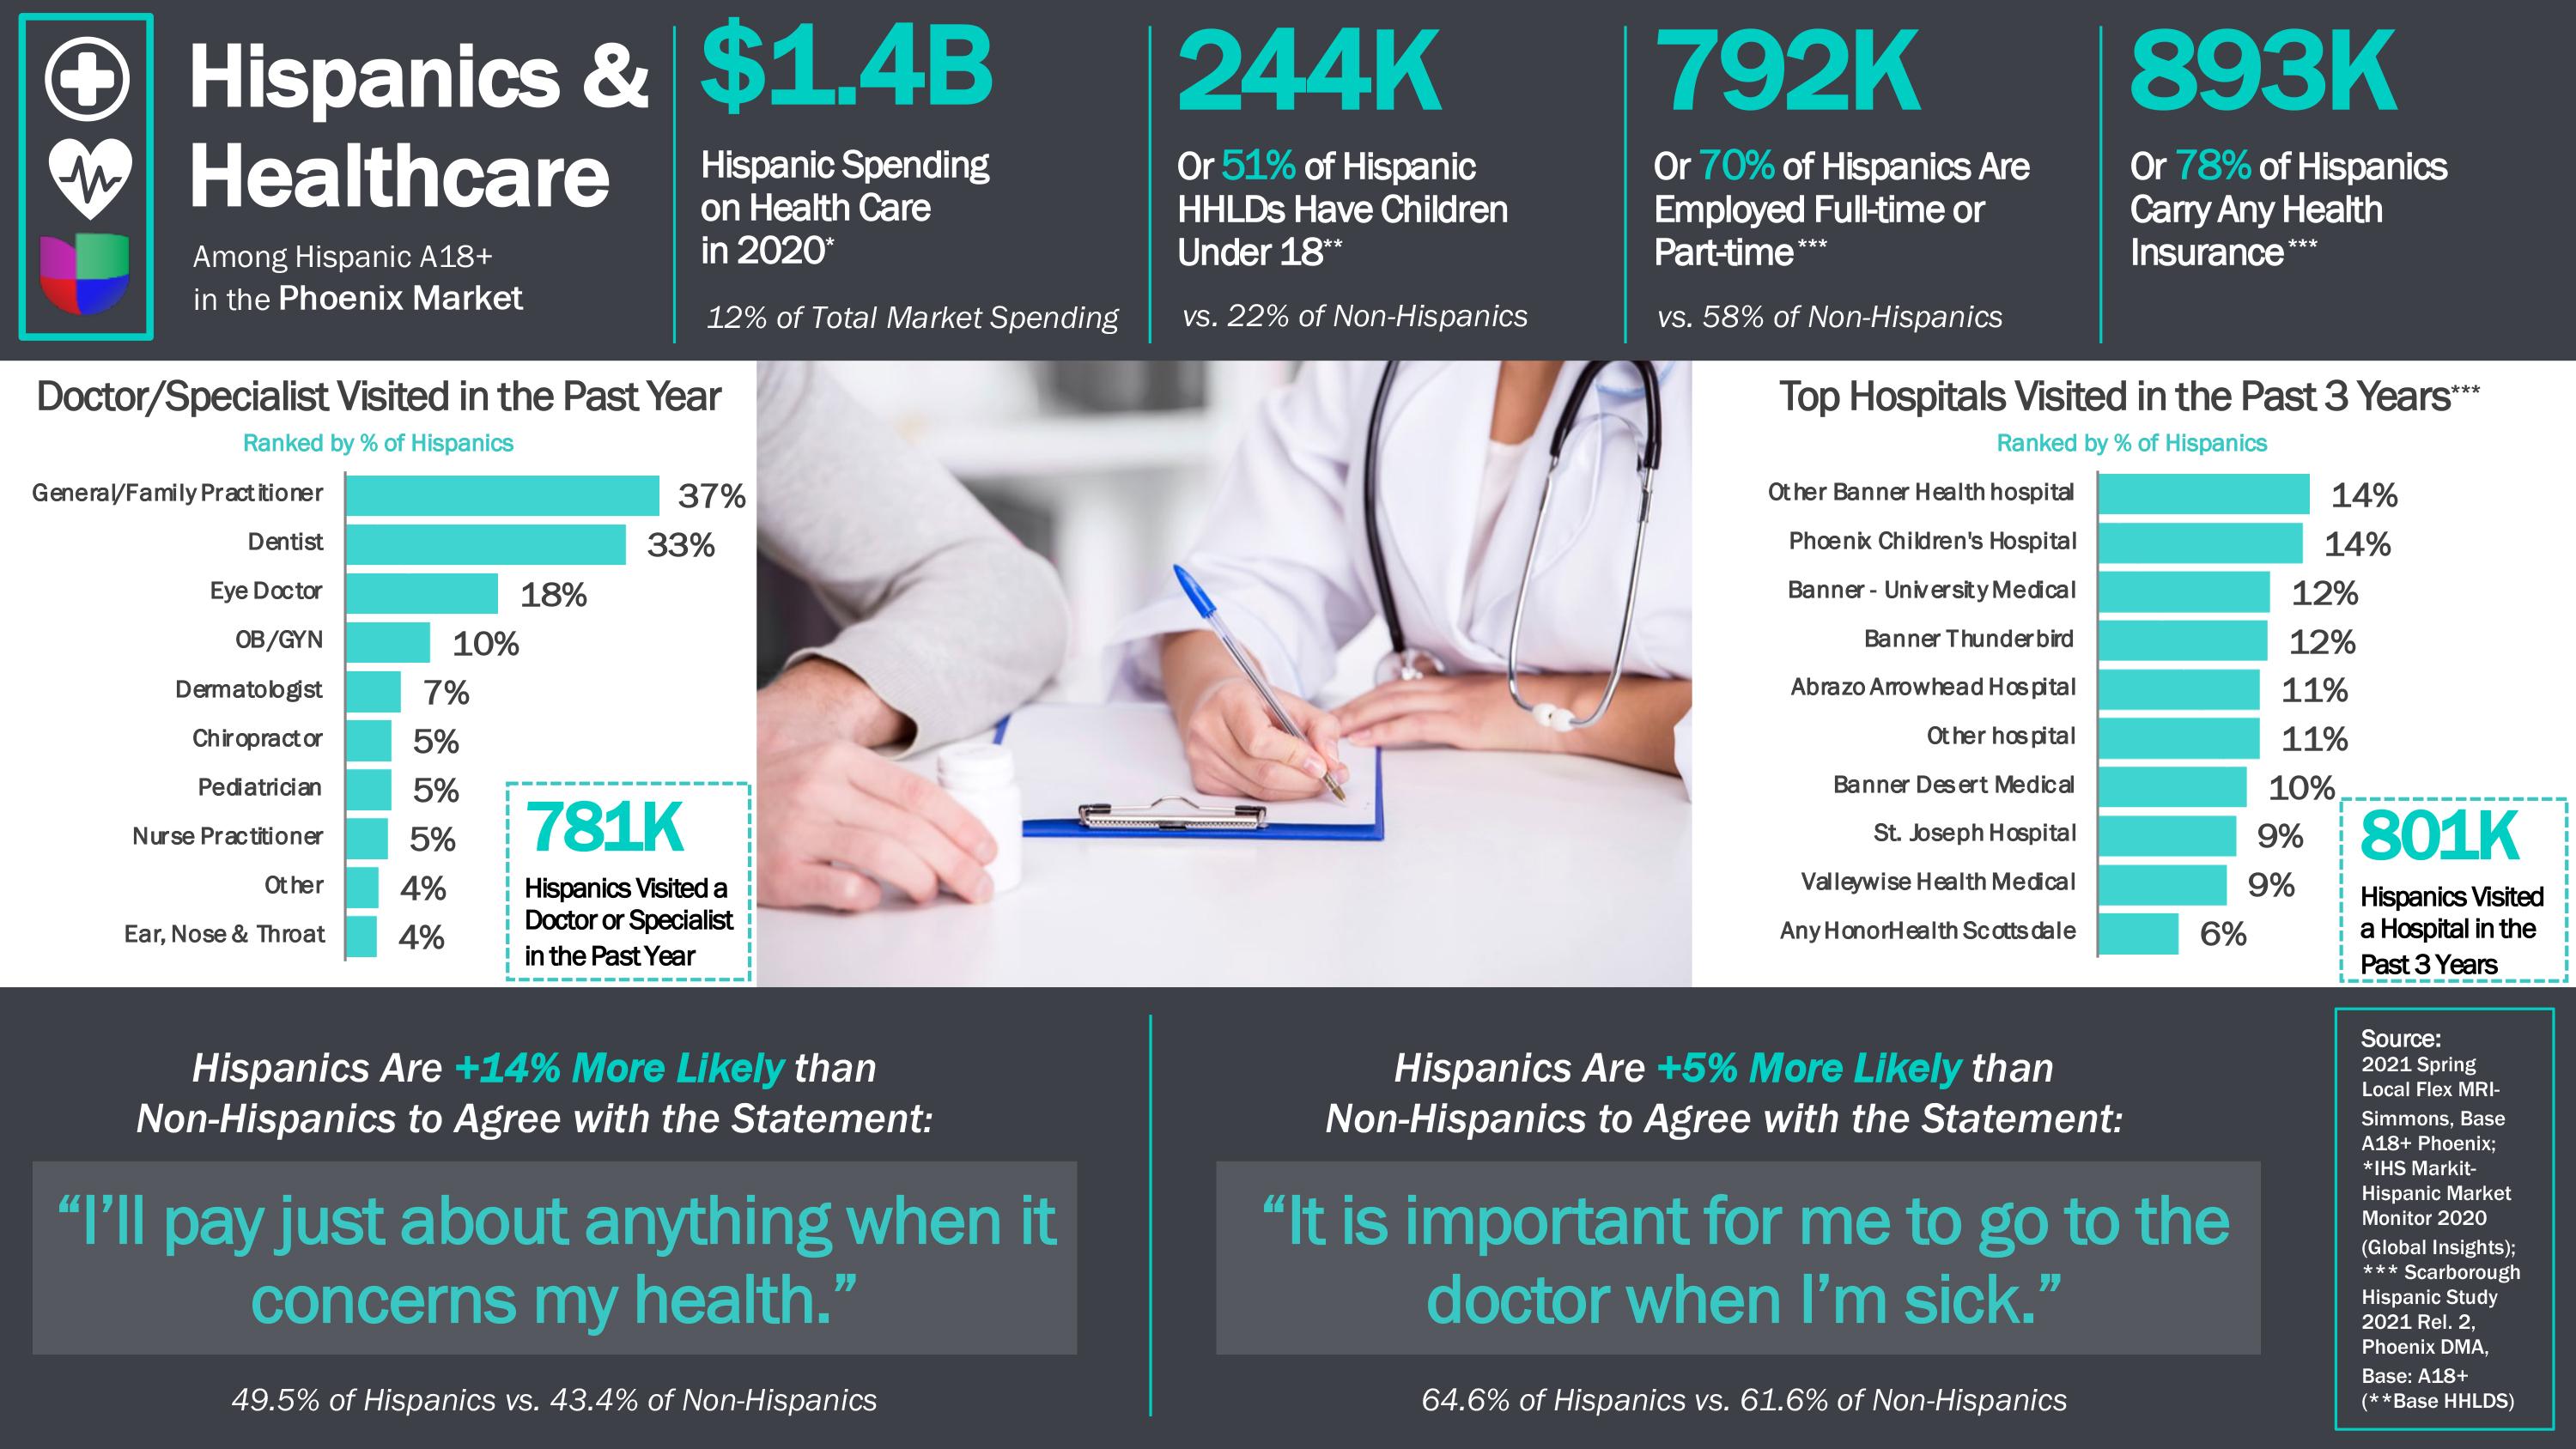
129,600


60,400
+61%
In 1995, the Chandler Unified School District (CUSD) in Arizona opened the San Marcos Resource Center at San Marcos Elementary School to promote students’ school readiness, attendance and academic success by providing medical treatment, social services, parent education programs and referrals.
Over the years, as the community grew, additional resources were added until the center eventually outgrew its space. In 2010, the freestanding Chandler CARE Center opened on the campus of Galveston Elementary, in the heart of downtown Chandler, allowing for expansion and the addition of more services. The keystone features of the center were new medical and dental clinic spaces, which were expanded to serve more children.
In September 2016, the CARE Center Children’s Medical and Dental Clinic was incorporated as its own 501(c)3 nonprofit. During

the past 27 years, the clinic has implemented partnerships and innovations that help us meet our mission to improve health and educational outcomes by providing children free medical and dental care.
All the research points to a clear conclusion: Access to compassionate, comprehensive medical and dental care not only helps create healthier communities, it also reduces chronic absenteeism in schools and helps children thrive. In fact, the long-term benefit of increasing access to care for children spills over into adulthood, creating young adults who realize higher educational attainment and greater economic opportunities.
All of the children who attend Galvestion Elementary qualify for free/reduced-price lunches—which means they are living in poverty and access to quality health care is crucial to their well-being. The clinic is the only Chandler resource that provides children with free acute care, well-child checkups, sports physicals, hearing and vision screening, and vaccinations as well as access to both preventive and restorative dental care.
‘Having to choose between paying for either medical or dental insurance is always a headache, but the CARE Center Dental clinic has been a blessing to me and my children. They have helped me provide high-quality dental care for my children that otherwise I would have not been able to afford.’
—M, MOTHER OF TWO
According to the City of Chandler’s 2019 Community Needs Assessment, 8.9% of Chandler residents live in poverty. Chandler’s population increased 42.9% between 2000 and 2018 and is expected to reach 300,000 by 2023. In that same timeframe, the percentage of the population who live in poverty more than doubled.
The Urban Institute’s Health Policy for Low-Income People in Arizona report says that only 48% of children living in poverty will have a preventive care visit in a 12-month period, versus 70% of kids who do not live in poverty. The national uninsured rate for children in poverty (7.8%) remains higher than for children not in poverty (4.9%) and uninsured rates increase with age, with a rate of 3.2% for birth through 12 months and 8.2% at age 18. More than 32% of children from low-income households have untreated tooth decay and 22% have never seen a dentist. Hispanic children in Arizona are the most disproportionately affected, with 26% with untreated tooth decay. Additionally, more than 25% of Arizona children in kindergarten through third grade have no dental insurance—and 42% will experience untreated tooth decay.
“Lower-income persons tend to be uninsured for longer periods than higher-income persons, which increases their risk of poorer health-related outcomes,” according to The National Center for Biotechnology Information. “The lack of health insurance… converges with other risk factors [low socioeconomic status and minority status] to reduce the likelihood of receiving needed care [IOM, 2001a; Shi, 2001)].
“Although lack of health insurance is only one of several factors that contribute to socioeconomic and ethnic disparities in health," the center emphasizes, “it is an important component and is one of the most amenable to intervention.”
The health of low-income children can often fall through the cracks. A total of 13.2% of Chandler children are uninsured and 21% of households cannot afford private insurance, but make too much money to qualify for help from the Arizona Health Care Cost Containment System (Arizona’s Medicaid agency). This is where the Chandler CARE Center Children’s Medical and Dental Clinic
can help by providing uninsured children who live in Chandler and/ or attend a CUSD school with access to quality, free medical and dental care.
Patients served by the clinic are largely from extremely low-income households, with 16% coming from a female-headed household and 80% identifying as Hispanic. Attending to the healthcare needs of children in our community is a priority because it will help address the health disparities that put low-income, predominately Hispanic households at an educational disadvantage that will have lifelong ramifications that affect their success and selfsufficiency.
The Chandler CARE Center Children’s Medical and Dental Clinic offers a trusted location where families feel safe and respected. Partnerships with respected organizations such as Dignity Health, St. Vincent de Paul, A.T. Still University and NYU Langone University, and the support of qualified and compassionate volunteers has made it possible for us to provide necessary medical and dental care to thousands of children. The clinic's shared space with other necessary services, including behavioral health, a food bank, the Women, Infants and Children (WIC) food assistance program and programming that supports parents of young children, helps ensure that local families will get the medical and dental care they need.
Katie Kahle has served since 2010 as the director ofthe Chandler CARE CenterandthenonprofitChandlerChildren’sMedicalandDentalClinic. Kahle has a MasterofSocialWork degree and is anArizona native.
Adelante Healthcare, Inc. is a federally qualified health center that provides quality, affordable primary and preventive health care in Arizona’s Maricopa County, including services for low-income and medically underserved communities.
Adelante’s roots were planted more than 40 years ago in response to the need for accessible, quality care for migrant workers. At that time, Clínica Adelante visited farms and provided a safe place for those who would have otherwise lived in the shadows with no access to health care. Today, Adelante Healthcare has nine locations in the area, offering primary care, dental and behavioral health care where health care is not easily accessible.
Our passionate, highly skilled team members serve a diverse mix of patients, regardless of a person’s background, status or station in life. Our services cover all ages and health care needs, including
1. BY REMOVING BARRIERS. At Adelante, we have removed language barriers and understand your culture. We have some bilingual staff and use Language Line interpretive services for those staff who do not fluently speak your language. The service is part of your medical health care plan that your primary care provider recommends.
2. BY WORKING WITH YOUR DOCTOR. Because we know it is essential to collaborate with your primary care doctor, the services at Adelante are integrated to offer you the best possible care.
3. BY CONNECTING WITH YOUR FAMILY. You do not have to tackle your mental health issues alone. We can help you talk with your support network about your mental health and appropriate treatment plans.
4. BY GIVING YOU THE FACTS. Stigmas are rooted in misunderstandings and fear. We understand the history and science behind mental illness and work hard to remove the stigma so you can feel comfortable getting the appropriate treatment.
adult and family medicine, pediatrics, women’s health, nutrition services, dental and behavioral health. The populations we serve often face barriers to health, such as a lack of transportation, affordable housing, food insecurity or economic hardships.
We believe in caring for the whole person, including physical health and mental/emotional health, because both are critical to achieve complete health and well-being. Each person who becomes a patient at Adelante Healthcare has a primary care provider, in addition to a whole team of dedicated professionals. We have behavioral health consultants, care coordinators, registered nurses, dieticians and health coaches as part of that care team, working hand in hand with each person’s primary care provider to provide excellent whole-person care.
Our behavioral health consultants and care coordinators can provide psychoeducation, brief interventions and coping skills during visits with a primary care provider. They can also help with referrals to our specialty team if that is what is needed.
As part of our specialty behavioral health services, we have therapists and psychiatric providers who can provide care for anyone who is six years of age or older. Our therapists provide traditional psychotherapy and our psychiatric practitioners provide medication management. Our specialty services also include case managers who can help access any additional resources needed.
Mental health includes a person’s emotional, psychological and social well-being. It affects how we think, feel and act. It also helps determine how we handle stress, relate to others and make choices. Good mental health is essential at every stage of life, from childhood and adolescence through adulthood.
If a person experiences mental health problems, their thinking, mood and behavior could be adversely affected. Many factors can contribute to mental health problems, including:
• Biological characteristics, such as genetic makeup or brain chemistry;
• Life experiences, such as trauma or abuse, or a struggle to adapt to a new culture or circumstance; and
• A family history of mental health problems.
Mental health problems are common in our society today, but help is available and many people recover completely. Unfortunately, though, mental health issues are often stigmatized, which makes some people suffer alone—in silence. In reality, however, a mental illness problem is no different than a physical illness such as diabetes or heart disease.
• Fear of rejection and discrimination can delay the journey to recovery.
• Most mental health conditions are treatable.
• Less than 33% of employees who need treatment get the help they need, according to the National Alliance on Mental Health of Massachusetts (2015).
• Mental health problems are the leading cause of disability across the U.S., according to the National Alliance on Mental Illness.
Negative attitudes toward mental health issues and their treatment can be overcome with support and knowledge. Remember that it is critically important to discuss any mental health issues you are having with your primary doctor. If you get the treatment you need as soon as possible, your daily life will not be disrupted in any way.
According to the National Alliance of Mental Illness, the average delay between the onset of mental health symptoms and treatment is 11 years. It is working hard to change that timeline. The Adelante staff is here to help you get the treatment you need when you need it. Don’t ever hesitate to call.
Susan Boyles currently is the director of behavioral health at Adelante Healthcare, where she oversees Adelante’s Integrated and Specialty Behavioral Health programs. Boyles is a licensed clinical social worker with morethan 20years ofexperience inthefield ofbehavioral health. She has a bachelor’s degree in psychology and a master’s degree in socialworkfromEdinboro(PA)University. Boylesalsohasacertificate in executive leadership and management from the University of Notre Dame, South Bend, IN.
Source: www.hitn.org/state-of-health-among-hispanics-in-the-us-in-2022/
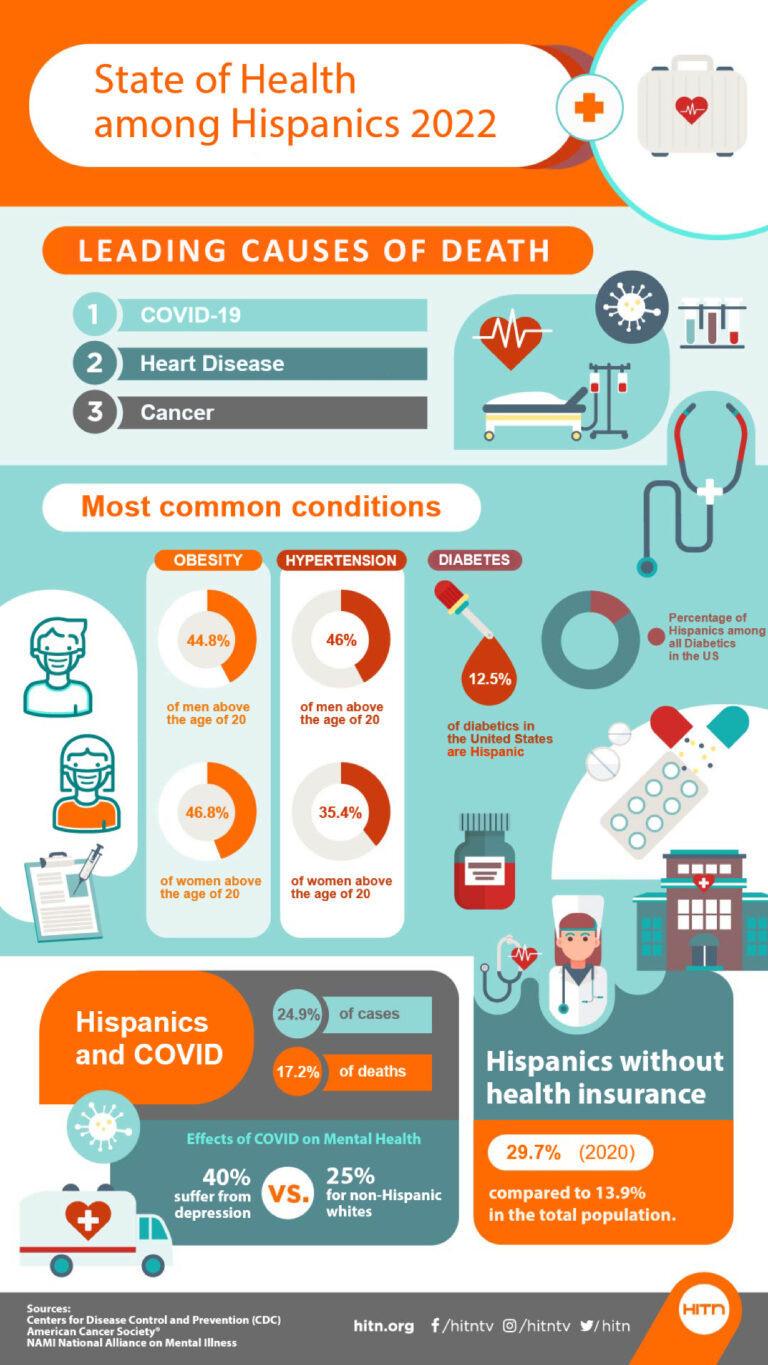
Source: mhanational.org/sites/default/files/2022%20State%20of%20Mental%20Health%20in%20America.pdf?eType=ActivityDefinitionInstance&eId=a7a571c8-7fac-4660-b06d-ff88af5c2bec
The following analyses are based on data from the 2018 -2019 Substance Use and Mental Health Services Administration’s (SAMHSA’s) National Survey on Drug Use and Health (NSDUH).3
While rates of mental health treatment are low for all youth with major depression, youth of color are significantly less likely to receive depression treatment than white youth. Asian youth were least likely to have seen a health professional or received medication for their depression (8.30%), followed by Black or African American youth (9.40%) and Hispanic youth (9.50%).
Of Youth With MDE: Did you see a Health Professional or Receive Medication for Depression in the Past Year?
*Data suppressed due to small sample size.
These analyses not only reflect disparities in who gets to receive mental health treatment, but what kinds of services they are able to receive and where they can access care. Youth of color with major depression were less likely to receive specialty mental health care than white youth. Specialty mental health treatment is defined as staying overnight in a hospital, staying in a residential treatment facility, spending time in a day treatment facility, receiving treatment from a mental health clinic, receiving treatment from a private therapist, or receiving treatment from an in -home therapist. Asian youth with a past year major depressive episode were least likely to have received specialty mental health care (71% did not receive care), followed by Native American or Alaska Native youth (68%), and Black or African American Youth (68%). White youth with MDE were most likely to receive specialty mental health care, but still over half of white youth with a past year major depressive episode did not receive tre atment (54%).
3 U.S. Department of Health and Human Services, Substance Abuse and mental Health Services Administration (SAMHSA), Center for Behavioral Health Statistics and Quality. (2018-2019). National Survey on Drug Use and Health 2018-2019. Retrieved from https://rdas.samhsa.gov/


Todas las pequeñas empresas necesitan ayuda con los aspectos básicos: preparar un plan de negocios, comercializar servicios y administrar el flujo de efectivo
Visite wellsfargo.com/es/biz para encontrar herramientas y las perspectivas estratégicas que podrían ayudarle a dirigir su empresa.
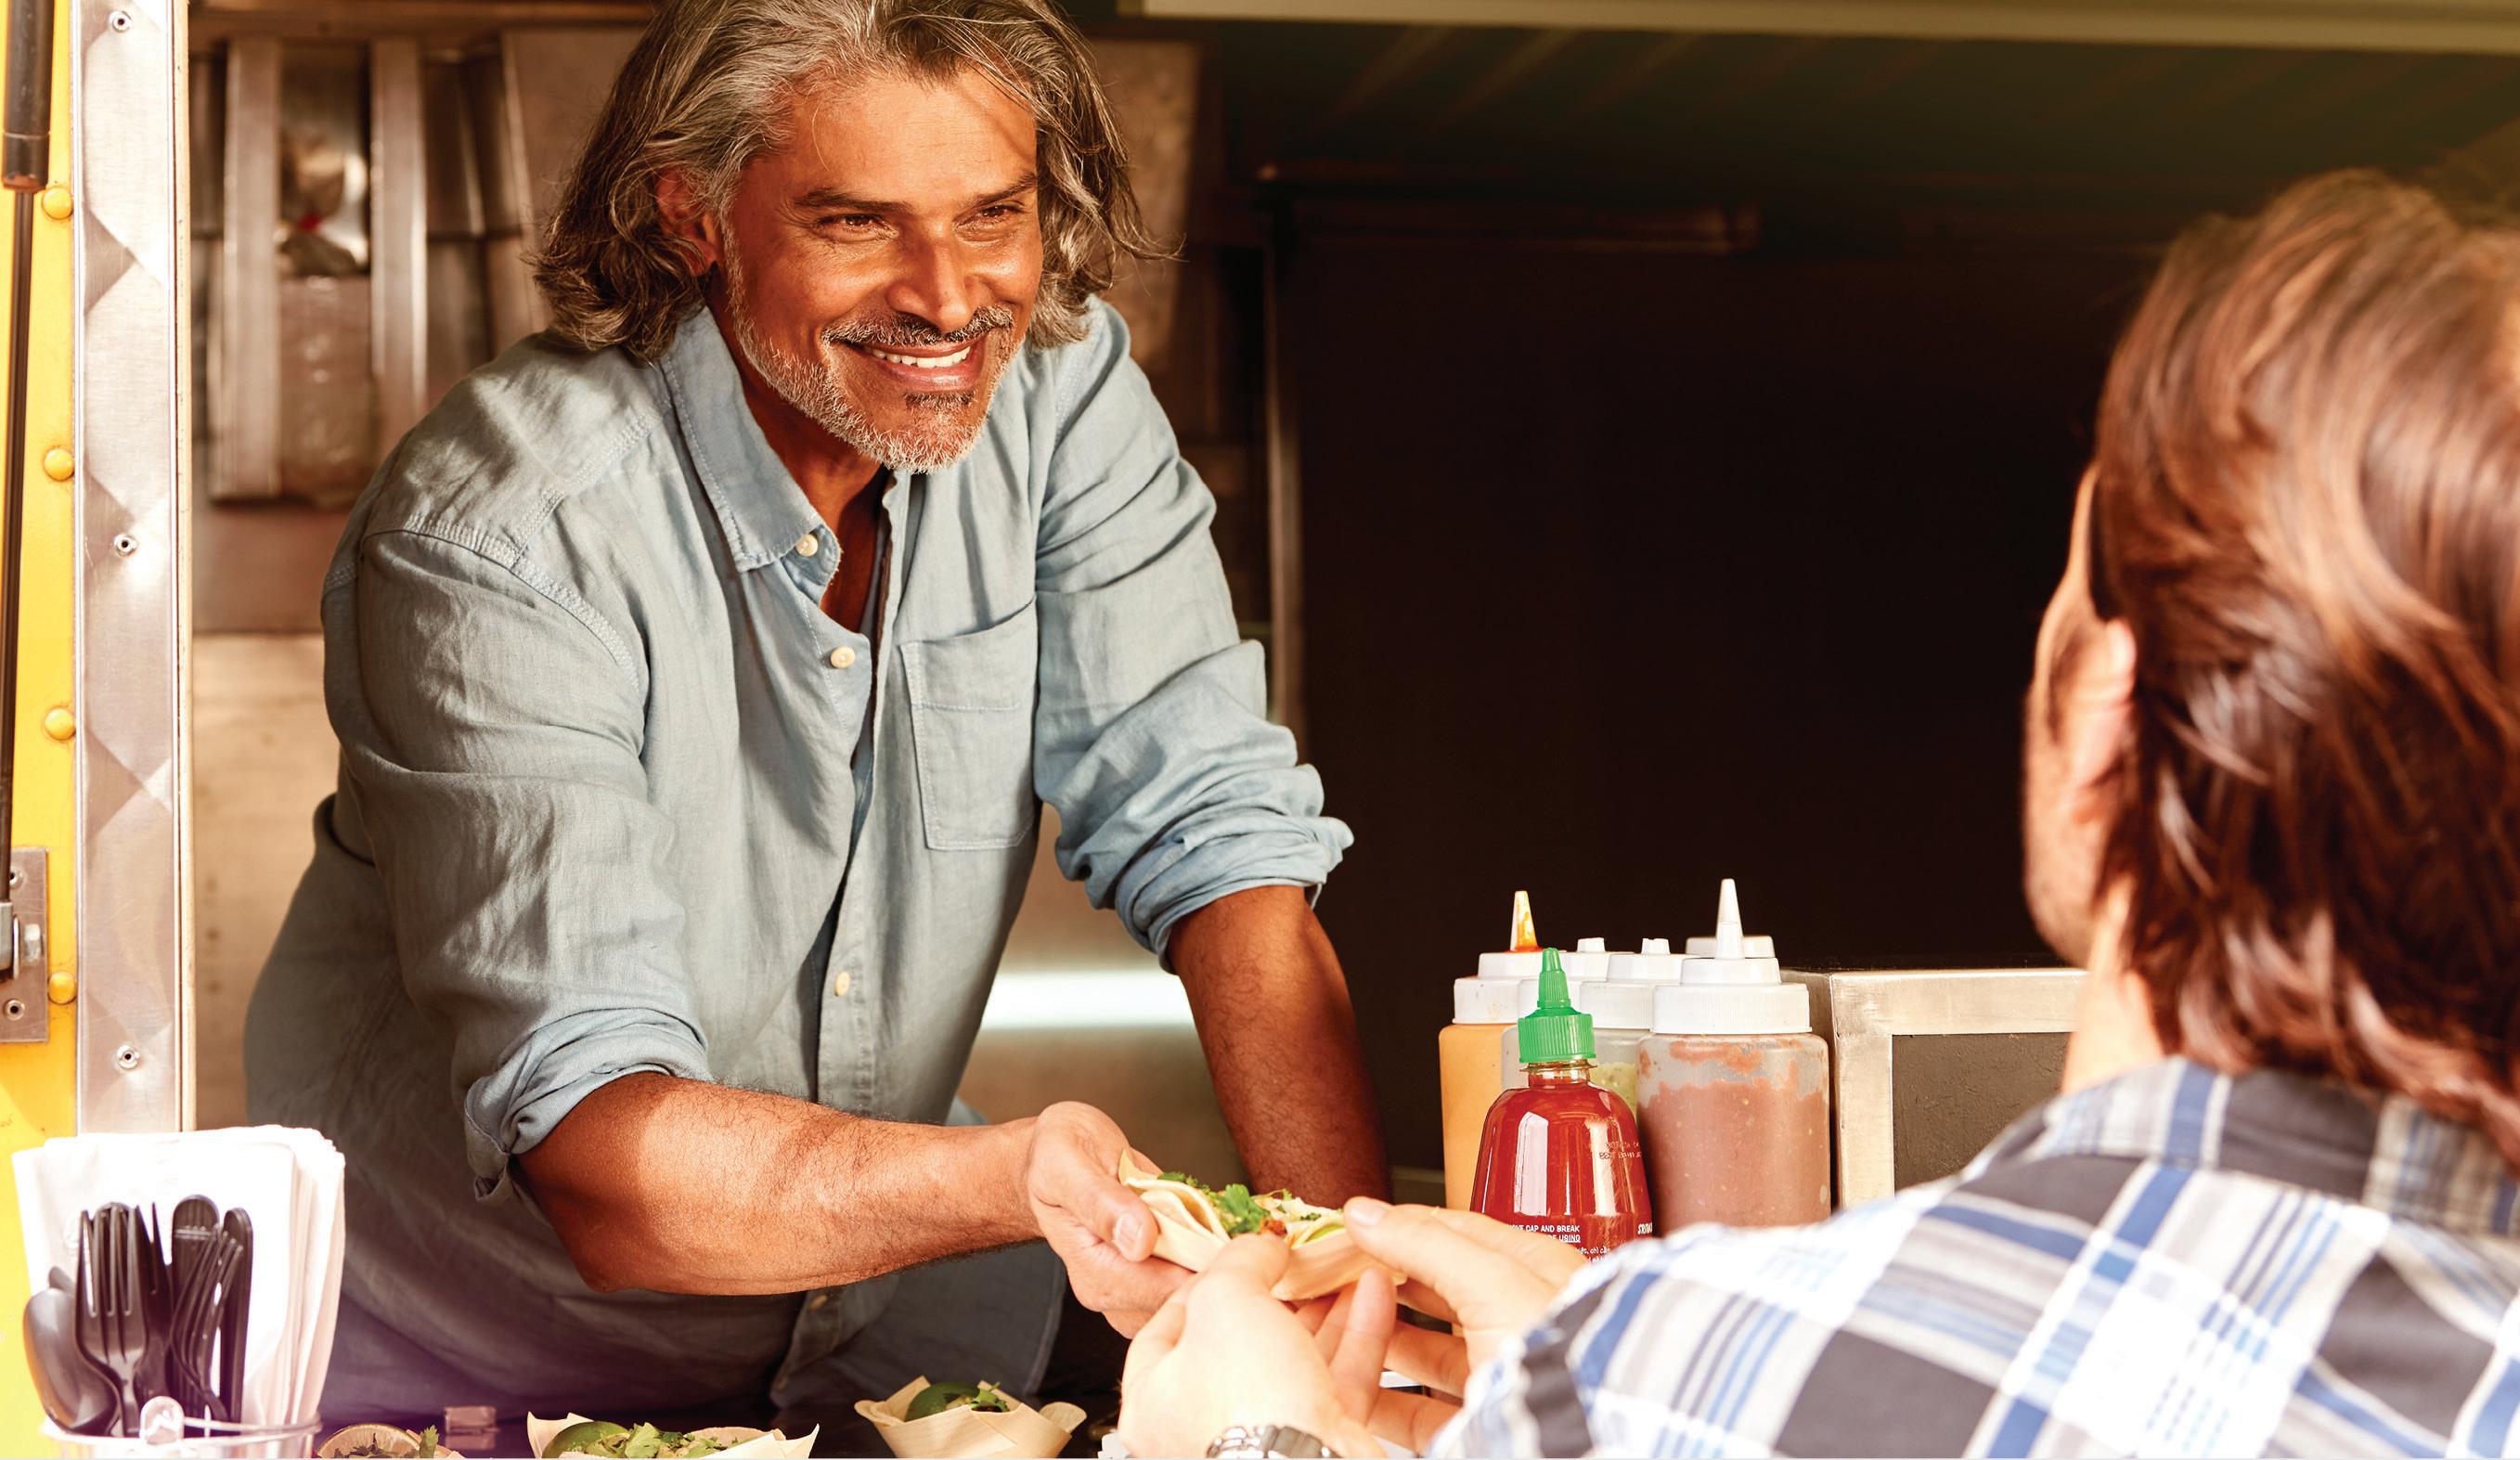
• HATE CRIMES BY TYPE
• TOP CRIME CONCERNS: ARIZONA VS. U.S.
• ARIZONA FALLS FAR BELOW OTHER STATES IN NUMBER OF SCHOOL SHOOTINGS 1970–2020
• ARIZONA'S VIOLENT CRIME RATE IS ABOVE THE NATIONAL AVERAGE 2018–2019
• PROPERTY CRIME CONTINUES TO DECREASE IN ARIZONA AND ACROSS THE U.S. 2015–2019
• TOP 10 SAFEST CITIES IN ARIZONA
• PERCENTAGE OF STUDENTS IN GRADES 9–12 WHO REPORTED HAVING BEEN IN A PHYSICAL FIGHT AT LEAST ONE TIME DURING THE PREVIOUS 12 MONTHS
• PERCENTAGE OF STUDENTS IN GRADES 9–12 WHO REPORTED USING ALCOHOL AT LEAST ONE DAY DURING THE PREVIOUS 30 DAYS 2019
• HIGH SCHOOL STUDENTS WHO REPORTED BEING THREATENED OR INJURED WITH A WEAPON ON SCHOOL PROPERTY 2017–2018 SCHOOL YEAR
CELLULAR PHONES
A look at the ways Hispanics in the Phoenix and Tucson markets use cell phones, courtesy of Univision Communications
FINDING REFUGE FROM THE HEAT BY
GRACIELA MARTINEZThe MAG Heat Relief Network is giving Maricopa County residents safe ways to cope with the brutal Arizona heat
Source: Cronkite News Arizona PBS, “Arizona hate crimes hit their highest level since 9/11, and it’s likely an undercount”, December 21, 2021 https://cronkitenews.azpbs.org/2021/12/21/arizona-hate-crimes-highest-level-since-9-11/
Source: Cronkite News Arizona PBS, “Arizona hate crimes hit their highest level since 9/11, and it’s likely an undercount,” Olivia Munson/Cronkite News, December 21, 2021 cronkitenews.azpbs.org/2021/12/21/arizona-hate-crimes-highest-level-since-9-11/
VIOLENT CRIME
Source: Safewise, Arizona’s 10 Safest Cities of 2021 (March 15, 2021) www.safewise.com/blog/safest-cities-arizona/
PROPERTY CRIME
Source: Safewise, Arizona’s 10 Safest Cities of 2021 (March 15, 2021) https://www.safewise.com/blog/safest-cities-arizona/
Source: Federal Bureau of Investigation, 2019 Crime in the U.S. ucr.fbi.gov/crime-in-the-u.s/2019/crime-in-the-u.s.-2019/topic-pages/property-crime
Source: Federal Bureau of Investigation, 2019 Crime in the U.S. https://ucr.fbi.gov/crime-in-the-u.s/2019/crime-in-the-u.s.-2019/topic-pages/property-crime


Arizona Town Hall educates, engages, connects and empowers people to resolve important issues through consensus, not division, using a process based on respectful dialogue that values diverse perspectives, builds relationships, and fosters leadership development. In addition to addressing statewide topics indentified by its members, Arizona Town Hall offers professional facilitation and training services to governments, organizations, and businesses.
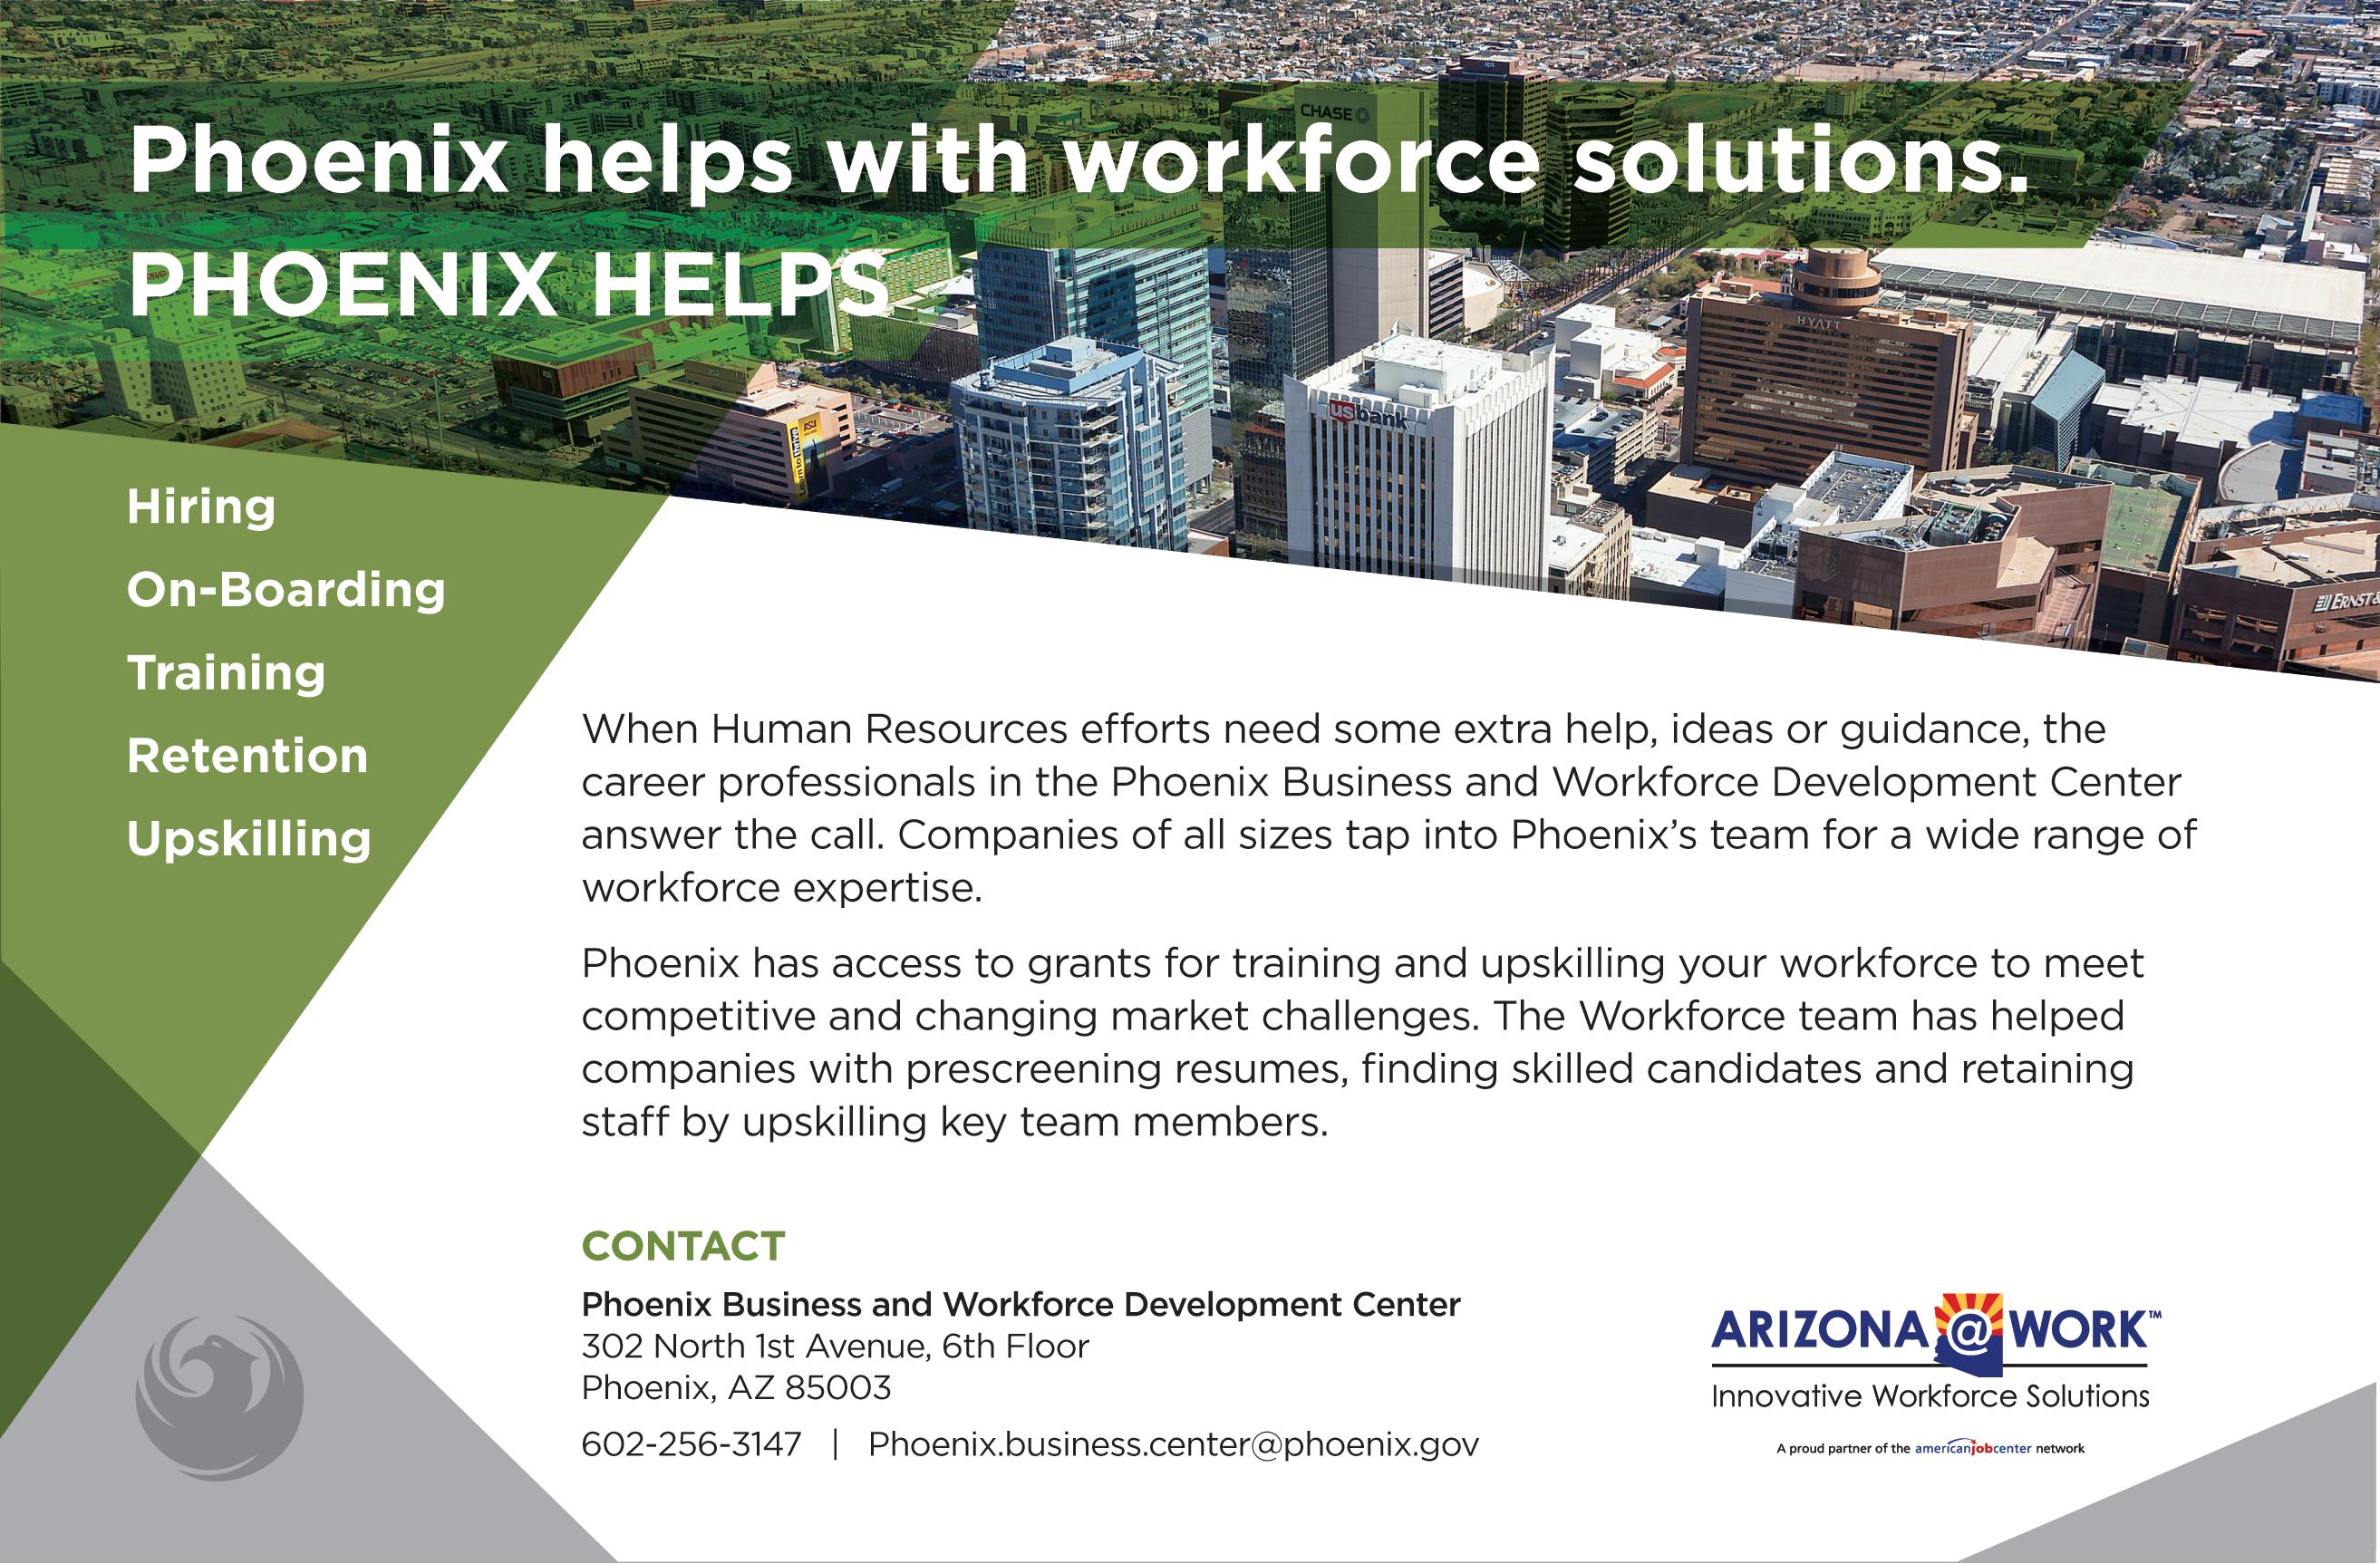


Every year since 2005, the Maricopa Association of Governments (MAG) has operated the Heat Relief Network beginning on May 1 and operating through the end of September. MAG hopes the network will provide community members with options for a safe environment and help prevent heat-related deaths and illnesses. MAG partners with local municipalities, nonprofit organizations, and other businesses to provide sites with cooling centers, hydration stations and donation sites.
In 2021, the Maricopa County Public Health reported 339 heatassociated deaths, with 82% of these deaths occurring in the months of June, July and August. This year, as of August 20, there have been 82 confirmed heat-associated deaths and 265 deaths are under investigation.
It is especially critical for Arizona residents to take shelter in airconditioned areas and remain hydrated when outdoor temperatures soar 100 degrees F. Heat-related deaths and illnesses are most common among the elderly and homeless, who often do not have access to “effective cooling and/or adequate hydration.”

The Heat Relief Network currently offers 110 cooling centers, 54 hydration stations and 98 donation sites—for water (43 locations), water and general products (51 locations) and general only (four locations). Businesses interested in providing heat refuge to Valley residents can complete a submission form online on the Heat Relief Network site; note that only public and nonprofit locations will be considered.
According to the Maricopa Association of Governments, there are eight specific ways people can prevent heat-related illnesses:
• Increase fluid intake, regardless of activity level. Staying hydrated is extremely important.
• Limit exercise or outdoor activity between 11am and 3pm.
• When outdoors, wear a hat, lightweight clothing and sunglasses.
• Use sunscreen with a minimum SPF 15—and reapply often.
• Rest frequently in shady or cool areas so your body temperature can recover and cool down.
• Never leave children, disabled adults or pets inside a parked vehicle.
• Respectfully check on elderly neighbors to ensure their air conditioning is working and in use.
• Take advantage of free air conditioning by visiting locations like shopping malls, the library or other heat refuge locations provided on the Heat Relief Network map.
MARICOPA ASSOCIATION OF GOVERNMENTS (MAG)

302 N. First Ave., Suite 300 Phoenix, AZ 85003
602.254.6300
azmag.gov
Heat Relief Network
Collection and Donation Sites
Staying Safe in the Extreme Heat (Maricopa County)
Summer Heat Safety (City of Phoenix)
Heat-Associated Deaths in Maricopa County, AZ (Preliminary Report for 2021)


• PERCENT OF RESIDENTS BICYCLING TO WORK 2020
• MODES OF TRANSPORTATION IN TUCSON, IN ARIZONA AND IN THE U.S.
• INCOME SPENT ON TRANSPORTATION 2021
• PERCENT OF U.S. HOUSEHOLDS WITHOUT A VEHICLE
• CHANGE IN FREQUENCY OF CYCLING MORE IF BARRIERS WERE REMOVED
• FREQUENCY OF CYCLING INSTEAD OF DRIVING TO SAVE TIME OR MONEY
• PERCEPTIONS OF BICYCLING
• RACE/ETHNIC COMPOSITION OF THE SEVEN TRANSIT-HEAVY METRO AREAS
• U.S. COMMUTERS WHO GET TO WORK BY PUBLIC TRANSIT
• AMERICANS WHO HAVE TRAVELED ABROAD
AUTO INSURANCE
An examination of auto insurance in the Phoenix and Tucson markets, courtesy of Univision Communications
KNIGHT-SWIFT FOSTERS DIVERSITY WITH ITS CULTURE OF EQUITY AND INCLUSION
BY RACHEL MONTIThe transportation company’s SOMOS Employee Resource Group unites the company’s Hispanic employees and celebrates the culture
TEMPE GETS THE VALLEY OF THE SUN’S FIRST MODERN STREETCAR LINE BY
GRACIELA MARTINEZValley Metro gives Tempe residents, businesses and students a more environmentally friendly way to get to the city’s downtown core
Source: Transfers Magazine, “Cycling Toward Mobility Justice in Latino Immigrant Communities,” Jesus M. Barajas, Spring 2021 transfersmagazine.org/wp-content/uploads/sites/13/2021/05/Transfers-Issue-7_Cycling-Toward-Mobility-Justice-in-Latino-Immigrant-Communities.pdf
Source: Transfers Magazine, Cycling Toward Mobility Justice in Latino Immigrant Communities, 2021 https://transfersmagazine.org/wp-content/uploads/sites/13/2021/05/Transfers-Issue-7_Cycling-Toward-Mobility-Justice-in-Latino-Immigrant-Communities.pdf


FREQUENCY
TO SAVE MONEY
BORN TO SAVE TIME
NEVER AT LEAST ONCE PER MONTH AT LEAST ONCE PER WEEK MORE THAN ONCE PER WEEK
Source: Transfers Magazine, “Cycling Toward Mobility Justice in Latino Immigrant Communities,” Jesus M. Barajas, Spring 2021 transfersmagazine.org/wp-content/uploads/sites/13/2021/05/Transfers-Issue-7_Cycling-Toward-Mobility-Justice-in-Latino-Immigrant-Communities.pdf
Source: Transfers Magazine, Cycling Toward Mobility Justice in Latino Immigrant Communities, 2021 https://transfersmagazine.org/wp-content/uploads/sites/13/2021/05/Transfers-Issue-7_Cycling-Toward-Mobility-Justice-in-Latino-Immigrant-Communities.pdf
(By U.S. Born and Immigrant Latinos)
PERCEPTIONS OF BICYCLING BY U.S. BORN AND IMMIGRANT LATINOS
PARKING IS EASY TO FIND AT TRANSIT
IS HARD TO DO WITHOUT TRANSIT
COMPLETELY DISAGREE SOMEWHAT DISAGREE NEITHER AGREE/DISAGREE SOMEWHAT AGREE COMPLETELY AGREE
Source: Transfers Magazine, “Cycling Toward Mobility Justice in Latino Immigrant Communities,” Jesus M. Barajas, Spring 2021 transfersmagazine.org/wp-content/uploads/sites/13/2021/05/Transfers-Issue-7_Cycling-Toward-Mobility-Justice-in-Latino-Immigrant-Communities.pdf
Source: Transfers Magazine, Cycling Toward Mobility Justice in Latino Immigrant Communities, 2021 https://transfersmagazine.org/wp-content/uploads/sites/13/2021/05/Transfers-Issue-7_Cycling-Toward-Mobility-Justice-in-Latino-Immigrant-Communities.pdf
Source: Transfers Magazine, Cycling Toward Mobility Justice in Latino Immigrant Communities, 2021 https://transfersmagazine.org/wp-content/uploads/sites/13/2021/05/Transfers-Issue-7_Cycling-Toward-Mobility-Justice-in-Latino-Immigrant-Communities.pdf
THE SEVEN TRANSIT-HEAVY METRO AREAS CONSIDERED IN THIS ANALYSIS ARE:
• Boston-Cambridge-Newton, MA-NH Metro Area

• Chicago-Naperville-Elgin, IL-IN-WI Metro Area

• Los Angeles-Long Beach-Anaheim, CA Metro Area
• New York-Newark-Jersey City, NY-NJ-PA Metro Area
• Philadelphia-Camden-Wilmington, PA-NJ-DE-MD Metro Area
• San Francisco-Oakland-Berkeley, CA Metro Area
• Washington-Arlington-Alexandria, DC-VA-MD-WV Metro Area
AMERICAN INDIAN AND ALASKA NATIVE ASIAN
NATIVE HAWAIIAN AND OTHER PACIFIC ISLANDER

ANOTHER RACE
TWO OR MORE RACES
HISPANIC OR LATINO ORIGIN, OF ANY RACE


WHITE ALONE, NOT HISPANIC OTHER

U.S. COMMUTERS WHO GET TO WORK BY PUBLIC TRANSIT (16 Years+, by percentage)
11.8
11.8
46.3
46.3 37.7
37.7
3.1 1
BUS SUBWAY OR ELEVATED RAIL LONG - DISTANCE TRAIN OR COMMUTER RAIL LIGHT RAIL, STREETCAR, OR TROLLEY FERRYBOAT
3.1 1 BUS SUBWAY OR ELEVATED RAIL LONG - DISTANCE TRAIN OR COMMUTER RAIL LIGHT RAIL, STREETCAR, OR TROLLEY FERRYBOAT
Source: Source: U.S. Department of Commerce, U.S Census Bureau, "New Census Report Shows Public Transportation Commuters Concentrated in Large Metro Areas of the United States," April 1, 2021 www.census.gov/newsroom/press-releases/2021/public-transportation-commuters.html
Source: Source: U.S. Department of Commerce, U.S Census Bureau, "New Census Report Shows Public Transportation Commuters Concentrated in Large Metro Areas of the United States," April 1, 2021 https://www.census.gov/newsroom/press-releases/2021/public-transportation-commuters.html
Source: Source: U.S. Department of Commerce, U.S Census Bureau, "New Census Report Shows Public Transportation Commuters Concentrated in Large Metro Areas of the United States," April 1, 2021 https://www.census.gov/newsroom/press-releases/2021/public-transportation-commuters.html
AMERICANS WHO HAVE TRAVELED ABROAD
(By Race/Ethnicity) BY RACE/ETHNICITY
75%
49%


73% BLACK WHITE HISPANIC
Source: Pew Research Center, "Most Americans have traveled abroad, although differences among demographic groups are large," Laura Silver, August 12, 2021 www.pewresearch.org/fact-tank/2021/08/12/most-americans-have-traveled-abroad-although-differences-among-demographic-groups-are-large/
ARIZONA
Source: Pew Research Center, "Most Americans have traveled abroad, although differences among demographic groups are large," by Laura Silver, August 12, 2021 https://www.pewresearch.org/fact-tank/2021/08/12/most-americans-have-traveled-abroad-although-differences-among-demographic-groups-are-large/


 BY RACHEL MONTI
Knight-Swift Transportation Holdings, Inc. is one of the largest, most diversified freight transportation companies, operating one of the largest truckload fleets in North America from its headquarters in Phoenix. The company provides multiple full truckload transportation, less than truckload (LTL) shipping, intermodal and logistics services using a nationwide network of business units and terminals in the United States and Mexico to serve customers throughout North America.
The American Trucking Associations (ATA) estimates that trucks transported 83.8% of the value of surface trade between the U.S. and Mexico in 2020. It is not surprising that truckload transportation is extremely critical to the economic viability of both countries. Knight-Swift has long been a key contributor in this space through our TransMex subsidiary. Founded in 1994 in Nogales, Mexico, TransMex is unique in its ability to offer door-todoor transportation solutions and other premium fleet services that reduce the wait time at border-crossing locations.
At Knight-Swift, diversity, equality and inclusion serve as the three pillars that support our organization’s innovative culture and continually improve our employee experience on both sides of the border. Attracting, retaining and celebrating our diverse
workforce allows us to achieve a competitive business advantage, while continually working toward a more inclusive workplace. It is with this commitment in mind that we have created Employee Resource Groups (ERGs) in recent years to strategically identify and cultivate new opportunities for all employees.
For the thousands of our Hispanic team members, the company launched the collaborative ERG network SOMOS in 2021. The goal of SOMOS is to unite our Hispanic community and allies to promote cultural awareness and professional development and advancement while also positively affecting the hiring and retention of our talented associates.
As part of the SOMOS ERG, the company offers education and celebrations of Hispanic Heritage month, helps Latinx employees advance in information technology careers; and foster crosscollaborations with other business and community leaders. The influence of SOMOS will be expanding in the coming months to include volunteer opportunities with local Arizona not-for-profit organizations that support the Hispanic community.
In addition to the education, networking and volunteering events that SOMOS offers our employees, Knight-Swift has also made
“Education may feel unattainable for some. Thanks to our debt-free program, our Knight-Swift employees can make their educational goal a reality! Our debt-free program gives our staff, drivers, and dependents the tools and knowledge to advance in their careers and personal growth. What a beautiful way to celebrate our diversity and talent!"
—YOMAHIRA VILLALOBOS Knight-Swift’s Diversity and Inclusion Coordinator
KNIGHT-SWIFT FOSTERS DIVERSITY WITH ITS CULTURE OF EQUITY AND INCLUSION
substantial investments in the formal education of our employees by offering skill-building opportunities. In addition, our Go the Distance program offers debt-free college tuition to employees and their eligible dependents through partnerships with schools such as the University of Arizona Global Campus and Colorado Technical University.
At press time, more than 440 undergraduate and graduate degrees, completely tuition-free, are currently being pursued through this program. Knight-Swift believes that providing our employees with the education and skills they need to succeed in their current and future jobs is a proven approach that will help bridge the economic divide and help the company attract, develop and retain a productive workforce. By creating an inclusive, diverse workforce, we believe we not only create a space for employees who share common interests, we also support each another and the communities we serve.
Rachel Monti is the chief human resources officer for Knight-Swift Transportation, Phoenix.
DRIVING OPPORTUNITIES
KNIGHT driveknight.com
SWIFT swifttrans.com/careers/drivers
OFFICE & SHOP OPPORTUNITIES
KNIGHT jobs.jobvite.com/knight/jobs
SWIFT jobs.jobvite.com/swifttrans/jobs
AMERICAN TRUCKING ASSOCIATIONS –ECONOMICS AND INDUSTRY DATA
trucking.org/economics-and-industry-data
Valley Metro has collaborated with the city of Tempe to provide residents, businesses and students with a more efficient, environmentally friendly way to access Tempe’s downtown core.
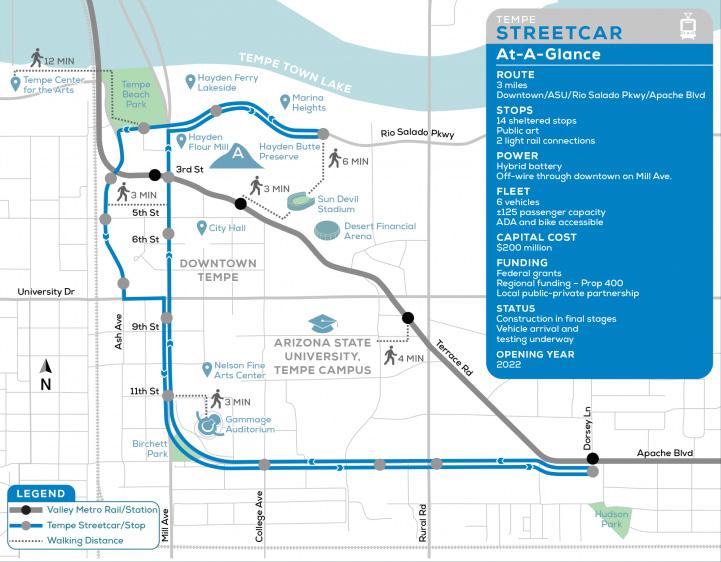
The Tempe Streetcar service began May 20, 2022, and will be free for the first year. It has been a long time coming: The streetcar was originally approved by voters in 2004. Initial projections said the project would be completed by mid-2021. Like many projects in the COVID era, though, Brookville Equipment Corp., the manufacturer of the streetcar, faced supply chain issues that caused significant delays.
The streetcar operates every 15–20 minutes on Mill and Ash Avenues from Rio Salado Parkway and Marina Heights to Dorsey Lane and Apache Blvd. It differs from the local light rail system in that it shares the street with vehicle traffic. The three-mile track has a total of 14 stops that are decorated with local artwork. Each streetcar has a capacity of 125 people.
There currently are four streetcars operating and two more are on the way. In alignment with Valley Metro’s focus on decreasing its carbon emissions, the streetcars are hybrid vehicles that can switch to battery power.
The total cost of the project is $200 million and, according to Valley Metro, the funding came from three sources:
• $103 million in federal funds;
• 75 million from regional Prop. 400 funds; and
• $13 million from public and private partnerships, such as the city of Tempe, Arizona State University, major employers and property owners.
“The project received a Finding of No Significant Impact (FONSI) from the Federal Transit Administration (FTA) in October 2015,” Valley Metro says, “which indicates that the project will have no significant environmental effect on the neighboring communities.”
Despite the design’s environmental consideration and goal to increase mobility, it has received criticism from certain members
of the community, including David King, who is currently an assistant professor at ASU’s School of Geographical Sciences and Urban Planning.
King was an assistant professor at Columbia University’s Graduate School of Architecture, Planning and Preservation and the main investigator for the February 2016 Columbia University Report, Streetcar Projects as Spatial Planning: A Shift in Transport PlanningintheUnitedStates.
King emphasizes that development is often the underlying factor in these types of projects. Thus, he says, “Planning priorities for streetcar projects such as accessibility for low-income and underserved communities are often overlooked.” King believes that streetcars are not the solution to increasing mobility and improving transportation and says that there are less costly solutions, such as changing the zoning and improving sidewalks.
In its conclusion, the report said: “The fact that regional transit agencies are rarely the champion of streetcars, and in many cases recuse themselves from the projects, suggests that there may be conflicting visions about how to best leverage scarce transportation resources to achieve spatial planning goals, including the geographic scale at which trade-offs and benefits should be evaluated.
“None of this is to say that streetcar projects should not be pursued by cities. Rather, we argue that these projects should be viewed as a turn toward spatial planning and be evaluated against other economic development strategies rather than against other transit improvements. Such a framework raises important questions about the role of federal transportation funding and whether new federal agencies should be making funds available for streetcars projects. Streetcars, as currently practiced in the United States, act as desirable amenities more than meaningful transit improvements.”
Although the benefits and costs of the Tempe Streetcar will likely be debated for some time, an Aug. 13 article on the ABC15 website quotes several students who are excited to take advantage of the transit option in the heart of Tempe. According to the article, Valley Metro says there were 23,775 boardings during the first month of operation.
If ridership stays that high after the free year is over, Valley Metro can count this new transit option as a big success and Valley residents will likely see more streetcars in the future.
Graciela Martinez is a business research analyst intern forthe Arizona Hispanic ChamberofCommerce, Phoenix.
THE TEMPE STREETCAR
valleymetro.org/project/tempe-streetcar
FROM THE STATE PRESS
Tempe Streetcar will open in 2022 with Uncertain Transit Benefits
FROM ABC15
New Tempe streetcar service prepares for the return of ASU students while eyeing Mesa expansion
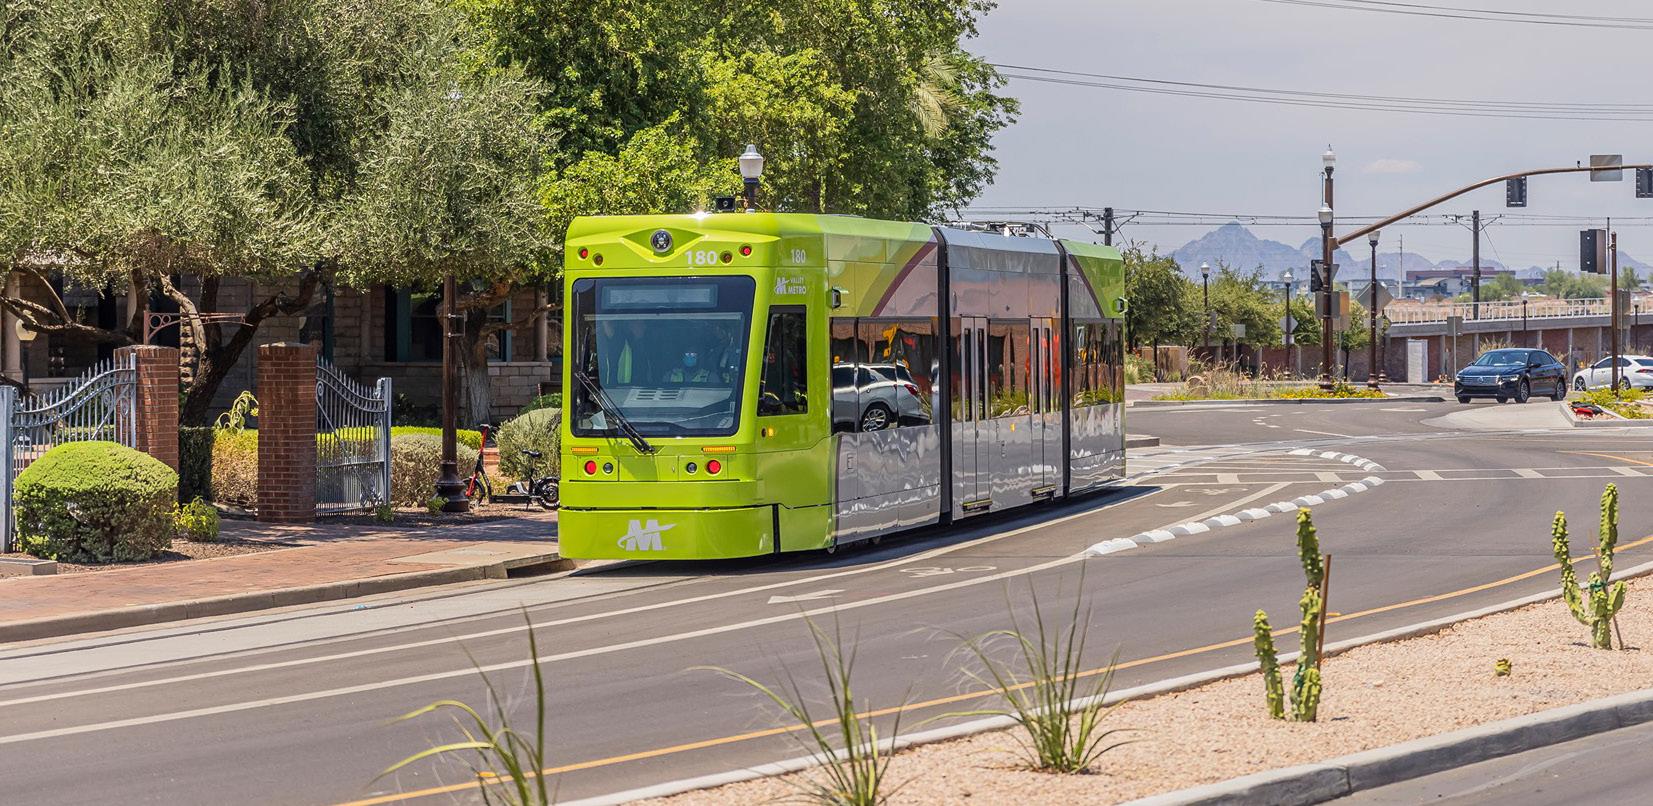
2016 COLUMBIA UNIVERSITY REPORT
utrc2.org/sites/default/files/Final-Report-StreetcarProjects-Spatial-Planning.pdf

• PERCENT OF PHOENIX RESIDENTS WITHIN A 10-MINUTE WALK FROM A PARK 2022
• PERCENTAGE OF PARK SPACE NEARBY PER PERSON
• PARKSCORE RATING FOR MAJOR AZ CITIES
• CALIFORNIA HAS THE MOST NATIONAL PARK SITES & HISTORIC TRAILS THAT PRESERVE LATINO/HISPANIC HERITAGE
• NATIONAL PARK VISITORS WHO THINK ENTRANCE FEES ARE TOO HIGH
• THE TOP 5 REASONS LATINOS DON'T HAVE ACCESS TO GREEN SPACES
• ONLY 1 IN 3 LATINOS LIVE WITHIN WALKING DISTANCE (LESS THAN 1 MILE) OF A PARK
• ONLY 19% OF LATINO CHILDREN HAVE ACCESS TO RECREATIONAL GREEN SPACES CLOSE TO THEIR NEIGHBORHOODS
A profile of Hispanics and health clubs, courtesy of Univision Communications
BY CAM JUAREZ
It is time for Hispanics to embrace our beautiful National Park System—and they can start with a visit to Saguaro National Park near Tucson
A study of soccer fandom, its influences and impact on sports and media in the U.S.
•
•
TEXAS
•
•
•
•
•
FLORIDA
•
LOUSIANA
•
RHODE
•
Source: Salud America, The State of Latino Green Space Fact Sheet (May 2019) xrv281o3wvu1d29sd405vdf6-wpengine.netdna-ssl.com/wp-content/uploads/2019/05/Fact-Sheet-Green-Space-2019.pdf


Salud America!, "Research: Latino Communities Lack Accessible Green Space," May 2019 https://xrv281o3wvu1d29sd405vdf6-wpengine.netdna-ssl.com/wp-content/uploads/2019/05/Fact-Sheet-Green-Space-2019.pdf
LOW-INCOME NEIGHBORHOODS POPULATED BY MINORITIES AND RECENT IMMIGRANTS ARE PARTICULARLY SHORT OF GREEN SPACE. THESE INDIVIDUALS ALSO ARE SIGNIFICANTLY LESS LIKELY THAN WHITES AND HIGH-INCOME INDIVIDUALS TO ENGAGE IN REGULAR PHYSICAL ACTIVITY THAT IS CRUCIAL TO GOOD HEALTH.
—SALUD AMERICA (2019)


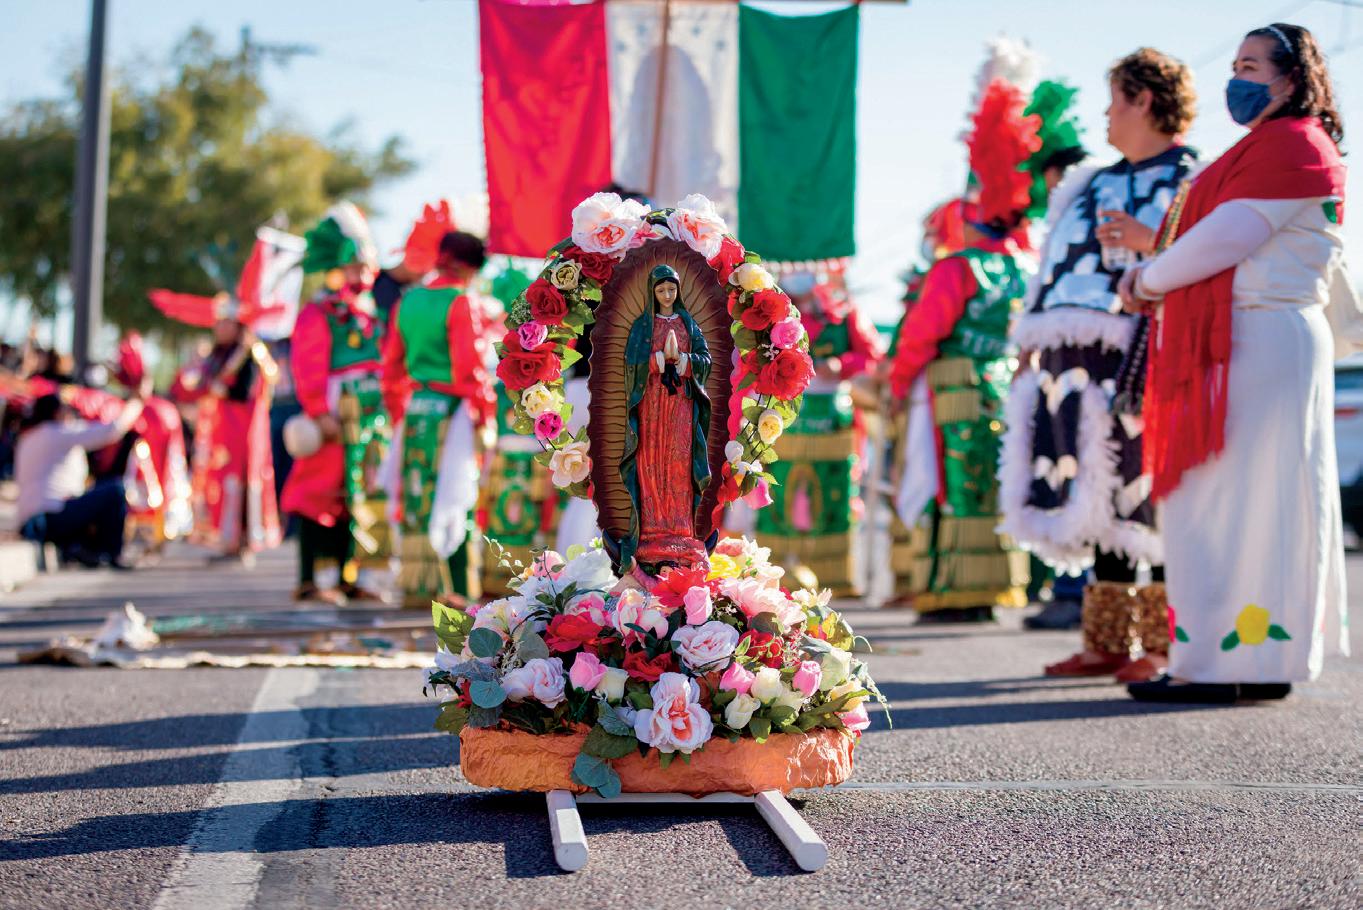
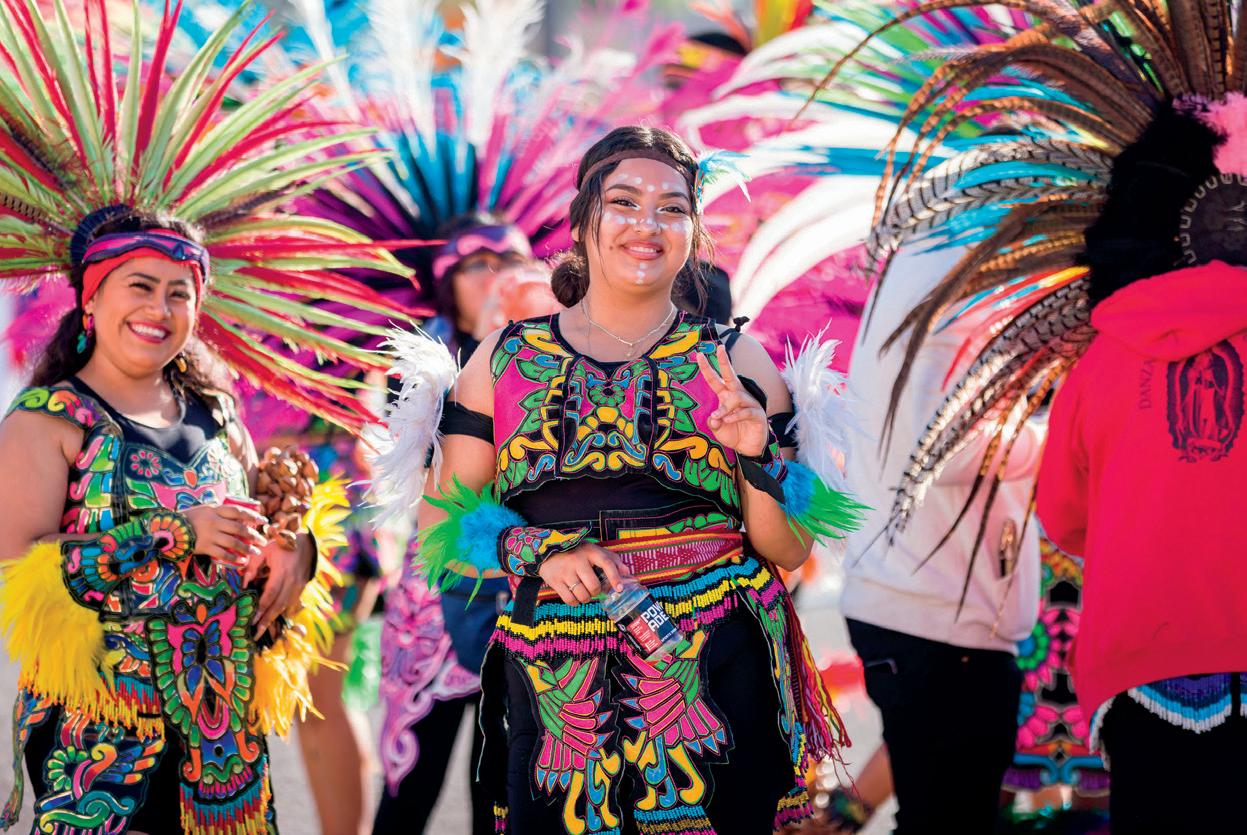

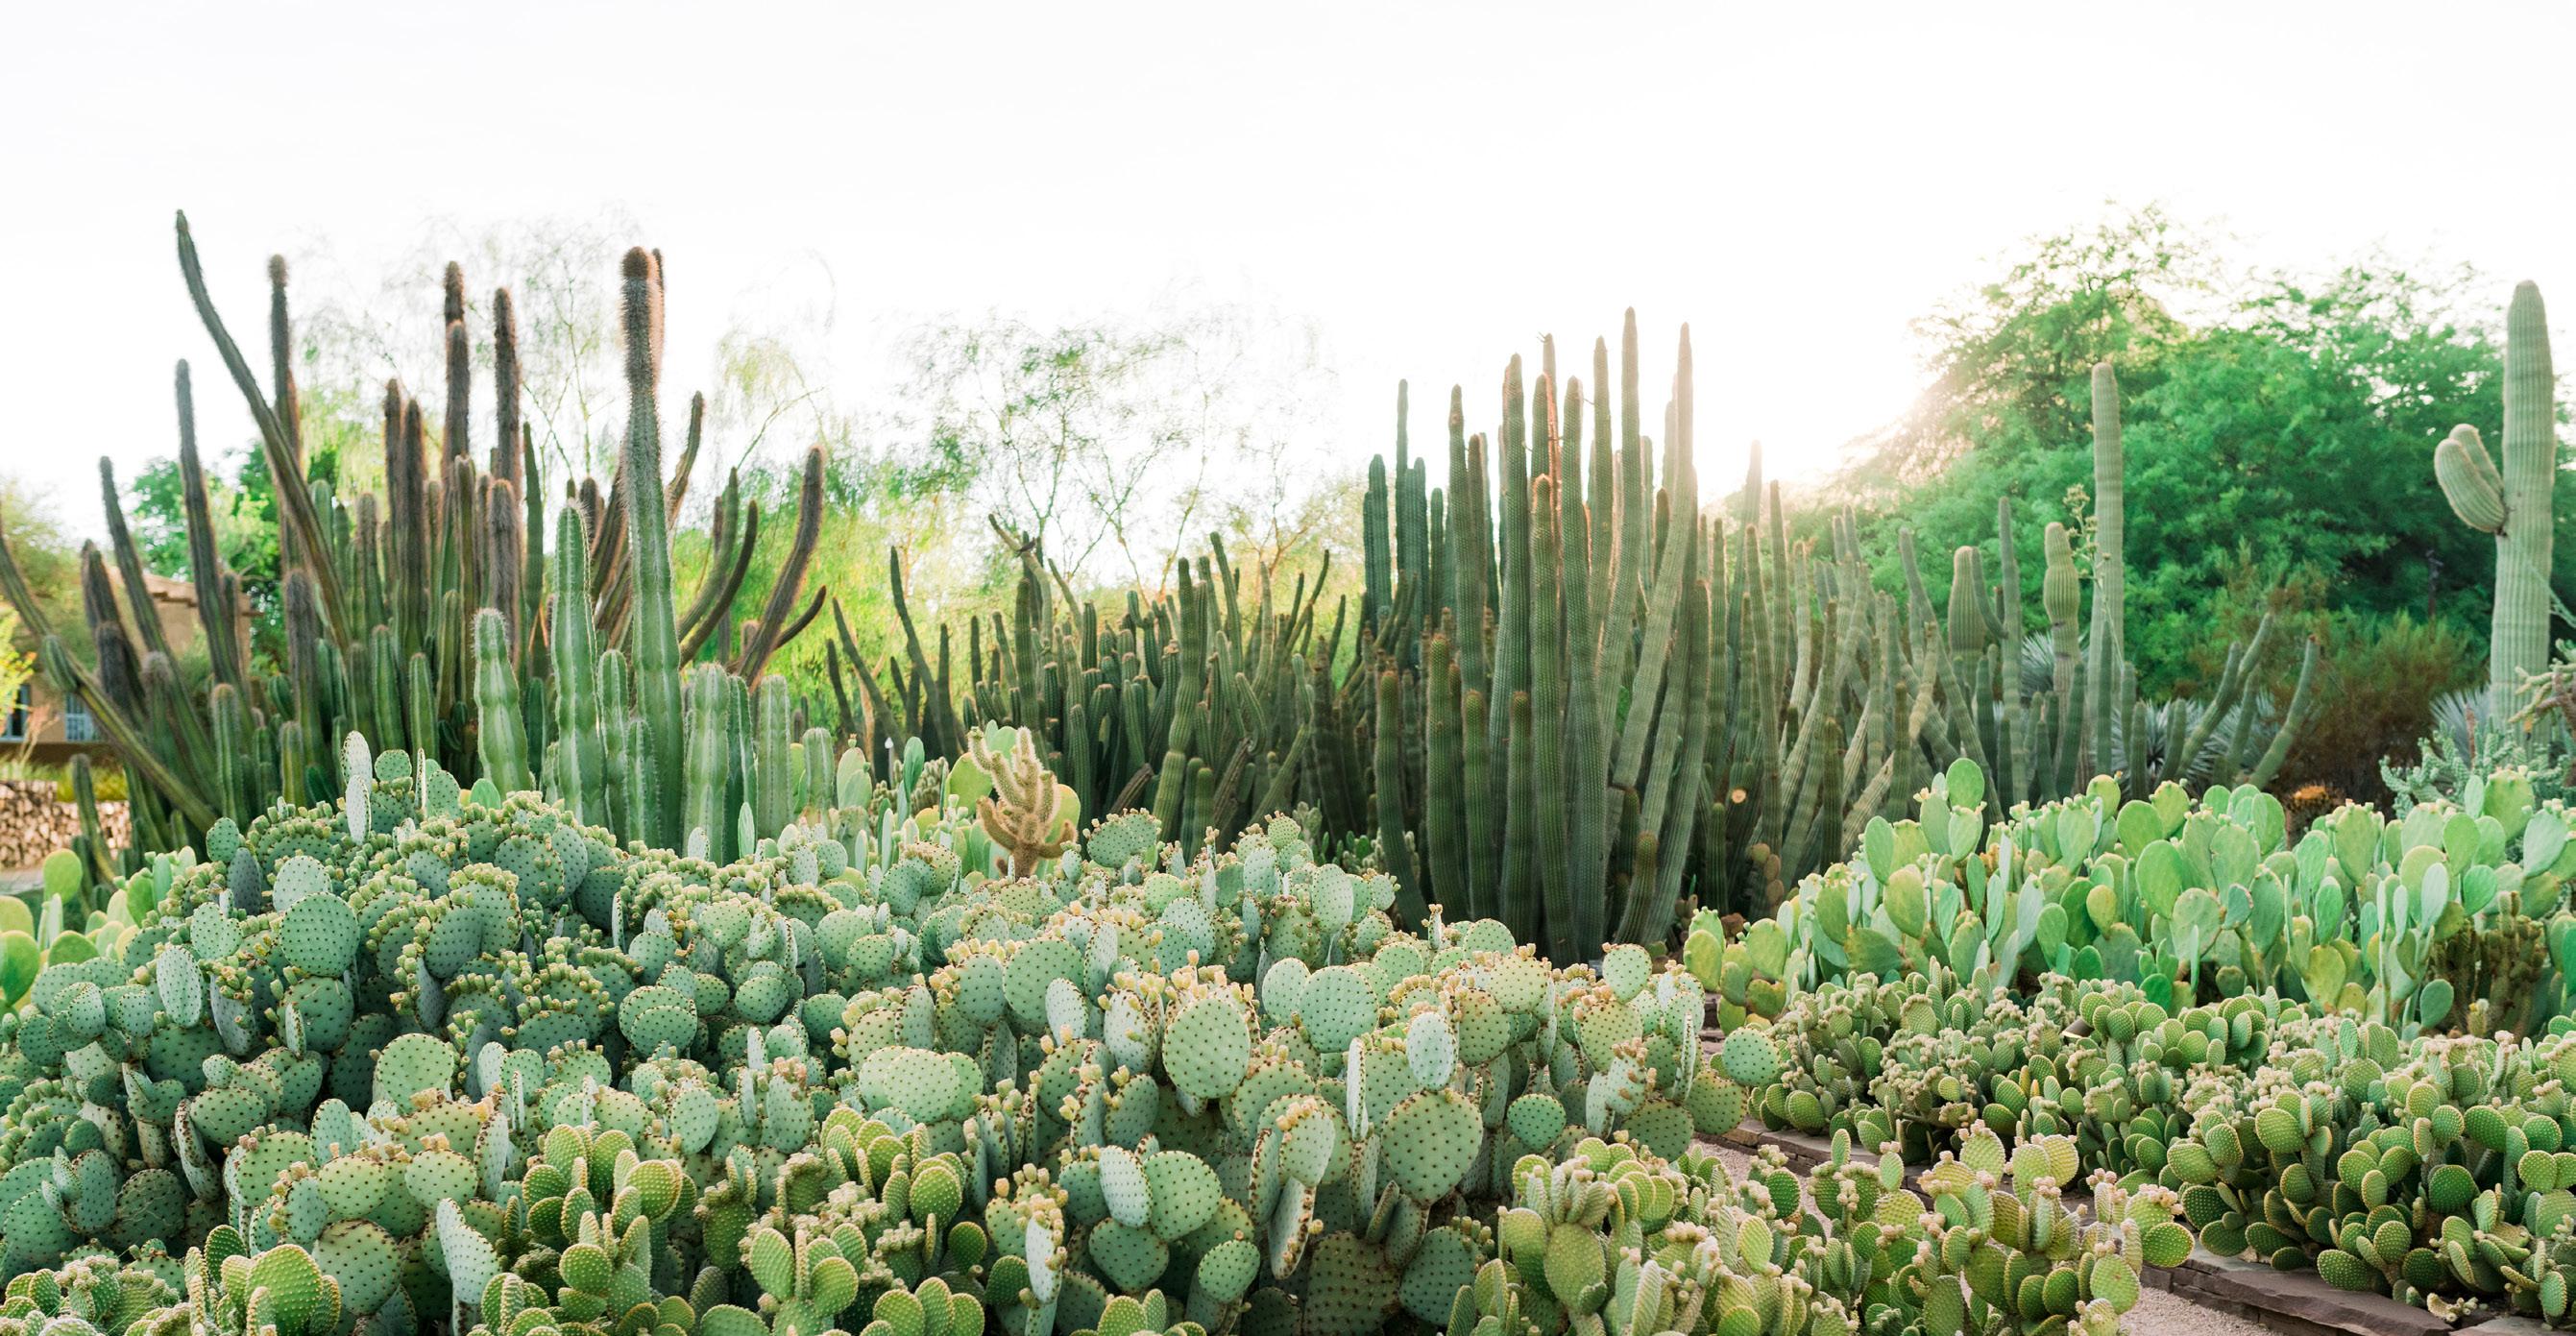
 BY CAM JUAREZ
More than 500 years of Hispanic and Latino history and heritage can be found in our national parks or shared through National Park Service programs and partners in communities throughout the U.S.
The National Park System (NPS), which celebrated its 106th birthday on Aug. 25, 2022, represents a national commitment to protect and value the beauty and wonder of our natural and cultural world. The system includes 423 areas that cover more than 85 million acres in every state, the District of Columbia, American Samoa, Guam, Puerto Rico and the Virgin Islands. Arizona is home to 22 national park units, making it an important partner in ongoing conversations about how best to connect our communities to our public lands.
Many of these park units have begun to make good progress toward ensuring that our national parks and monuments fully reflect the United States’ ethnic, social and cultural diversity. The National Park Service is dedicated to presenting inclusive stories that highlight our nation’s diversity and the role that diversity plays in telling America’s stories in our national parks.
According to a 2020 report by the U.S. Department of Commerce and the Outdoor Foundation, the outdoor recreation economy generated more than $7.6 billion in consumer spending and created more than 95,000 jobs in Arizona. Unfortunately, workforce employment in national parks and other public land agencies still does not reflect the U.S. population, which is why it is crucial to increase access for Hispanics and other diverse communities to these places so they have opportunities to pursue natural resource careers and become the next generation of scientists, stewards and park rangers.
Of the 16,523 permanent workers in the National Park Service in 2019, only 8.2% were Hispanic, according to David Vela, NPS’s former acting director. Even though Hispanics are the fastestgrowing minority group in the United States, only 1 in 10 national park visitors is Hispanic. It’s an out of sight, out of mind kind of
a problem. How do you convince Latinos, who seldom see the national parks as a vacation destination, to not only visit the parks, but also consider working there?
The effort to connect diverse groups of Americans to our nation’s parks and monuments is vital, especially as our country continues to undergo notable demographic changes. According to the Pew Research Center, the Hispanic population was 42 million in 2005, and is predicted to triple in size to more than 128 million by 2050. Latinos will be 29% of the U.S. population, making Hispanics the largest minority group in the nation.
Saguaro National Park has been making concerted efforts to engage and attract Hispanic audiences, as well as other underserved communities. The park’s community engagement team connects with our diverse communities beyond the park boundaries by showing up to community events and uplifting efforts that link Latinos to healthy outdoor spaces. The park’s Visitor Centers are working hard to be more welcoming and accessible for everyone. In the past 15 years, the park has also focused on recruiting, retaining and promoting more young Latino/Latina professionals.
By 2020, half of all youth in America will be of color. By 2050, a majority of our country’s residents will be Hispanic. Despite these numbers, a 2018 Outdoor Foundation study found that 73% of Americans who participated in outdoor activities were white. In simple terms, the future of public lands depends on engaging and welcoming our diverse youth.
Hispanics have a deep conviction that acting as environmental stewards is part of our moral duty. When I attend events, Latinos have shared with me that outdoor activities like picnics, fishing, camping and going to parks are important activities for them and their families. Many of these activities are inexpensive and are connected to deeply rooted traditions that Latino families bring with them to the U.S.
Personal and public health are probably the biggest issue for Hispanics, especially as it relates to the environment. Latino immigrants often live in polluted urban centers or near industrial areas, which often are the only places where families new to the
country can afford to live. This puts these immigrants in areas with poor air and water quality, and a lack of access to green spaces, which can lead to an increased risk for chronic illness. Asthma, for instance, is twice as likely in Latino children as it is in white children, according to a 2016 Environmental Protection Agency (EPA) study. When you add disproportionate rates of obesity, heart disease, stress-induced illnesses, diabetes and even cancer to the mix, then it’s obvious that we must turn to nature to help nurture us back to health.
The Park Service reflects many of our nation’s histories and stories; however, few park units reflect and focus on the connections between the Park Service and the histories of Hispanic visitors. In recent years, National Park interpretive programs have begun to develop programming that is more relevant to Hispanic communities, and increasing partnerships with Hispanic organizations could help develop additional programs.
That’s where groups like the National Park Foundation, the park system’s official nonprofit partner, comes in. The foundation’s American Latino Heritage Fund helps to ensure that the parks include Hispanic voices and experiences as an important part of the country’s history and encourages Latinos to visit and connect with parks.
Other organizations such as Corazon Latino, Latino Outdoors, Familias Unidas Ganando Accessibilidad (FUGA), the Hispanic Access Foundation and Green Latinos seek to foster cultural and natural resource stewardship and are interested in equitably connecting Hispanics to nature.
Technology also is helping us get the word out about our parks. One of the ways we are starting to make some headway is through social media. Instagram, Facebook, TikTok and Snapchat are all ways to show friends and family how beautiful and fun our parks are. When a visitor posts a picture, suddenly it’s real—and not just for outdoorsy white folks anymore.
CamJuarezisaparkrangerinTucson,AZ,andservesasthecommunity engagement and outreach coordinator for Saguaro National Park. Ranger Juarez was recruited in 2015 and connects with more than 54,000 members ofthe public annually.
I grew up in Yuma, AZ, and have lived in Tucson for 31 years. I never visited the Grand Canyon until I went with my wife and her family when I was 29 years old. En serio, I can’t ever remember even talking about going to a national park as a kid.
I do remember going to Yosemite National Park when we worked in central California as a migrant farmworker family, but I think it was just because we were working near the park on a Saturday morning and decided to check it out. I don’t know what made it unappealing: the idea of sleeping outside on the ground or a fear of being mauled by a wild animal. As a college student paying my way through school, I am sure the prohibitive costs kept me from exploring our parks. These days, I recognize rising fuel costs and lodging also are barriers for a lot of people. But ultimately, if there is a will, there is a way.
We all make choices every day with our finite resources how to spend our money. When we consider something important enough, we save up for it, like we do for a quinceañera, or a trip to Disneyland or Rocky Point. Prioritizing a trip to a National Park is something we can all do. My hope is that more and more people will start to see our National Parks as vacation destinations. Who knows? Maybe one of our kids will even wear an NPS uniform when they grow up.
After I was recruited in 2015 to be the community engagement and outreach coordinator at Saguaro National Park, I traveled to another 40 National Park units around Arizona and the U.S. I have enjoyed traveling, camping and being outdoors so much more since I began to really experience those activities. It really made a difference to me to know more about our nation’s National Park System. And now it is my job to get others to embrace nature and visit our beautiful national parks.
Source: online.flipbuilder.com/telemundo/lqcw/

The future is fútbol and excitement is rumbling through bleachers across the United States! Fútbol, one of the biggest businesses in the world, has become the fastest-growing major team sport in the U.S. Riding high on popularity among youth, women and Latinos, the sport is benefiting from attention sparked by the FIFA World Cup 2022™ happening this fall in Qatar and anticipating the tournament coming to the U.S. in 2026. These underlying forces are causing a fundamental shift in the role and importance of soccer in mainstream American sports:
• The Fastest-Growing Major Team Sport in America: Fútbol has an estimated 85 million adult U.S. followers and has seen a significant increase in popularity, with a gain of 52% more fans from 2012 to 2019. That compares to 27% growth in basketball and 8% growth in baseball during this period.
• A Multi-Billion Dollar Business: While soccer is the most popular sport in the world, it is still underdeveloped in the U.S., a market primed for potential and profitable growth. U.S. soccer fans spend 7% more than average American sports fans on team sports clothing and are more likely to purchase sports-related items like tickets, equipment, and memorabilia.
• Latinos Fuel Growth in a "Fútbol is Everything" Culture: Hispanics are three times more likely than non-Hispanics to identify as soccer Superfans. Latinos are igniting soccer's growth as they drive many of the country's demographic, cultural and political trends. More than half (53%) of Latinos ages 16 and older and nearly 1 out of 3 non-Latinos (29%) say they plan to watch this year's World Cup.
• World Cup Is as Big as a Holiday: The World Cup is ranked second only to Christmas for Latino Enthusiasts. The mega event is entrenched in the hearts and minds of millions of Latinos and nonLatinos who see it as a joyful time for gathering, connecting, and living life to the fullest.
• Biggest Multi-Platform Sporting Event: The incremental viewership from live streaming across multiple devices made the 2018 FIFA World Cup™ the biggest multi-platform event in the history of Spanishlanguage media, and the viewership of the FIFA World Cup 2022™ is expected to outpace it. Soccer media coverage and content have increased exponentially to meet the demand for high-quality live, virtual, and social fan experiences 24/7.
• The Power of Spanish:
According to a brain neuroscience study conducted among U.S. bilingual Hispanics, watching a World Cup match with Spanish commentary generated 15% greater likeability than watching the identical match in English. Key game moments, like the iconic goal call by the Spanish commentator, prompted 37% greater emotional intensity, keeping fans' eyes fixed on their screens.

• Latinas Are Watching and Bringing Their Kids: Hispanic women are an untapped opportunity among soccer viewers. Four in ten (41%) U.S. Latinas say they are likely to watch the FIFA World Cup 2022™, and 76% of Hispanic moms encourage their kids to follow the World Cup and professional fútbol. Soccer has become the fastest-growing major team sport among all high school students and is the most popular among Hispanic high schoolers.
• FIFA World Cup 2026TM North American Tour: A staggering 80% of Latino World Cup viewers and 75% of non-Latinos say it is important that the World Cup returns to U.S. soil in 2026, when they may have the opportunity to attend in person. The event represents soccer's next economic boom, positioning the U.S. for breakout fútbol growth.
Global and inclusive, growing across women and youth, fútbol is poised to take America by storm. After years of wins, both large and small, fútbol is coming of age at the moment when millions of Latinos and fútbol fans of all backgrounds stand ready to watch, engage and lead the way.
We’re here to focus health care where it belongs: on you.
You deserve the kind of care that goes beyond a chart or a prescription. It’s the kind of care that covers everything you need to live your healthiest life, including support from a whole team of doctors, nurses, and specialists to keep you feeling good. And it’s care that gives you all the benefits of a nationally recognized health care company—including the latest science and technology—with a hometown, personal touch.
Count on all of us to care for all of you, in all the ways you need.
optumcare.com/AZ

• PERCENTAGE OF CHILDREN LIVING IN POVERTY (2019)
• ARIZONA POVERTY
• ARIZONA’S VETERANS
• ARIZONANS WITH DISABILITIES
• ARIZONA HOUSEHOLDS
• MARITAL STATUS OF ARIZONA RESIDENTS
•
ARIZONA RANKS POORLY ON AIR POLLUTION AND SEVERE HOUSING PROBLEMS
• ARIZONA CHILDREN RANK POORLY FOR PHYSICAL ACTIVITY AND FOOD SUFFICIENCY BUT GOOD FOR LOW TOBACCO/ALCOHOL USE
•
BROADBAND INTERNET ACCESS: ARIZONA VS. UNITED STATES (2020)
BRINGING THE BLUE ZONES APPROACH TO SOUTH PHOENIX RESIDENTS
BY TOMÁS LEÓNPERCENTAGE OF CHILDREN LIVING IN POVERTY BY RACE/ETHNICITY (2019)
Source: America’s Health Ranking, United Health Foundation, Children in Poverty (2021) www.americashealthrankings.org/explore/health-of-women-and-children/measure/ChildPoverty/state/AZ?edition-year=2021
Source: America’s Health Ranking, United Health Foundation, Children in Poverty (2021) https://www.americashealthrankings.org/explore/health-of-women-and-children/measure/ChildPoverty/state/AZ?edition-year=2021
AMERICAN INDIAN AN D ALASKAN NATIVE
OTHER
HISPANIC
B LACK
T WO OR MORE RACES
N ATIVE HAWAIIAN AND OTHER PACIFIC ISLA ND E R
A SIAN
WHITE
12.2% 11.5% 15.2% 15.5% 19.7% 19.2% 20.5% 31.5%
Source: United States Census Bureau, American Community Survey, Poverty Status in the Past 12 Months (S1701), 2020 ACS 5-Year Estimates Subject Tables data.census.gov/cedsci/table?g=0400000US04&tid=ACSST5Y2020.S1701
Source: United States Census Bureau, American Community Survey, Poverty Status in the Past 12 Months (S1701), 2020 ACS 5-Year Estimates Subject Tables https://data.census.gov/cedsci/table?g=0400000US04&tid=ACSST5Y2020.S1701
313,455
ARIZONA
BY TYPE
892,070
M A L E HOUSEHOLD, N O SPOUSE FE MALE HOUSEHOLD, NO SPOUSE N ONFAMILY HO U S EHOLD
MARITAL STATUS OF ARIZONA RESIDENTS
BY RACE
MA
OF


13.1% 13.5% 9.0%
1.5% 2.3% 2.4%
STATUS 6% 3.8% 5.3%
6.2% 9.2% 8.8% 9.6%
29.7% 48.4% 53.9% 29.9% 43.5% 42.8% 43.3% WHITE BLACK OR AFRICAN AMERICAN ASIAN SOME OTHER RACE HISPANIC MARRIED
1.2% 1.6% 2.6% 2.5%
ARIZONA 4.4% 3.8% 3.4% 3.3%
A M E R I CAN INDIAN A ND ALASKA NATIVE WIDOWED DIVORCED
NATIVE HAWAIIAN AND OTHER PACIFIC IS LANDER S EPARATED NEVER MARRIED Source: United States Census Bureau, American Community Survey, Marital Status (S1201), 2020 ACS 5-Year Estimates Subject Tables https://data.census.gov/cedsci/table?t=Marital%20Status%20and%20Marital%20History&g=0400000US04&tid=ACSST5Y2020.S1201
From there, Equality Health Foundation will work with Blue Zones and community partners to convene community stakeholders and build awareness and capacity to uncover solutions and support an evidence-based plan for change. The transformation plan is meant to drive widespread improvements in well-being, reductions in healthrelated costs and improve economic vitality in the region.
The sole focus of the Equality Health Foundation is to eliminate health disparities and improve the whole health of culturally diverse, underserved communities. In alignment with this mission, and in cooperation with Greater South Phoenix residents, community stakeholders and policymakers, we are partnering with Blue Zones Activate to help the region achieve its highest potential to be a healthy place to live, work, learn, play, pray and thrive.
Blue Zones Activate, which covers nine zip codes in Greater South Phoenix that includes 240,000+ residents and a high percentage of Hispanics, focuses on the single largest determinant of health: the places where we live. This comprehensive place-based approach has the potential to boost the well-being of the entire South Phoenix region and reduce health disparities that impact the quality and longevity of life and community resilience for current and future generations.
The Blue Zones team is made up of global leaders from several sectors: health equity, food systems, workforce development, built environment and happiness. These leaders have begun to work with local leaders and organizations to asset-map the strengths, needs and challenges that Greater South Phoenix residents face today.
The needs, desires and readiness of the community will determine the next phase: a Phase II or a Phase III path to improve the wellbeing of the region. Phase II of Blue Zones Activate focuses on policy improvement as the most powerful, cost-effective lever to improve the health of a region. Phase III is a Blue Zones Project called the full Life Radius Model, which focuses on people, places and policy.
Equality Health Foundation addresses social determinants of health as part of our core mission to level the health care playing field through the lens of culture. The Foundation is using the Blue Zones model, which emphasizes the importance of focusing on environmental and systems-level influencers to improve health outcomes, to tackle systems and policies that have caused generational harm. Research shows that a person’s environment is a key determinant for many aspects of health. This is powerfully illustrated by the fact that a zip code is a strong predictor of life expectancy, exposing the immense health disparities that persist across communities and the country. Consider this alarming fact: Prior to the pandemic, the life expectancy of a South Phoenix resident was 14 years less than that of a North Scottsdale resident. With Black and Hispanic residents experiencing an additional three-year loss due the impact of COVID-19, the total life expectancy disparity now has increased to 17 years, a nearly twogeneration gap.
Backed by research on the original Blue Zones, those rare longevity hotspots where people thrive well into their 100s, Blue Zones Activate helps communities through a well-being transformation
BRINGING THE BLUE ZONES APPROACH TO SOUTH PHOENIX RESIDENTS
CONSIDER THIS ALARMING FACT PRIOR TO THE PANDEMIC
THE LIFE EXPECTANCY OF A SOUTH PHOENIX RESIDENT WAS14 YEARS LESS THAN THAT OF A NORTH SCOTTSDALE RESIDENT.
WITH BLACK AND HISPANIC RESIDENTS EXPERIENCING AN ADDITIONAL THREE-YEAR LOSS [FROM] COVID-19, THE TOTAL LIFE EXPECTANCY DISPARITY NOW HAS INCREASED TO 17 YEARS, A NEARLY TWO-GENERATION GAP.
by improving their man-made surroundings so that healthy choices become easy choices. With almost all Americans spending 90% of their lives within just 20 miles of their homes, making changes to the local environment and systems where people live, work and play leads to improved well-being, lower health care costs and a vitalized economy.
Blue Zones is unique because it takes a systems approach to improving whole community well-being through policy, programs, building design and social networks. At its core, it focuses on the built environment and food policy landscapes—and shaping policy in these areas has proven among the most effective ways to reduce chronic disease and drive positive health outcomes for entire communities.
Following the COVID-19 pandemic, underlying disparities and inequalities in the communities of Greater South Phoenix emerged in shockingly unprecedented forms. As mentioned earlier, there is
a tremendous disparity in life expectancy between areas like South Phoenix and North Scottsdale. This is a huge problem that the Equality Health Foundation intends to address head on, in lockstep with community members and partners.
The areas where a Blue Zones approach can be a catalyst for measurable positive change in community competency, assets and passion include:
• access to quality health care,
• workforce opportunities,
• education pathways,
• affordable housing,
• food justice and
• mental health.
While disparities in these areas have negatively affected Greater South Phoenix residents for decades, equitable access to whole community well-being has the power to dramatically transform lives
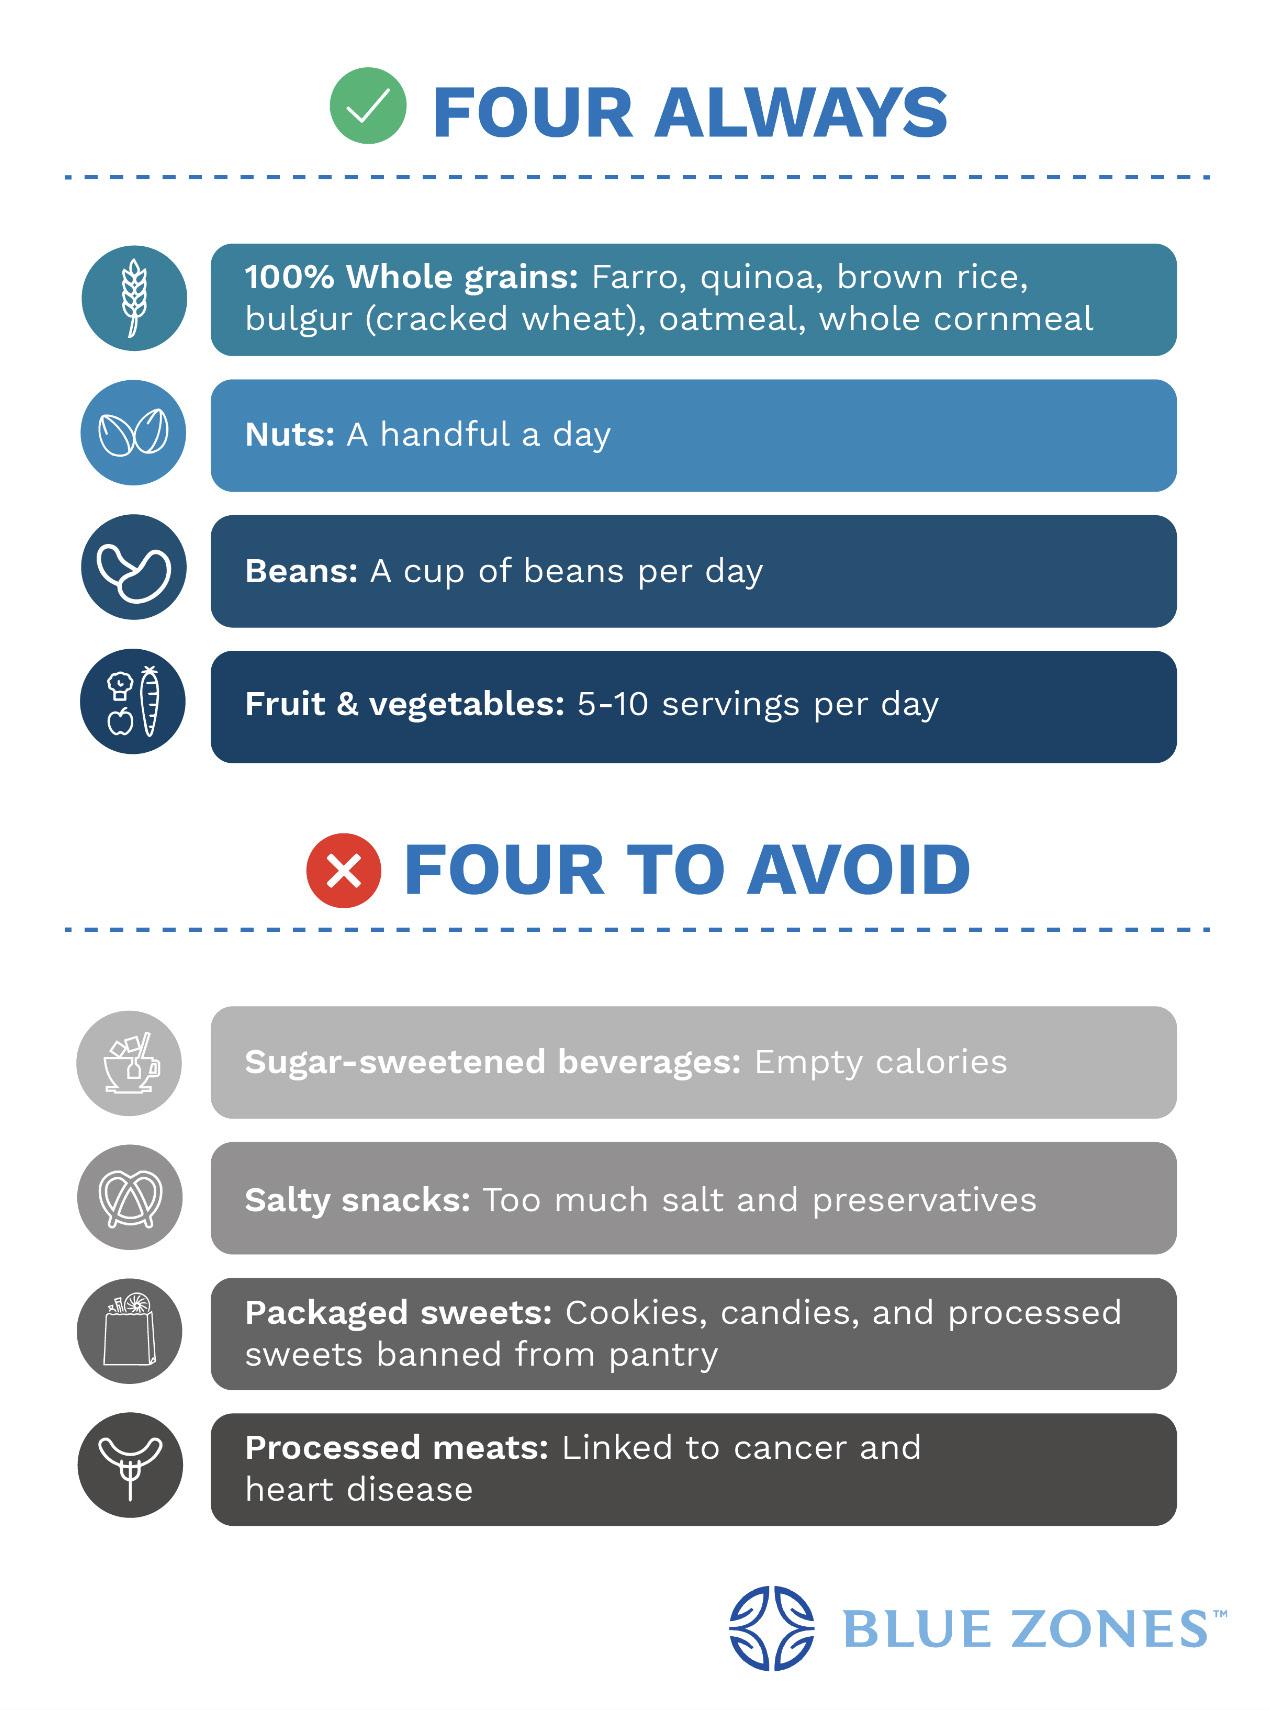
for generations to come. Equality Health Foundation knows that it will take many dedicated champions and supporters to embark on such a bold and mighty journey. It is a journey that will begin with trust: trust placed in others and trust earned from the almost quarter-of-amillion lives we aim to serve in Greater South Phoenix.
A practice in Okinawa, Japan, one of the original Blue Zones, comes to mind here. A “moai”in its simplest form, is a group of lifelong friends who come together to pool resources, meet for a common purpose and provide support in areas including social, financial, health and even spiritual interests. The idea that knowing there is a safety net of deep support and respect for one another is exactly the spirit in which Equality Health Foundation, supporters and champions of the Blue Zones Activate initiative, and the Blue Zones team intend to encourage: a desert moai that will transform family trees, ignite generational wealth and restore faith in community and access to opportunity.
The coronavirus has taken a tremendous toll on the entire world, and few were spared its wrath. Without question, traditionally diverse and underserved communities were disproportionately affected by the COVID-19 pandemic, and that damage also will take a disproportionate toll on recovery—but the communities of Greater South Phoenix will recover.
Equality Health Foundation believes the time is now to convene and focus on healing and building resiliency throughout the region alongside community members who are poised to sustain it. When we contemplate longevity, even a 100+ year lifespan, we must start with quality of life. Well-being and longevity are inextricably tied to each of the sectors mentioned earlier: health equity, food systems, workforce development, built environment and happiness. This is exactly why the Blue Zones Activate Greater South Phoenix initiative is even more timely—and more necessary—that ever before.
EQUALITY
Renaissance Square, Tower One 2 North Central Ave., Suite 475 Phoenix, AZ 85004 858.999.5190 www.equalityhealthfoundation.org BLUE
Here for small business. high school sports. local elections. big wins... and small ones too. the Valley.
• PROFILE OF UNAUTHORIZED POPULATION IN ARIZONA
• IMMIGRANT CONTRIBUTION TO ARIZONA
• ENGLISH IS THE DOMINANT LANGUAGE SPOKEN IN ARIZONA
• ARIZONA RANKS IN THE TOP 10 STATES WITH MOST ACTIVE DACA RECIPIENTS
• NATURALIZED PERSONS
• PERSONS OBTAINING LAWFUL PERMANENT RESIDENT STATUS 2015–2020
• IMMIGRANT ORPHANS ADOPTED BY U.S. CITIZENS
• SEXUAL ORIENTATION IS THE TOP REASON LATINX LGBTQ STUDENTS ARE VICTIMIZED
• HOW VICTIMIZATION AFFECTS LATINX LGBTQ STUDENTS
• MAJORITY OF LATINX LGBTQ STUDENTS DON'T REPORT HARASSMENT OR ASSAULTS
THEME PARKS & ENTERTAINMENT
This Univision Communications report focuses on how Hispanics in the Phoenix and Tucson markets engage with theme parks and other forms of entertainment such as concerts and sporting events
The Afro-Latina founder of the fashion community Mujeres of All Shades wants women of all cultures, ages, body types and shades to come together but embrace their individuality
The Sagrado, the only arts space and gallery in South Phoenix, is bringing the community together through art
THE LATINO CONTRIBUTION TO ARIZONA
BY DAVID CASTROCount on Us, which launched first in Phoenix, is telling compelling stories of how hardworking Latinos make a difference in their communities every day
This Nielsen report tells the truth about connecting with U.S. Latinos, whose lived experiences are extremely diverse
NOTE: THIS INFORMATION IS FROM THE MIGRATION POLICY INSTITUTE (MPI) 2019 ANALYSIS OF U.S. CENSUS BUREAU DATA FROM THE POOLED 2015–2019 AMERICAN COMMUNITY SURVEY (ACS) AND THE 2008 SURVEY OF INCOME AND PROGRAM PARTICIPATION (SIPP), WEIGHTED TO 2019 UNAUTHORIZED IMMIGRANT POPULATION ESTIMATES PROVIDED BY JENNIFER VAN HOOK OF PENNSYLVANIA STATE UNIVERSITY.
Source: Migration Policy Institute, Profile of the Unauthorized Population: Arizona, 2019 www.migrationpolicy.org/data/unauthorized-immigrant-population/state/AZ
2% 2% 3%

20%

Source: U.S. Census Bureau, American Community Survey, Language Spoken at Home (S1601), 2020 data.census.gov/cedsci/table?g=0400000US04&tid=ACSST5Y2020.S1601 worldpopulationreview.com/states/arizona-population
73%

Source: U.S. Census Bureau, American Community Survey, Language Spoken at Home (S1601), 2020 https://data.census.gov/cedsci/table?g=0400000US04&tid=ACSST5Y2020.S1601


ONLY ENGLISH SPANISH
OTHER INDO - EUROPEAN LANGUAGES
ASIAN AND PACIFIC ISLAND LANGUAGES
OTHER LANGUAGES
ARIZONA RANKS IN THE TOP 10 STATES WITH MOST ACTIVE DACA RECIPIENTS
101,350
174,680
33,740
27,550
20,380 23,790 23,800 24,530
16,220
16,020
DACA DEFINITION: THE DEFERRED ACTION FOR CHILDHOOD ARRIVALS (DACA) PROGRAM GIVES ALMOST 800,000 YOUNG UNDOCUMENTED IMMIGRANTS, WHO CAME TO AMERICA AS CHILDREN, HAVE LIVED HERE SINCE AT LEAST 2007 AND MET OTHER REQUIREMENTS, THE RIGHT TO TEMPORARY PROTECTION FROM DEPORTATION AND LEGAL WORK AUTHORIZATION FOR A RENEWABLE PERIOD OF TWO YEARS.
Source: MPI analysis of U.S. Census Bureau data from the 2019 American Community Survey (ACS) and the 2008 Survey of Income and Program Participation (SIPP), drawing on a methodology developed in consultation with James Bachmeier of Temple University and Jennifer Van Hook of The Pennsylvania State University, Population Research Institute www.migrationpolicy.org/data/unauthorized-immigrant-population/state/US
DACA Definition: The Deferred Action for Childhood Arrivals (DACA) program gives almost 800,000 young undocumented immigrants, who came to America as children, have lived here since at least 2007 and met other requirements, the right to temporary protection from deportation and legal work authorization for a renewable period of two years.
Source: U.S. Citizenship and Immigration Services (USCIS), “Count of Active DACA Recipients by Month of Current DACA Expiration as of December 31, 2021" www.uscis.gov/sites/default/files/document/reports/Active_DACA_Recipients_December_31_2021.pdf
Source: MPI analysis of U.S. Census Bureau data from the 2019 American Community Survey (ACS) and the 2008 Survey of Income and Program Participation (SIPP), drawing on a methodology developed in consultation with James Bachmeier of Temple University and Jennifer Van Hook of The Pennsylvania State University, Population Research Institute; U.S. Citizenship and Immigration Services (USCIS), “Count of Active DACA Recipients by Month of Current DACA Expiration as of December 31, 2021," www.uscis.gov/sites/default/files/document/reports/Active_DACA_Recipients_December_31_2021.pdf.


LOWER THAN AVERAGE LEVELS OF VICTIMIZATION
HIGHER THAN AVERAGE LEVES OF VICTIMIZATION


Source: GLSEN, the Hispanic Federation and UnidosUS, "Erasure and Resilience: The Experiences of LGBTQ Students of Color – Latinx LGBTQ Youth in U.S. schools," Adrian D. Zongrone, Nhan L. Truong and Joseph G. Kosciw (2020) www.glsen.org/sites/default/files/2020-06/Erasure-and-Resilience-Latinx-2020.pdf
Source: GLSEN, the Hispanic Federation, & UnidosUS, "Erasure and Resilience: The Experiences of LGBTQ Students of Color, Latinx LGBTQ youth in U.S. schools," by Adrian D. Zongrone, Nhan L. Truong and Joseph G. Kosciw (2020) https://www.glsen.org/sites/default/files/2020-06/Erasure-and-Resilience-Latinx-2020.pdf


 BY GRACIELA MARTINEZ
Arizona is one of the top five states with the most Hispanics, yet there is an underrepresentation of Afro-Latinos, an observation Franchela Ulises made when she first moved to Phoenix in 2011 to attend the University of Phoenix, where she earned a bachelor’s degree in criminal justice administration.
Ulises is an Afro-Latina who was born and raised in St. Thomas, U.S. Virgin Islands, by parents from the Dominican Republic. Growing up in the Caribbean, she was accustomed to interacting with people who looked like her. The sense of belonging she felt where she grew up immediately disappeared when she moved to Phoenix.
Ulises says she felt “like a fish out of water,” and became overwhelmed by the stares and questions she received from surprised strangers—multiple times a day—who asked, “Did you just say that in Spanish?” Her first reaction to their curiosity: “Okay, something is wrong here,” she says.
Ulises grew up valuing female empowerment and embracing her Latino background; however, her interaction with Hispanic Arizonans prompted her to start a movement and organization to educate Latinos about Afro-Latinos and empower women of all backgrounds. This is how Mujeres of All Shades (MOAS) was born.
MOAS is a fashion community that hosts workshops, styling services and community networking events, just to name a few of its offerings. Women of all cultures, ages, body types and shades are encouraged to join. There is an emphasis on “shade” because it represents individuality, and Ulises wants women to embrace who they are and learn to love themselves.
Before launching this brand on June 26, 2021, Ulises first had to overcome her fears.
“I didn’t want to be just another community,” she says. “I wanted to have a purpose, I wanted to have meaning—and it was scary for me to [envision] how I was going be accepted [by the local Hispanic community].”
Despite many challenges, she persisted—and acknowledged the importance of showing up to community events because representation matters. This approach allowed her to gain exposure and network as a model, stylist and businesswoman.
Ulises attributes her success to her team, a small group of four hard-working women who share ideas and feedback with her.
“I’m always trying my best to make sure that everyone is included as much as I can,” Ulises says, “because I can’t make Mujeres [alone]. I’m just one woman. Mujeres—and all the girls who are a part of it—are my team.”
It has been just a little more than one year since she founded Mujeres of All Shades, and Ulises is surprised and thankful for the interest she has received from the community. Telemundo’s Al Rojo Vivo and ABC15 in Phoenix are two of the media outlets that have interviewed her. This type of publicity was not what she expected; her initial plan was to establish a presence in Arizona through workshops and community events.
Since starting MOAS, she has done workshops at schools such as Maryvale High School in Phoenix, where she spoke to a class about her organization and diversity within the fashion community. She also hosted a workshop with older businesswomen to build their confidence while also providing them with headshots and an opportunity to become comfortable in front of a camera.
A long-term goal for Mujeres of All Shades is to become the largest worldwide community for women. Ulises would love to host seminars and public speaking events around the U.S. that feature panels of women from different countries who share their experiences. She wants to provide a nurturing space for all women and unite them.
“There is so much space for all of us,” she says. “We just have to remember that we are not in competition, we are allies.”
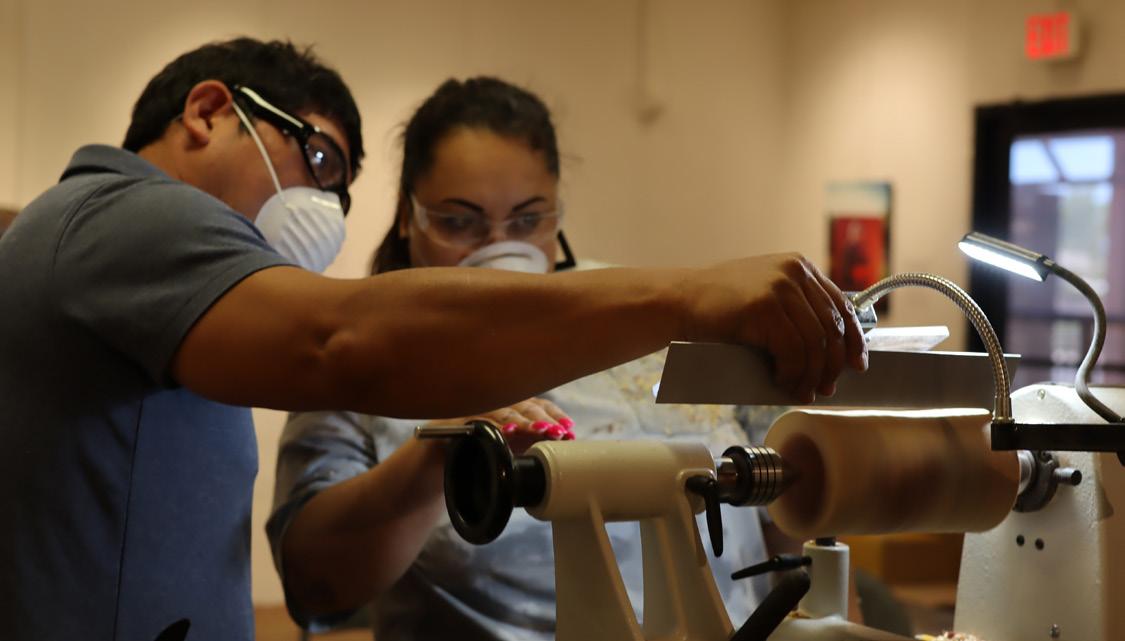
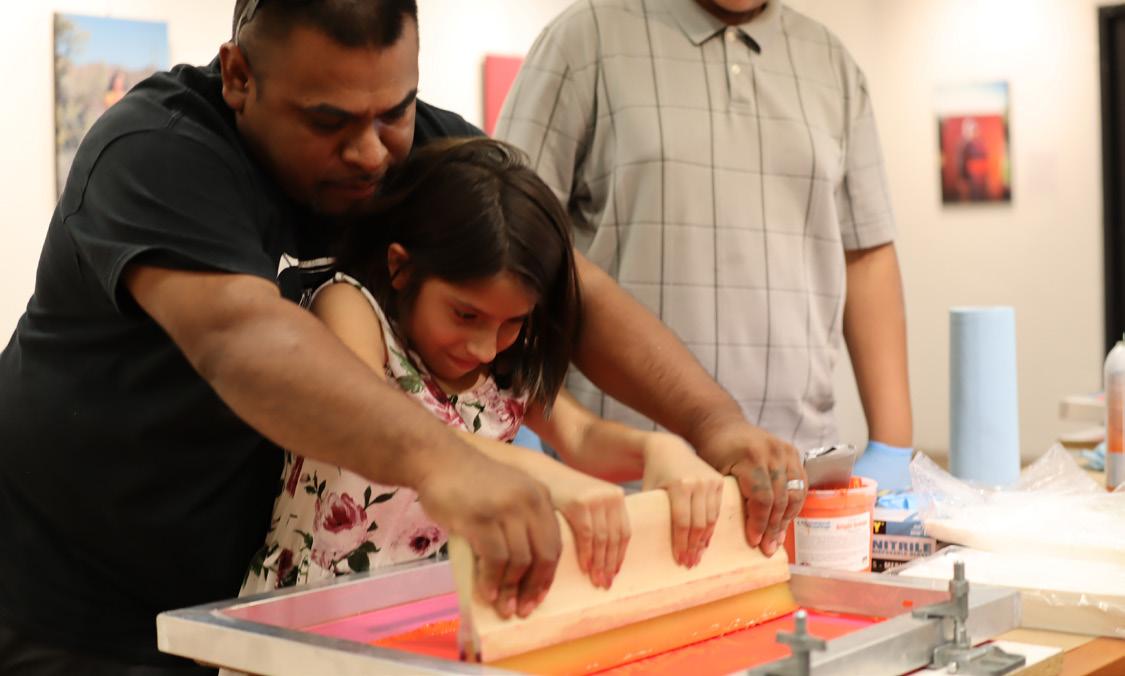 BY LAUREN KENNEDY
The Sagrado was established in 2016 as a response to the lack of commitment to the community, arts and culture in South Phoenix by the city of Phoenix. With a mission to provide the tools and opportunities that empower the community through art, culture and design, we stand as the only community arts space and gallery in South Phoenix.
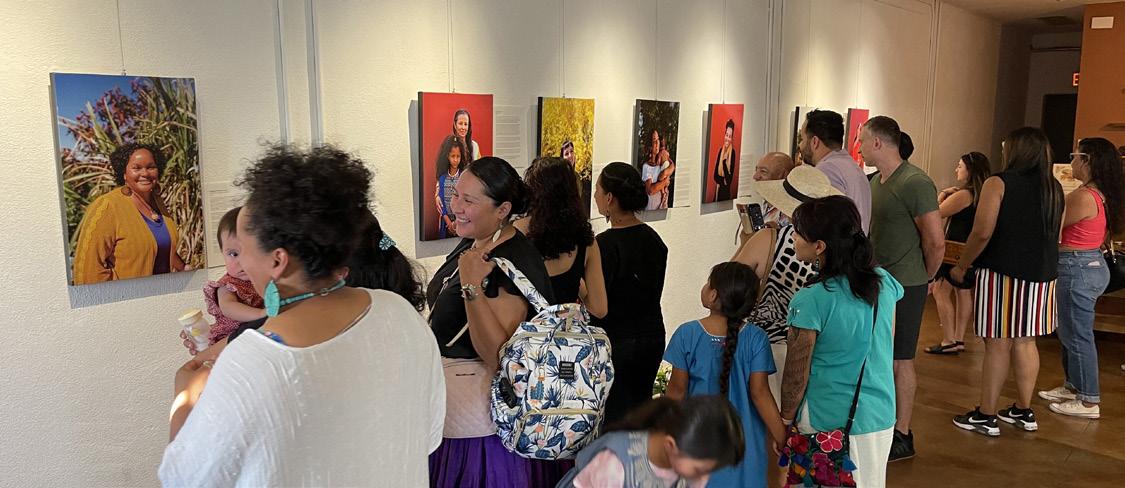
In our first five years, the Sagrado has made significant progress implementing our vision to cultivate a prosperous community rooted in arts and culture while engaged in conscious development during the challenges of a global pandemic. We have built a reputation for nurturing our community’s cultural identity and serving as a cultural bridge for the Valley. We have been recognized as Phoenix’s Best Community Arts Space (2019) and Best Latino Art Gallery (2021) by Phoenix New Times. Through our art shows, workshops, public events and design advocacy, the Sagrado has impacted the lives of more than 10,000 community members in South Phoenix and beyond.
• The Sagrado Galleria reopened to the public with an artisan boutique, tea offerings and an adobe meditation space built by community members with our Design Empowerment PHX initiative in the backyard.
• The Sagrado’s Design Empowerment PHX team works with the city of Phoenix and T.Y. Lin International to engage South Phoenix residents and stakeholders to create an aesthetic design for the Third Street Pedestrian/ Bicycle Bridge crossing the Rio Salado.
• The 5th Forever Rising Young Artists Showcase activates Circle K Park in collaboration with Council District 8, Phoenix Parks & Recreation, and other community partners to advocate for a South Central skatepark.
• A custom shipping container designed by the Sagrado Executive Director Sam Gomez, in collaboration with
Moreno Welding, is installed in front of the Sagrado Galleria to incubate affordable retail space for local artists.
• The 6th Annual Mujeres del Desierto art show and gathering brings a record 300+ diverse guests to the Audubon Center to honor women of the Southwest.
• The Sagrado partners with Southwest Behavioral & Health Services to regularly bring free healing arts that include sound healing, yoga, spiritual painting, and wellness pláticas with local curanderosto South Phoenix residents.

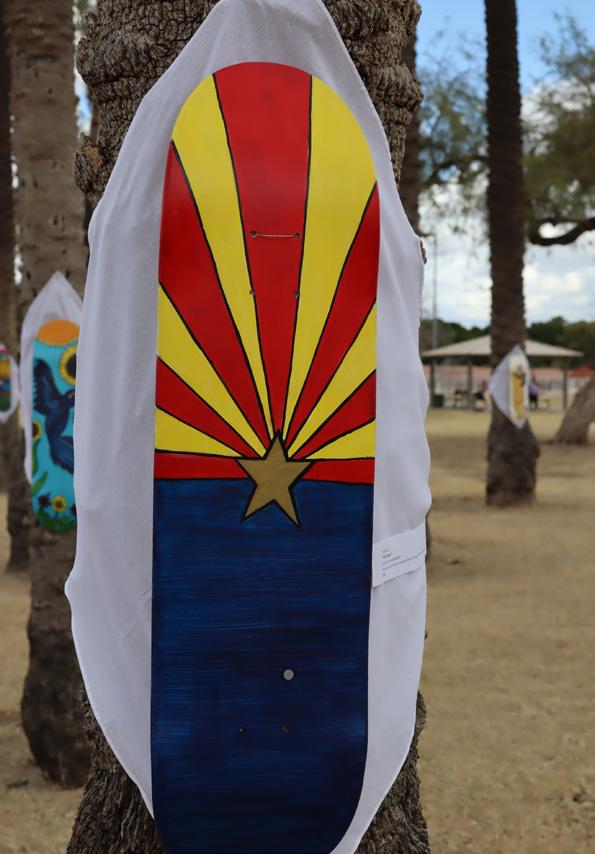
• The Sagrado partners with the Phoenix Art Museum to enhance the Desert Rider exhibition by bringing culturally relevant screen printing with local artists into the museum for the first time in history, increasing museum access to South Phoenix families and youth while also introducing diverse Valley residents to a new artistic process.
• The Sagrado facilitates a series of youth art workshops including screen printing, wood working and photography, providing free arts learning for South Phoenix youth during summer break.
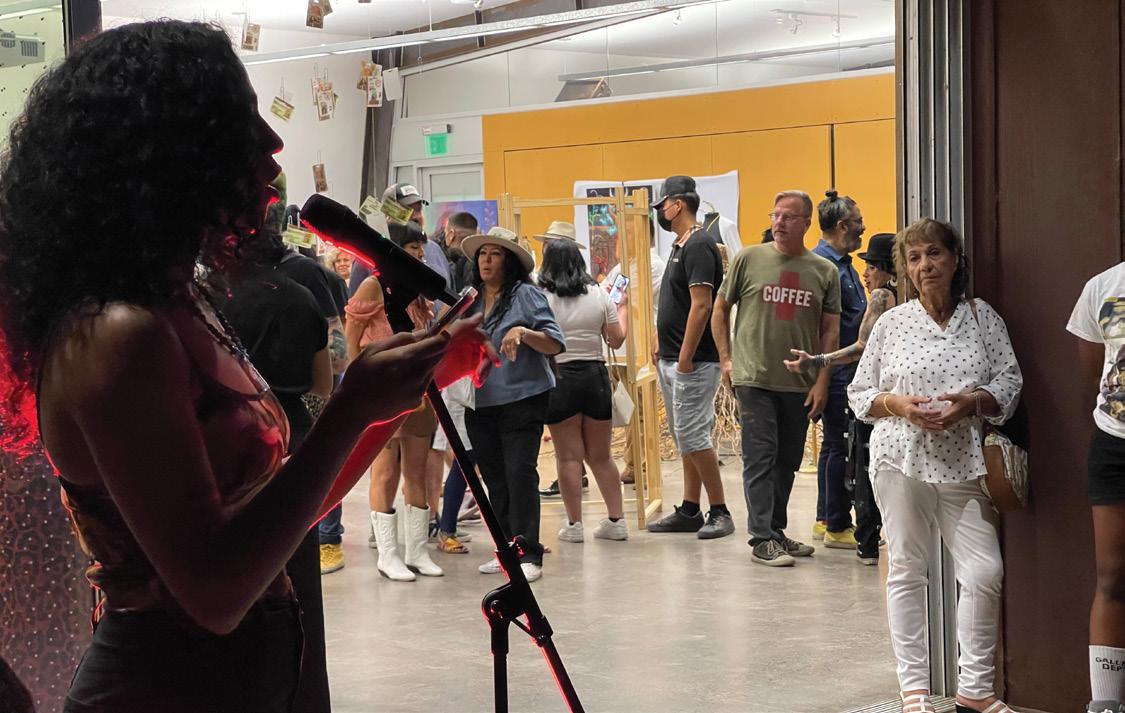
• The Sagrado celebrates the 6th annual MujeresdelDesiertoand Ancestral shows in addition to the 5th Forever Rising Young Artists Showcase.
• The Sagrado collaborates with the city of Phoenix, Council Districts 7 and 8, and leaders to advocate for communitydriven, sustainable development projects along the South Central Corridor.
As the Sagrado continues to cultivate community through art, culture and design, our team is actively working toward ownership of the Sagrado Galleria property and designing the Sagrado Futuro, a collaborative arts space equipped to support arts and design learning, creation, healing, entertainment and economic development through cultural identity.
LaurenKennedyistheprogramsdirectoroftheSagrado,aninterdisciplinary artist, a former public school art educator and a South Phoenix resident. She works alongside Samuel Gomez, the Sagrado's Executive Director, to advocate for equitable access to the healing power of art and quality, culturally relevant design. By engaging youth and families in diverse, purposeful, creative experiences with local artists and healers in both Spanish and English, Lauren helps expand opportunities for South Phoenix residentstotransformthemselves andtheircommunityfromwithin.
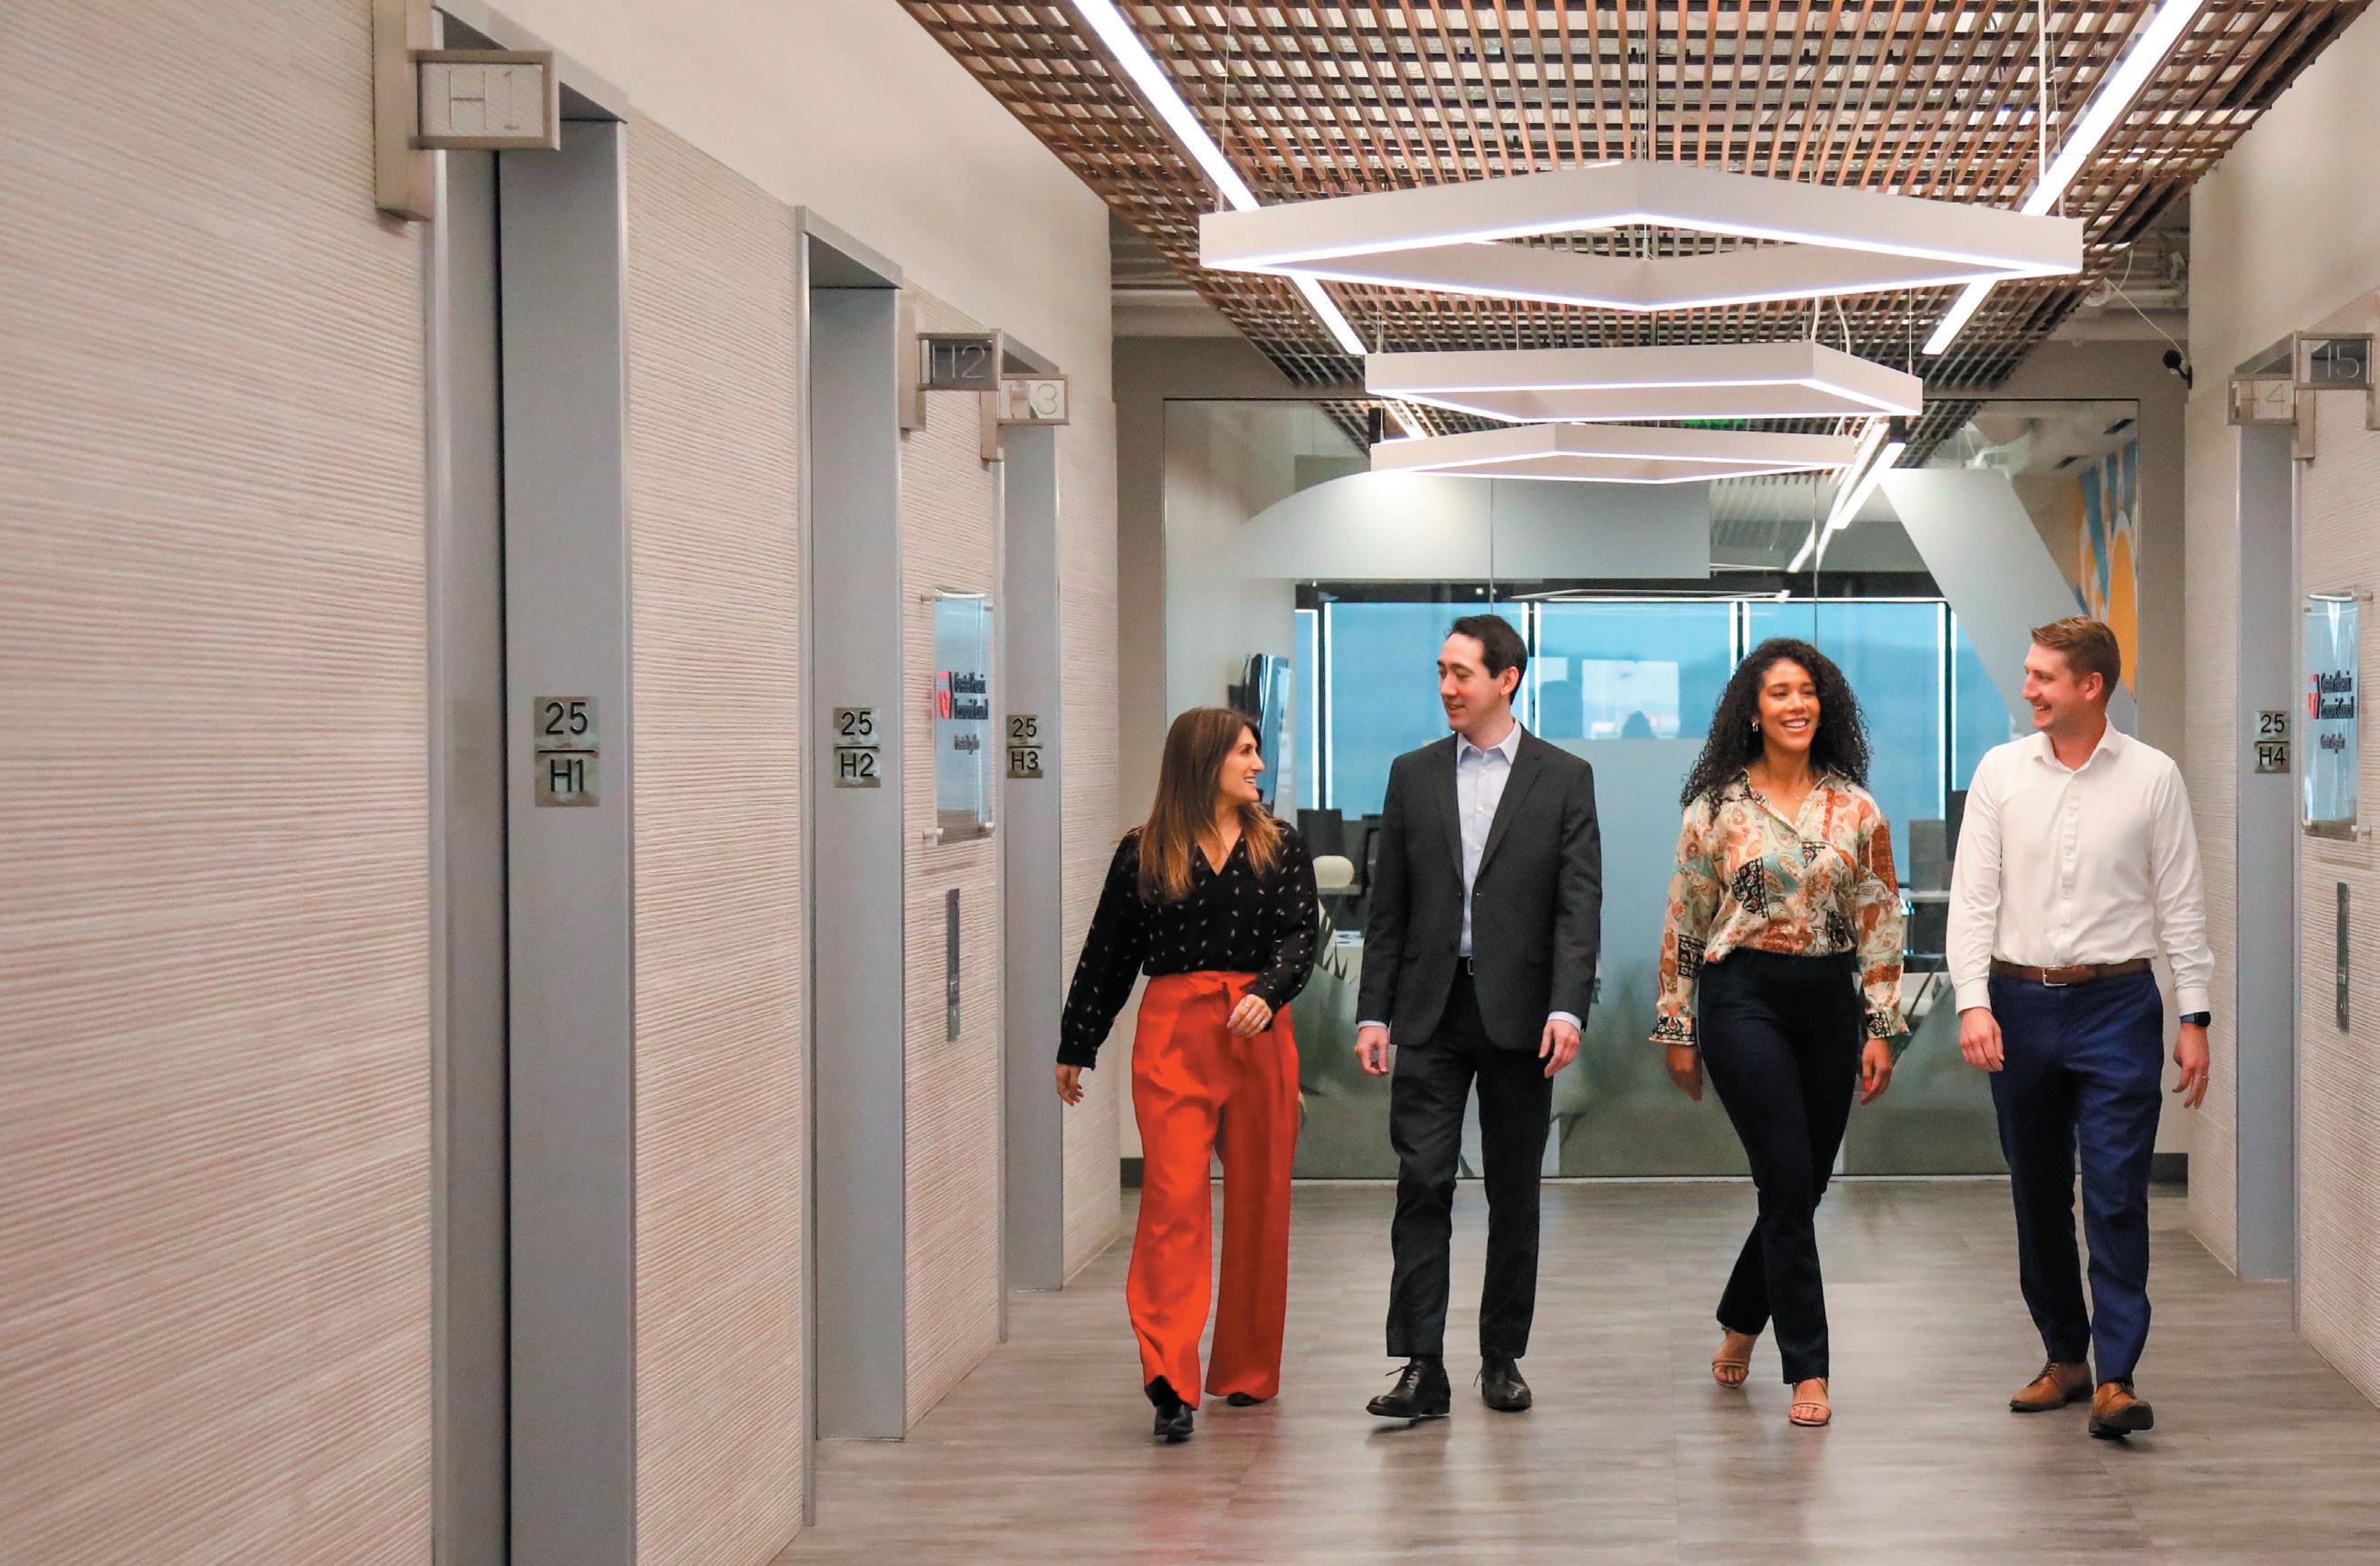
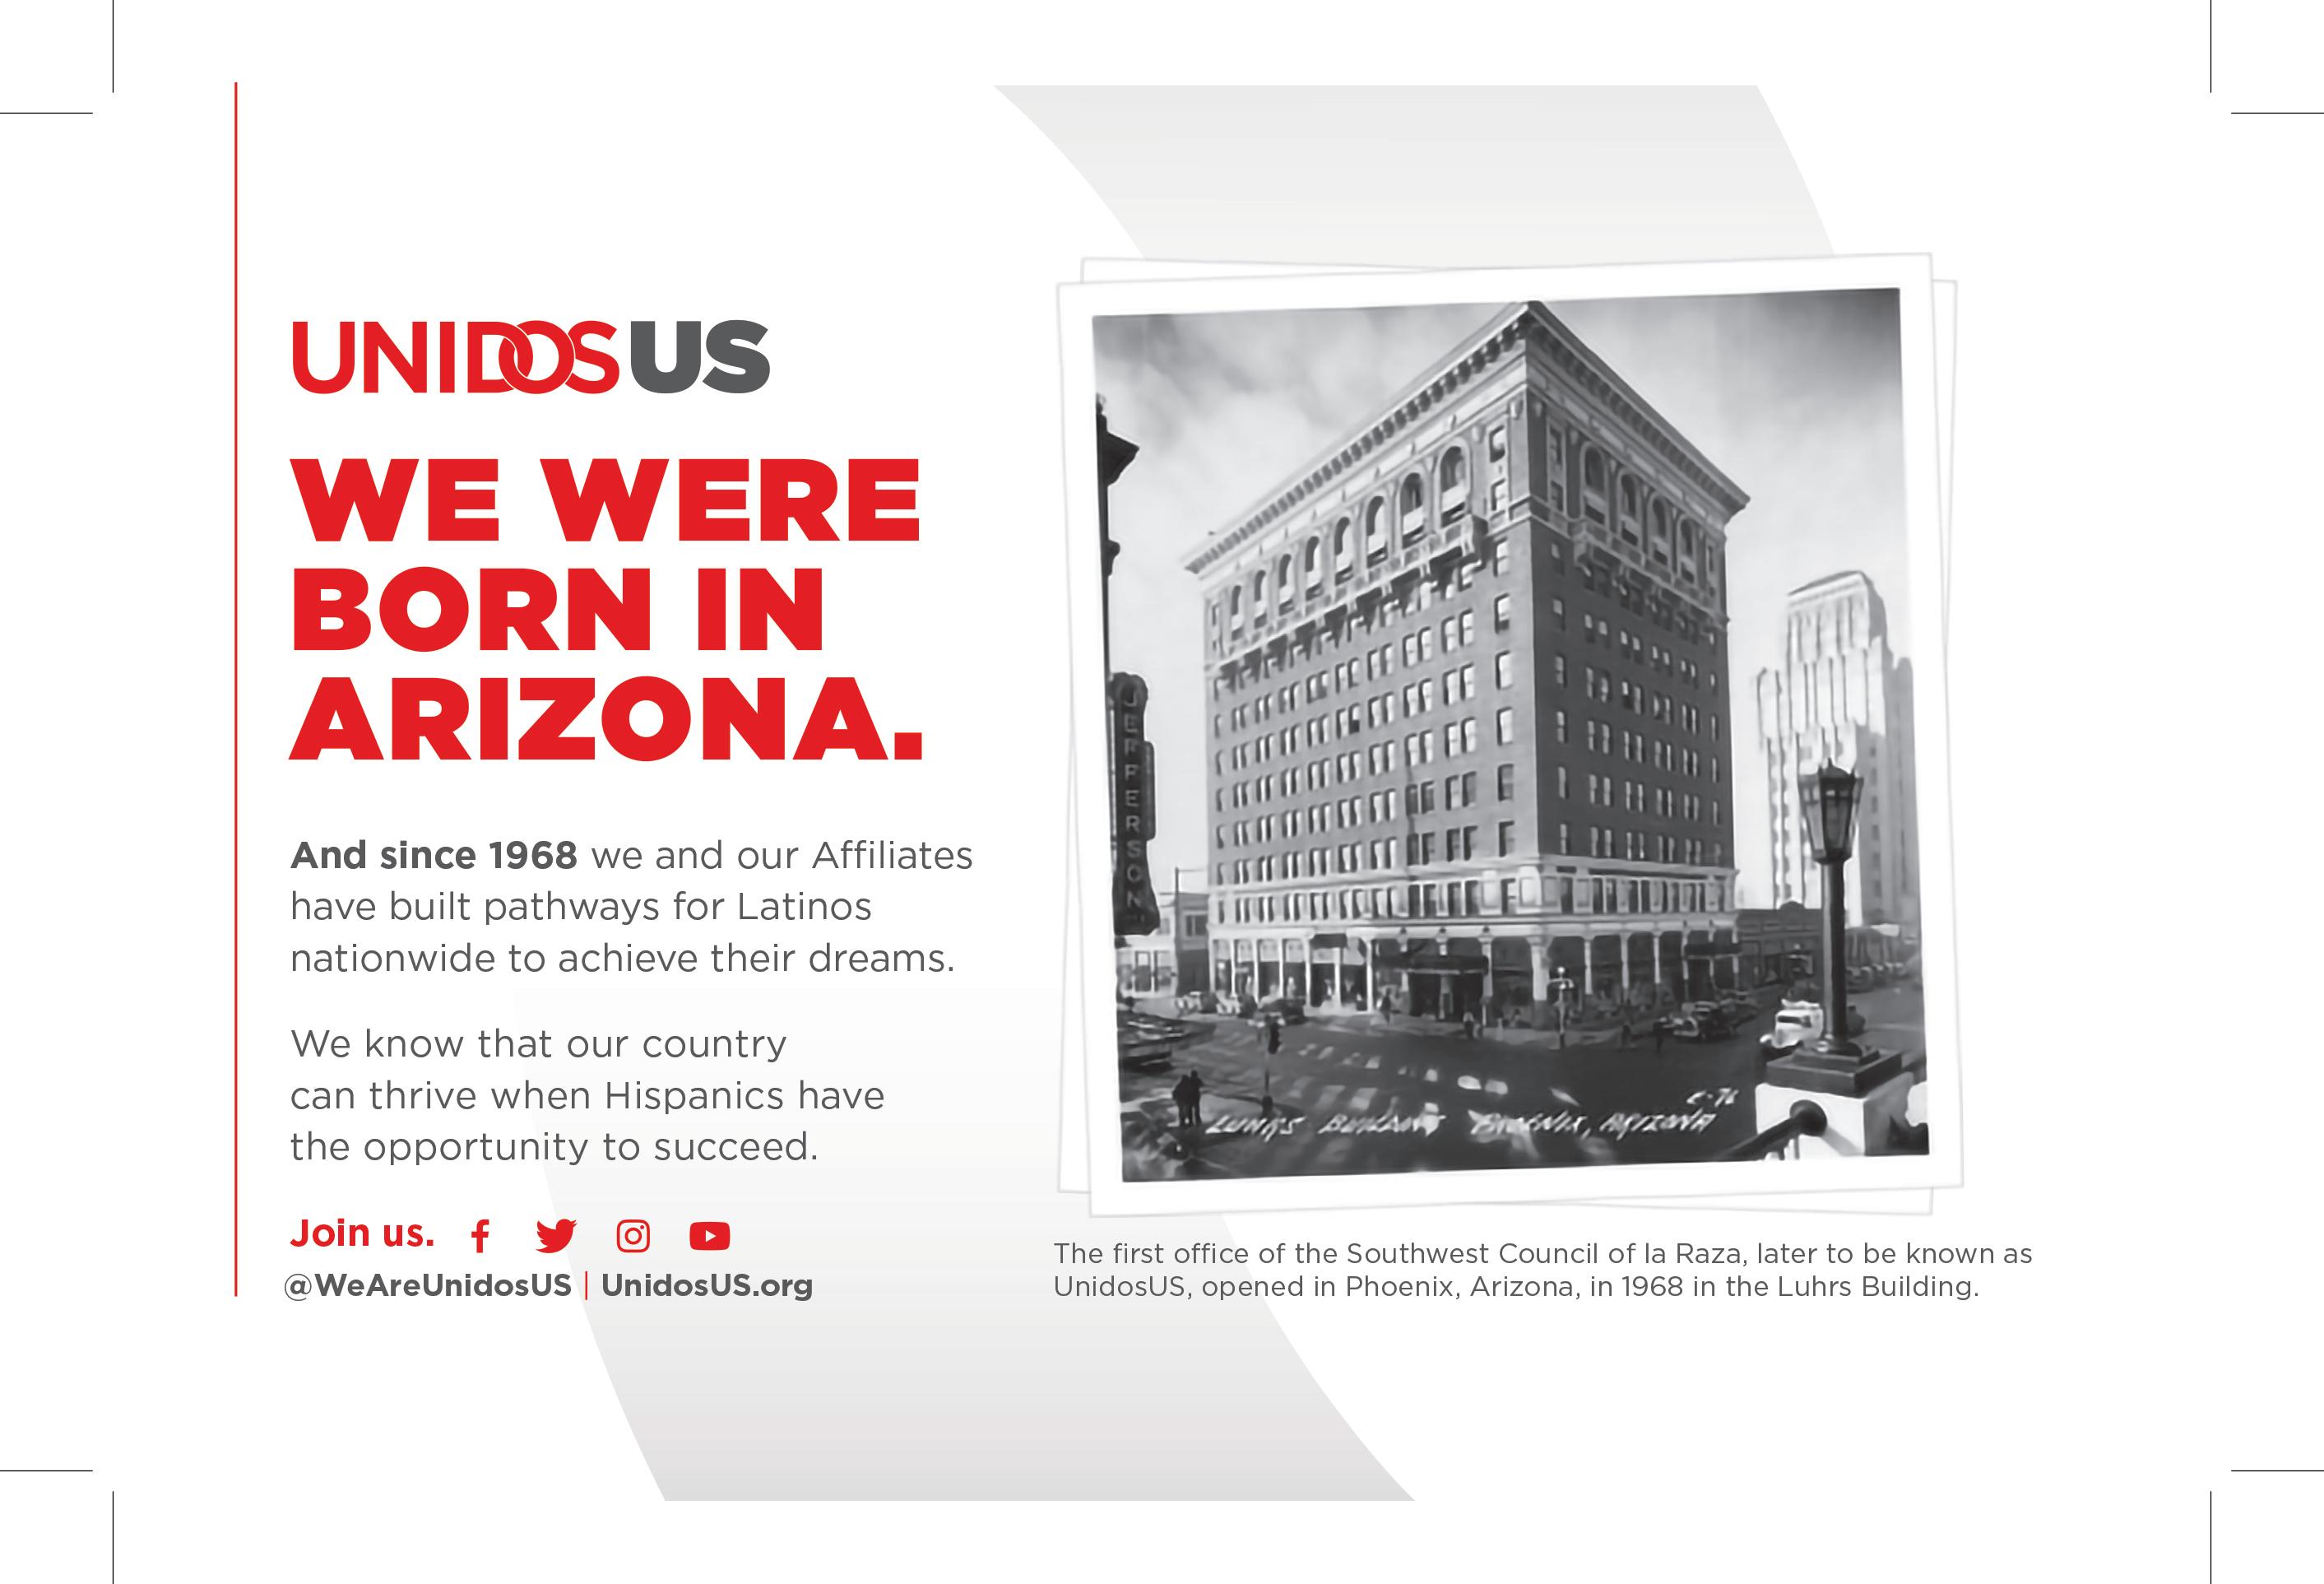 BY DAVID CASTRO
As evidenced throughout this 2022 issue of DATOS, the Latino community in Arizona contributes to the local economy in so many important ways.
Here are just a few good examples:
• Latino-owned businesses employ nearly 1 million Arizonans, according to data from the U.S. Small Business Administration.
• Latino immigrants pay $2.4 billion in Arizona state taxes annually, according to data from the Arizona Hispanic Chamber of Commerce.
• Nationwide, 7 out of 10 Latinos work in health care, emergency services and other essential fields, according to the U.S. Bureau of Labor Statistics.
Unfortunately, many of our neighbors in Arizona and across the U.S. are unaware of all the different ways Latinos contribute to their communities—and how they’re making their communities, Arizona and the entire U.S. a better place for all of us to live.
That’s why UnidosUS, the nation’s largest Hispanic civil rights and advocacy organization—founded in Arizona in 1968—has launched Count On Us in Phoenix, a campaign to share the stories of hardworking Latinos who are making a difference every single day.
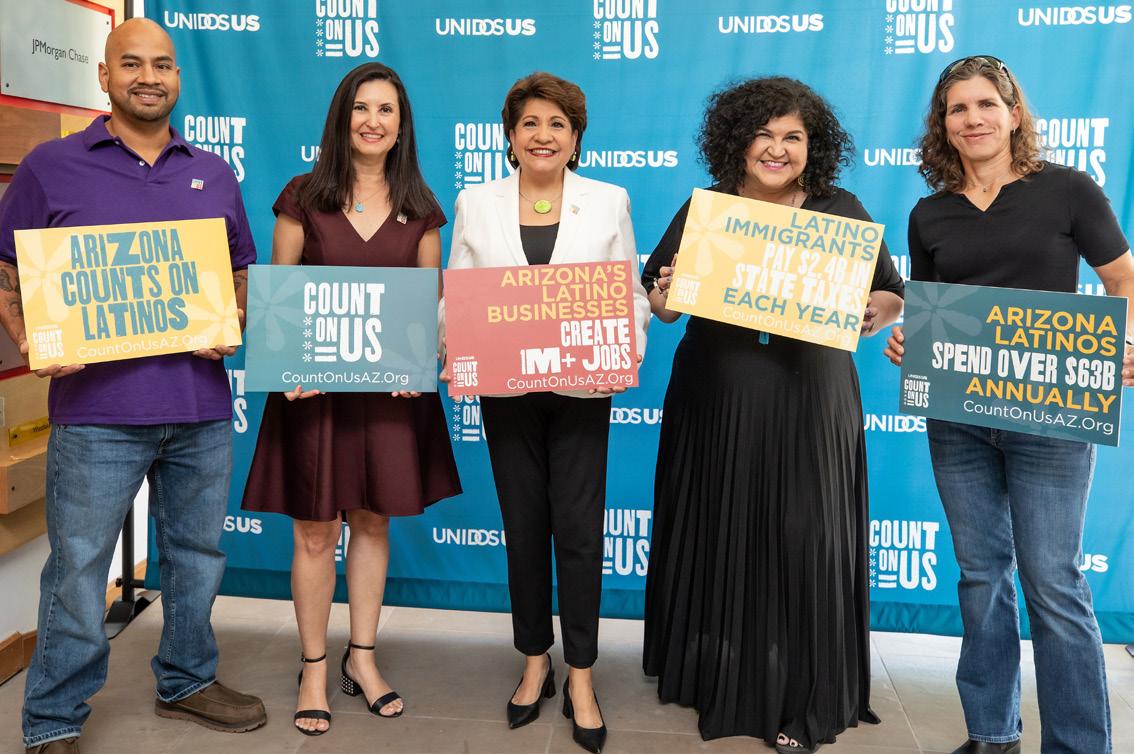
Count On Us shares the stories of real Phoenix residents—a firefighter, an educator, an artist, and local business owners— who are all proud Latinos working side-by-side with other Arizona residents to make the state and its economy stronger. The Arizona launch begins a national UnidosUS effort to raise awareness of our story.
“This campaign will open more people’s eyes to the real story about what the Hispanic community means to our nation and our future. We hope to inspire people from all backgrounds to join us in recognizing our community’s contributions and work with us to address challenges that can hold Latinos and Arizona back,” says Janet Murguía, president and CEO of UnidosUS.
U nidos US Headquarters
16th St. NW #600 Washington, DC 20036 202.785.1670 unidosus.org The Count on Us Toolkit
Friendly House 113 W. Sherman St. Phoenix, AZ 85003
602.257.1870
friendlyhouse.org
Hispanic Women’s Corporation
P.O. Box 20725 Phoenix, AZ 85036-0725
520.789.0724
hispanicwomen.org
Mexicayotl Academy 1300 S. Belvedere Ave. Tucson, AZ 85711
The campaign is informed by a national study of public perceptions of the Latino community. It’s also informed by social science data that shows that what we perceive and believe shape how we think and act.
Our research found a deep well of goodwill and warm feelings toward Latinos. At the same time, we also found a lack of awareness for the kinds of contributions Latinos make and the challenges we can face. We believe more people will step up to work alongside us when more people are aware of these realities.
This is exactly why stories and statistics and messages matter. They play a critical part in shaping the lens through which we see each other—and understand the world around us. Positive, uplifting stories will emphasize our shared aspirations and humanity and create common ground and strong communities. The wrong messages and factually inaccurate stories can easily create suspicion and division and tear our communities apart.
Arizona Hispanic Chamber of Commerce
E. Missouri Ave. Phoenix, AZ 85014
602.279.1800 or 602.279.8900
azhcc.com
Campesinos Sin Fronteras 663 E. Main St., Suite A Somerton, AZ 85350 928.627.5995
campesinossinfronteras.com
Chicanos Por La Causa 1112 E. Buckeye Rd. Phoenix, AZ 85034
602.257.0700
cplc.org
Comité De Bien Estar 963 B St. San Luis, AZ 85349
comiteaz.com
928.627.8559
520.615.2100
mexicayotlacademy.com
Mountain Park Health Center
635 E. Baseline Rd. Phoenix, AZ 85042
602.243.7277
mountainparkhealth.org
Promise Arizona 410 E. Southern Ave. Phoenix, AZ 85040
602.288.3663
promiseaz.org
Valle del Sol Administrative Office 3877 N. 7th St. Phoenix, AZ 85014
602.258.6797
602.523.9312 (Call Center) valledelsol.com
With our 11 Arizona affiliates and other community leaders we have worked together over the years to expand educational opportunities, register and mobilize people to vote, and expand tax credits that help hardworking families make ends meet.
Beyond the many, many contributions of the Hispanic community to Arizona and the nation, the campaign also calls attention to the barriers that stand in our way. If these barriers are removed, all Arizonans will thrive, not just Latinos.
Too many of us lack equal access to the opportunities and tools necessary to build good lives for ourselves and our families. Many jobs held by hardworking Hispanic men and women simply don’t pay enough to make ends meet. Many Latino essential workers don’t even have health insurance. Many public schools don’t offer options to Latino students to learn in both Spanish and English, which can improve their chances for success in school.
It is more urgent than ever to address and remove these kinds of barriers.
The most recent U.S. Census found Phoenix at the leading edge of a national trend: Latinos are now the largest demographic group in the Valley of the Sun. The work we do right here in Arizona sets an example for the whole country. It shows how we all benefit when
How can you help the Count On Us campaign? Here are three easy ways:
• Celebrate the contributions of Latinos and highlight the ways your organization is helping to remove barriers that hold Latinos back: Hold an event, write an op-ed in a local newspaper or magazine, or share an inspiring story in your community or corporate newsletter.
• Use your social networks to amplify the voices and stories of the Latinos who contribute positively to your life: the business owners, the health care professionals, the educators, the essential workers, the creators.
• Connect with UnidosUS and its Arizona affiliates (see More Info on p. 240) to learn how you can work together to address the barriers facing the Latino community and other Arizonans.
we work together to make sure everyone has the opportunities and tools to build a good life.
We are counting on our community leaders—our neighbors—to lend their voices and amplify the contributions of the Latino community.
David Castro is senior director of content development at UnidosUS, where he leads content strategy and production in the marketing and communications department. UnidosUS, previously the National Council of La Raza (NCLR), is the nation’s largest Hispanic civil rights andadvocacyorganization.ItisheadquarteredinWashington,D.C.,and has an affiliate network ofnearly300 community-based organizations across the United States and Puerto Rico.

6%
Racial and ethnic diversity within our country’s demography continues to increase. Between 2010 and 2020, the share of the non-Hispanic white population fell from 64% to 58%, the lowest on record, bringing America closer to a national multicultural majority. Today, America’s identity includes more cultures and voices than any time in our history, and Latinos are leading the way.
The diverse U.S. Hispanic population grew almost 25% between 2010 and 2020, swelling to 62 million. Today, Latinos make up almost 19% of the U.S. population but have contributed to more than half of the total population growth over the past 10 years. U.S. Latinos represent a diverse and intersectional community. There are more than 3.8 million Afro-Latinos in the U.S., representing 6.3% of all Latinos, and the Asian Latino population has increased by 28% since 2010, rising to 1.1 million representing 1.8% of Latinos.
MILLION AFRO-LATINOS IN THE U.S.
28% INCREASE IN THE ASIAN LATINO POPULATION SINCE 2010
27% OF LATINO HOUSEHOLDS ARE MULTIGENERATIONAL
14% ARE THREE-GENERATION HOUSEHOLDS
58% OF HISPANICS ARE UNDER THE AGE OF 34 VS. 39% OF NON-HISPANIC WHITES

• PAY EQUITY IN ARIZONA
• DISCRIMINATION CLAIMS IN THE UNITED STATES
• PHYSICAL/SEXUAL ASSAULTS ON ADULTS – LGBT VS. NON-LGBT
• ADULTS FACING DISCRIMINATION – LGBT VS. NON-LGBT
• NATIONAL WAGE DISPARITIES IN 2020
• U.S. INCARCERATION RATES
• HISPANICS OVERWHELMINGLY DOMINANT IN NUMBER OF CRIMINAL CONVICTIONS FY 2020
• VICTIMS OF VIOLENT CRIME IN 2019 AND 2020
• U.S. ADULTS ON PAROLE 2005 VS. 2020
A look at the different types of legal services used by Hispanics in the Phoenix and Tucson markets, courtesy of Univision Communications
This year’s midterm elections are quite possibly the most consequential in many years. Not only is Prop 308 on the ballot in Arizona, all 435 seats in the House of Representatives and 35 of the 100 seats in the Senate will be contested
Source: American Association of University Women (AAUW), The Fight for Pay Equity: A Federal Road Map (September 2020) https://ww3.aauw.org/aauw_check/pdf_download/show_pdf.php?file=Gender_Pay_Gap_Arizona
NOTE: INDIVIDUALS OFTEN FILE CHARGES CLAIMING MULTIPLE TYPES OF DISCRIMINATION; THEREFORE, EACH CATEGORY REPRESENTS THE PERCENTAGE FROM TOTAL CLAIMS AND THE SUM OF PERCENTAGES WILL BE GREATER THAN 100%.
Note: Individuals often file charges claiming multiple types of discrimination; therefore, each category represents the percentage from total claims and the sum of percentages will be greater than 100%.
Note: Individuals often file charges claiming multiple types of discrimination; therefore, each category represents the percentage from total claims and the sum of percentages will be greater than 100%.
Source: U.S. Equal Employment Opportunity Commission, "Charge Statistics (Charges filed with EEOC) FY 1997 Through 2021," 2021 https://www.eeoc.gov/statistics/charge-statistics-charges-filed-eeoc-fy-1997-through-fy-2021
Source: U.S. Equal Employment Opportunity Commission, "Charge Statistics (Charges filed with EEOC) FY 1997 Through 2021," 2021 www.eeoc.gov/statistics/charge-statistics-charges-filed-eeoc-fy-1997-through-fy-2021
Source: U.S. Equal Employment Opportunity Commission, "Charge Statistics (Charges filed with EEOC) FY 1997 Through 2021," 2021 https://www.eeoc.gov/statistics/charge-statistics-charges-filed-eeoc-fy-1997-through-fy-2021
NOTE: HISPANIC AND WHITE RATES: THE NUMBERS ABOVE THE LINES CORRESPOND TO WHITES (IN BLUE) AND THE NUMBERS BELOW CORRESPOND TO HISPANICS (IN RED).
RATE IS 134 AND WHITE RATE IS 133
Source: U.S. Department of Justice, Office of Justice Programs, Bureau of Justice Statistics, "Probation and Parole in the United States, 2020," Danielle Kaeble (December 2021) bjs.ojp.gov/content/pub/pdf/ppus20.pdf
Source: U.S. Department of Justice, Office of Justice Programs, Bureau of Justice Statistics, "Probation and Parole in the United States, 2020," by Danielle Kaeble (December https://bjs.ojp.gov/content/pub/pdf/ppus20.pdf
7K COURTESY OF
Used a Personal Injury Attorney in the Past


Or


Our data provide information about the businesses, jobs, industries, and workforce in the Phoenix metro area and statewide.
Discover and map population, housing, and other demographics for Arizona to target your messages.
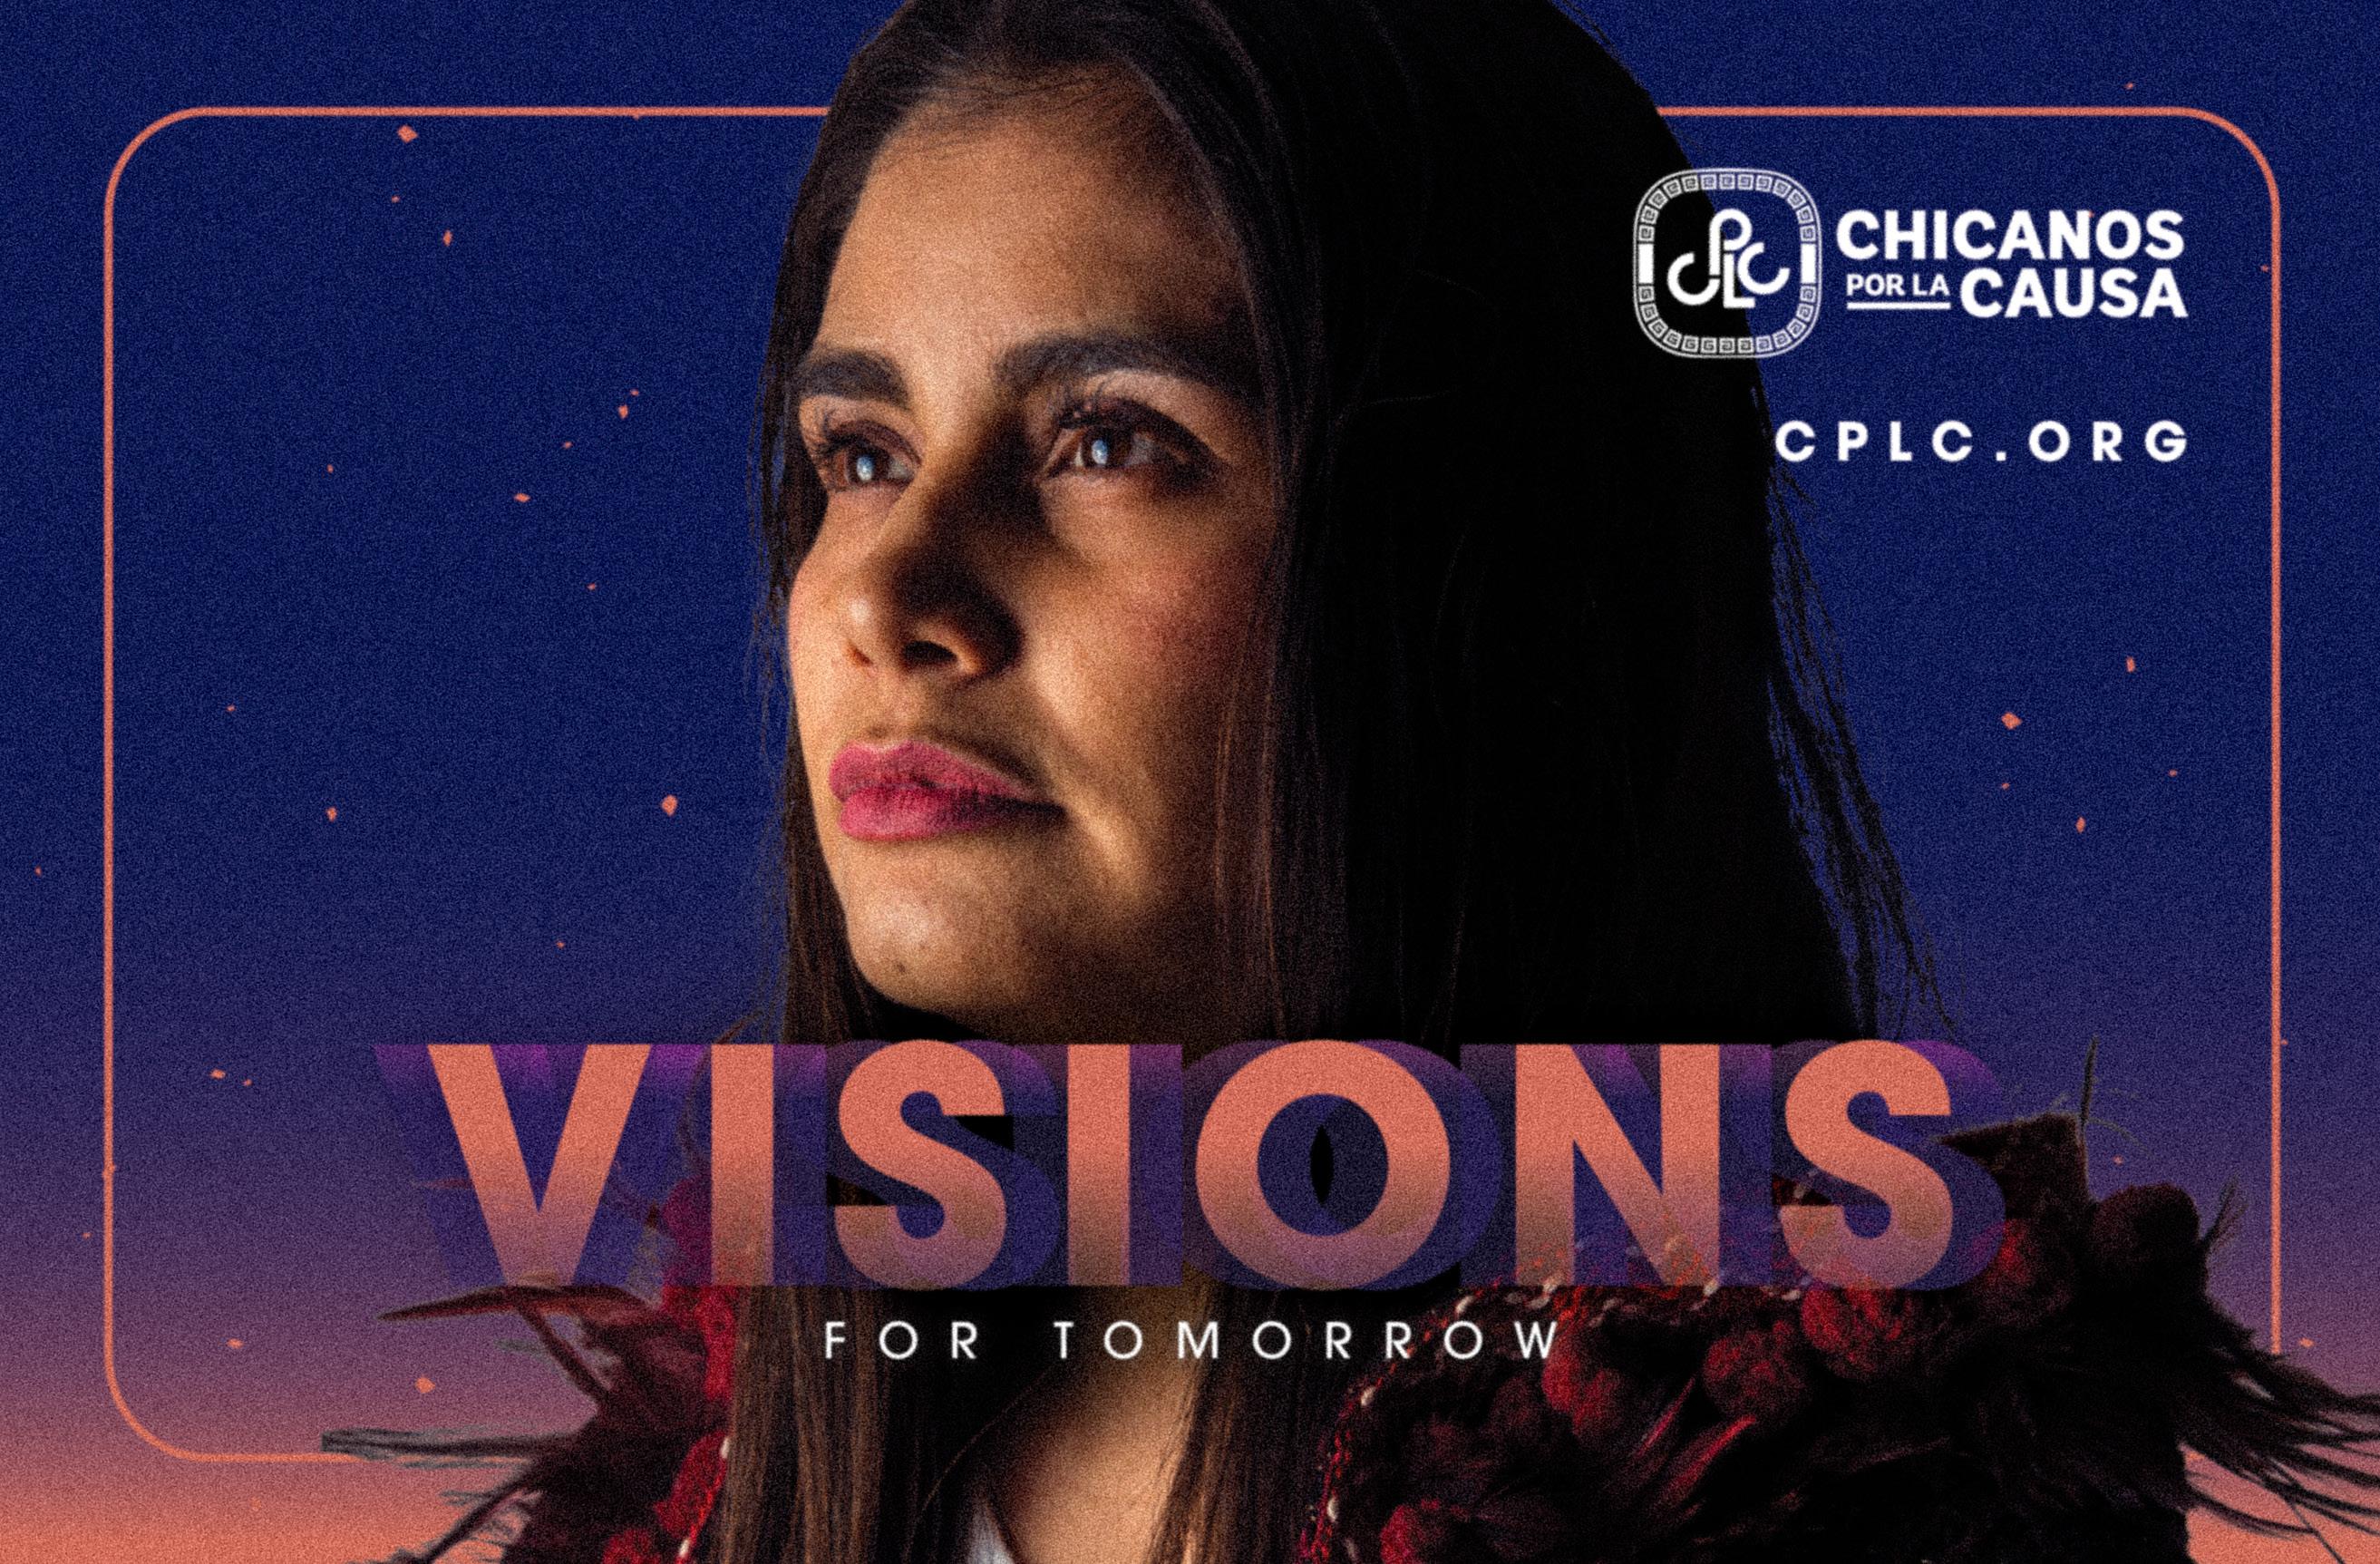
Let your employees know about traffic patterns in the area, where they can find hiking and biking trails, and how their kids' schools are performing.
Want to learn more about our data tools?
Sign up for a free maps and data training webinar at maps.azmag.gov/trainings.html
Arizona is one of our nation’s more open states in regard to ballot measures. They seem to pop up every other year, either from citizen initiatives or legislative referrals—and the 2022 midterm election in November will be no different.
As of July 22, 2022, there are eight statewide ballot measures for voters to consider in November, but there is one of particular importance for Arizona’s Hispanic community: Proposition 308, which would grant in-state college and university tuition status to Arizona Dreamers. Dreamers are those undocumented immigrants who were brought to the United States before they turned 16, usually under circumstances out of their control. They currently are protected (renewable two-year period) from deportation by the Deferred Action for Childhood Arrivals (DACA) executive order.
This should be no-brainer issue. Prop 308 has been referred to the ballot by the legislature and comes at a time when even sensible economic avenues seem to get bulldozed by those who want all roads to lead to an immigration scorched-earth political debate.
Proposition 308 is not an immigration issue; it’s a fairness and economic issue. Because of all the myths and incendiary rhetoric such as calling unarmed migrants crossing the border “an invasion,” it is important to understand what Prop 308 is and what it is not.
First of all, it is not free college tuition for undocumented immigrants. If approved, Arizona Dreamers would pay the same in-state tuition at our three state universities or 10 community colleges as their classmates and friends. It is definitely not a giveaway.
Secondly, and perhaps most important of all, it really has nothing to do with illegal immigration, so-called “open borders” or a surge in voter crossers. Instead, it has everything to do with doing what is best for Arizona and what is fair for Dreamers.
These children are resilient and familiar community members who have never really known another place that they call home. They are Arizona’s kids. They are our kids. About 2,000 Dreamers graduate annually from high schools in Arizona. They are our children’s friends and classmates; some are the salutatorians or valedictorians of their graduating classes, and many are leaders, entrepreneurs and innovators. They are integral members of our
2022 MIDTERM GENERAL ELECTION
DATE: November 8, 2022
2022 ARIZONA ELECTIONS INFO ballotpedia.org/Arizona_elections,_2022
To vote in Arizona, you must be a U.S. citizen 18 years or older on or before election day and a resident of an Arizona county.
To be eligible to vote in an election you must register at least 29 days prior to the election. You can register online, in person at the county recorder's office or by mail.
If you have an Arizona driver’s license and/or an Arizona non-operating I.D. card issued by the Motor Vehicle Division, you may register to vote through Service Arizona EZ Voter Registration. servicearizona.com/VoterRegistration
FIND YOUR COUNTY ELECTION OFFICIALS azsos.gov/county-election-info
CHICANOS POR LA CAUSA
1112 E. Buckeye Rd. Phoenix, AZ 85034
602.257.0700
Corporate.Receptionist@cplc.org
THE LUMINA FOUNDATION luminafoundation.org
It’s Not Just the Money – The Benefits of College Education to Individuals and Society
AMERICAN ACTION FORUM americanactionforum.org
The Fiscal Implications of the DACA Program ASSOCIATION OF PUBLIC & LAND-GRANT UNIVERSITIES aplu.org
How do college graduates benefit society at large?
THE HIGHER ED IMMIGRATION PORTAL Arizona Information higheredimmigrationportal.org/state/arizona
TUITION & FINANCIAL AID FOR UNDOCUMENTED STUDENTS higheredimmigrationportal.org/states
NEW AMERICAN ECONOMY
Immigrants and the Economy in Arizona newamericaneconomy.org/locations/arizona
workforce, whose talents, loyalty and skills are needed to ensure Arizona’s future ability to compete.
Under current Arizona law, Arizona Dreamers currently pay tuition that is 50% more than the current in-state tuition rate. Note that out-of-state tuition for the University of Arizona, for example, is about three times the rate for in-state students. According to the Higher Ed Immigration Portal, “Each state implements its own policies in terms of providing access to in-state tuition and state financial aid to the state’s undocumented residents.”
According to the portal, Arizona, in addition to Delaware, Iowa, Michigan and Pennsylvania, offer limited access. “Limited” in this case is defined by the portal as policies that "provide the state’s undocumented students, including DACA recipients, with access to in-state or reduced tuition in at least some public institutions.”
Why would Arizona want to lose some of its best home-grown talent to one of the 18 states (plus the District of Columbia) that offers comprehensive access to undocumented immigrants? Or even worse, why would Arizona allow these young potential students to be discouraged by the inflammatory political rhetoric, and possibly even decide to opt out of college altogether? It makes no sense.
Dreamers can help grow our economy by launching businesses and using their life and educational experiences to become team leaders and valued employees. They might become our doctors, nurses, lawyers or other professionals who are greatly needed during this time of labor shortages—but only if they stay in Arizona.
An estimated 96 percent of DACA students are either currently employed or in school. There are 23,090 DACA recipients in Arizona as of December 2021, and, according to the New American Economy, a bipartisan research and advocacy organization, there are 36,909 DACA-eligible residents.
Under Prop 308, there is a direct return on our investment, which we’ve already made in providing K–12 public education. According to an issue paper from the Lumina Foundation, recent estimates show a $380,000 net positive contribution per college graduate over their lifetime. According to a study by the American Action Forum, DACA recipients contribute nearly $42 billion annually to the U.S. economy.
It’s obvious that Dreamers are good for Arizona. Various business leaders, chambers and groups have lent their names in support of the economic argument to correct the existing state law, which was passed in 2006.
Now is definitely the time to act. Arizona cannot afford to repeat its mistakes of the past when it comes to Dreamers. With eyes wide open and a clear vision, it’s time to vote yes on Prop 308. It is a vote for fairness and simply makes economic sense.
Joseph Garcia is vice president of public policy for Chicanos Por La Causa (CPLC) and executive director of the CPLC Action Fund. He is an adviserontheYESONPROP308CampaignandamemberoftheDATOS Committee.
PLATINUM SPEAKER SPONSOR

PRESENTED BY
PHOTO BOOTH SPONSOR
BRONZE SPONSORS
SILVER SPONSOR
MEDIA PARTNERS
VIDEO PRODUCTION PARTNER