By Andrew J. Greenlee


Page 1 ISSUE BRIEF
Housing Affordability for Illinois Artists and Creative Workers (2019–2021)
ISSUE BRIEF
April 2023 artsimpact.faa.illinois.edu College of Fine and Applied Arts 100 Architecture Building 608 East Lorado Drive | M/C 622 Champaign, IL 61820
A National Crisis of Affordability
In Illinois, the average worker working at minimum wage ($12 per hour) would have to work 64 hours per week to afford a modest 1-bedroom rental home. To afford a 2-bedroom home while working full time, a worker would need to make $22.80 per hour - an annual salary of $47,434. For many workers across the state, income has not kept up with the cost of rent. The impact of job and wage instability during the COVID-19 pandemic further illustrated the precarious nature of the connection between work and housing in Illinois.
This precarious nature is felt nationwide - the National Low-Income Housing Coalition ranks Illinois 20th amongst states with regards to the wage needed to afford housing. The national wage needed to afford a 2-bedroom rental home is $25.82, $3.02 higher than that needed in Illinois. Nationwide, more than one third of workers are paid median wages that are less than the wages needed to rent a 1-bedroom unit working 40 hours per week. Eleven of the twenty-five largest occupations in the United States pay less than the wage needed to rent a one-bedroom housing unit (Figure 1).
Figure 1: Large Occupations with Wage Below the National Housing Wage (2022)
2 Bedroom Housing Wage
1 Bedroom Housing Wage
Secretaries and Administrative Assistants
Financial Clerks
Other Production Occupations
Other Office and Administrative Support Workers
Information and Record Clerks
Material Moving Workers
Building Cleaning and Pest Care Aides
Home Health and Personal Care Aides
Cooks and Food Preparation Workers
Page 2 ISSUE BRIEF
Source: National Low-Income Housing Coalition Analysis of May 2021 Occupational Employment Statistics, BLS, adjusted to 2022 dollars. Housing wages based on HUD fair market rents.
Hourly Wage $30 $20 $10 0 $25.8 $21.25 $20.19 $19.75 $19.18 $18.92 $18.71 $15.78 $15.08 $15.07 $14.8 $14.59 $13.23
Retail Sales Workers Food and Beverage Serving Workers
Given the combined impact of the national housing affordability crisis, escalation of rents, and the greater instability brought by the coronavirus pandemic, this Issue Brief analyzes trends in wages for artists and creative workers in Illinois and how artists and creative workers have fared with regards to housing affordability between 2019 and 2021. In the wake of the coronavirus pandemic, these trends are of particular importance, as rents continue to rise in many housing markets throughout the state.
Data and Methodology
This issue brief draws from data from the U.S. Census Bureau’s Public Use Microdata Series (PUMS) files for the years 2019 and 2021. These data are frequently used by researchers and policy analysts to derive detailed estimates of population characteristics which are not directly produced as part of the Census Bureau’s American Community Survey (ACS). In contrast to the decennial census which is focused on a 100 percent count of the population, ACS and PUMS data are derived from an ongoing sample of the population, with an emphasis on estimating the characteristics of the population.
These sample-based estimates provide useful information, and in the case of PUMS data can be split by characteristics to produce very detailed estimates of population characteristics. However, these data contain a tradeoff - as samples become more specific to subgroups or locations, the uncertainty about the relationship between the population estimate and the true value for the population also grows. We focus on estimates of the characteristics of the population and omit margins of error from our reporting, however, margins of error have been examined to ensure appropriate interpretation of our analysis.
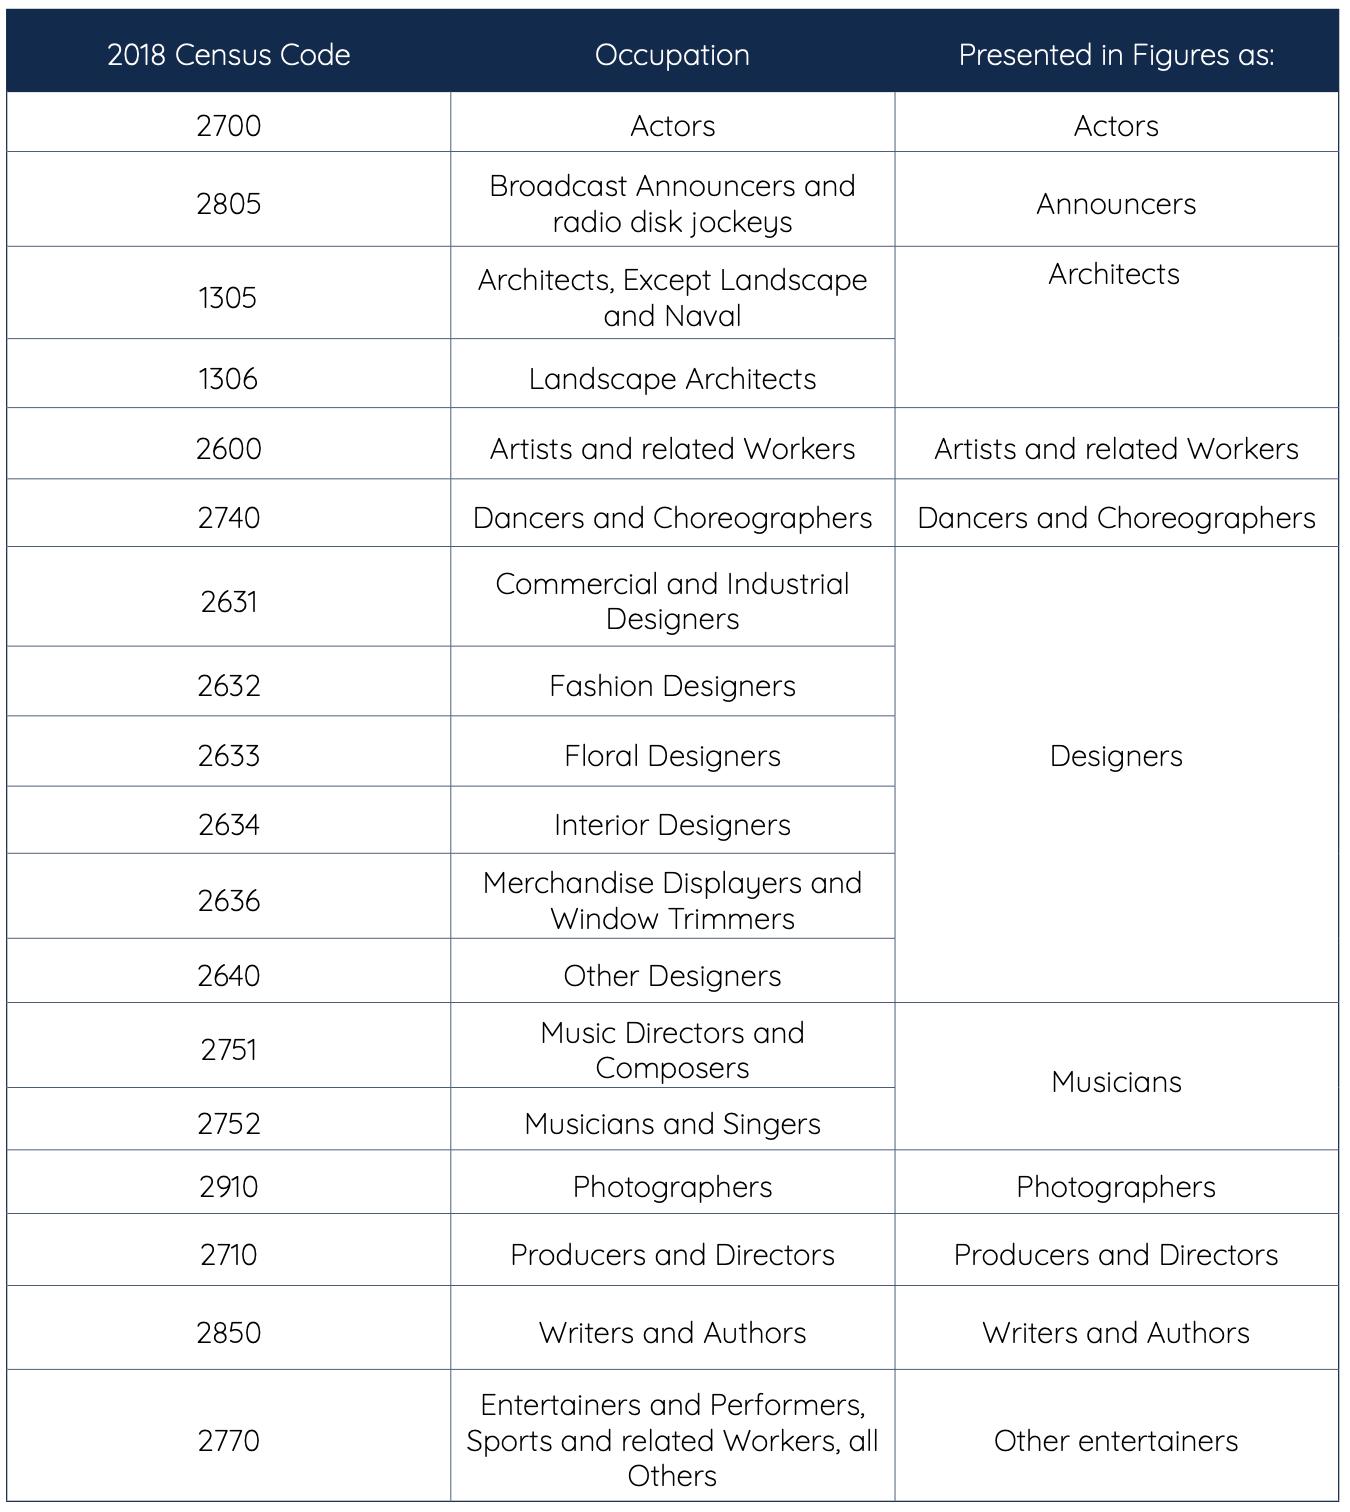
We use the same approach used in Arts Impact Initiative Issue Brief: The Artist Labor Force: A Statistical Look at Illinois in the Context of the U.S. for identifying the artist labor force. We rely upon 2018 Standard Occupation Codes designated by the National Endowment for the Arts for the study of artists’ employment (see the Technical Appendix for more information).
All wage and income statistics reported in this issue brief are inflation adjusted to 2021 dollars using the CPI-U-RS adjustment factor , so that statistics between 2019 and 2021 can be directly compared to each other.
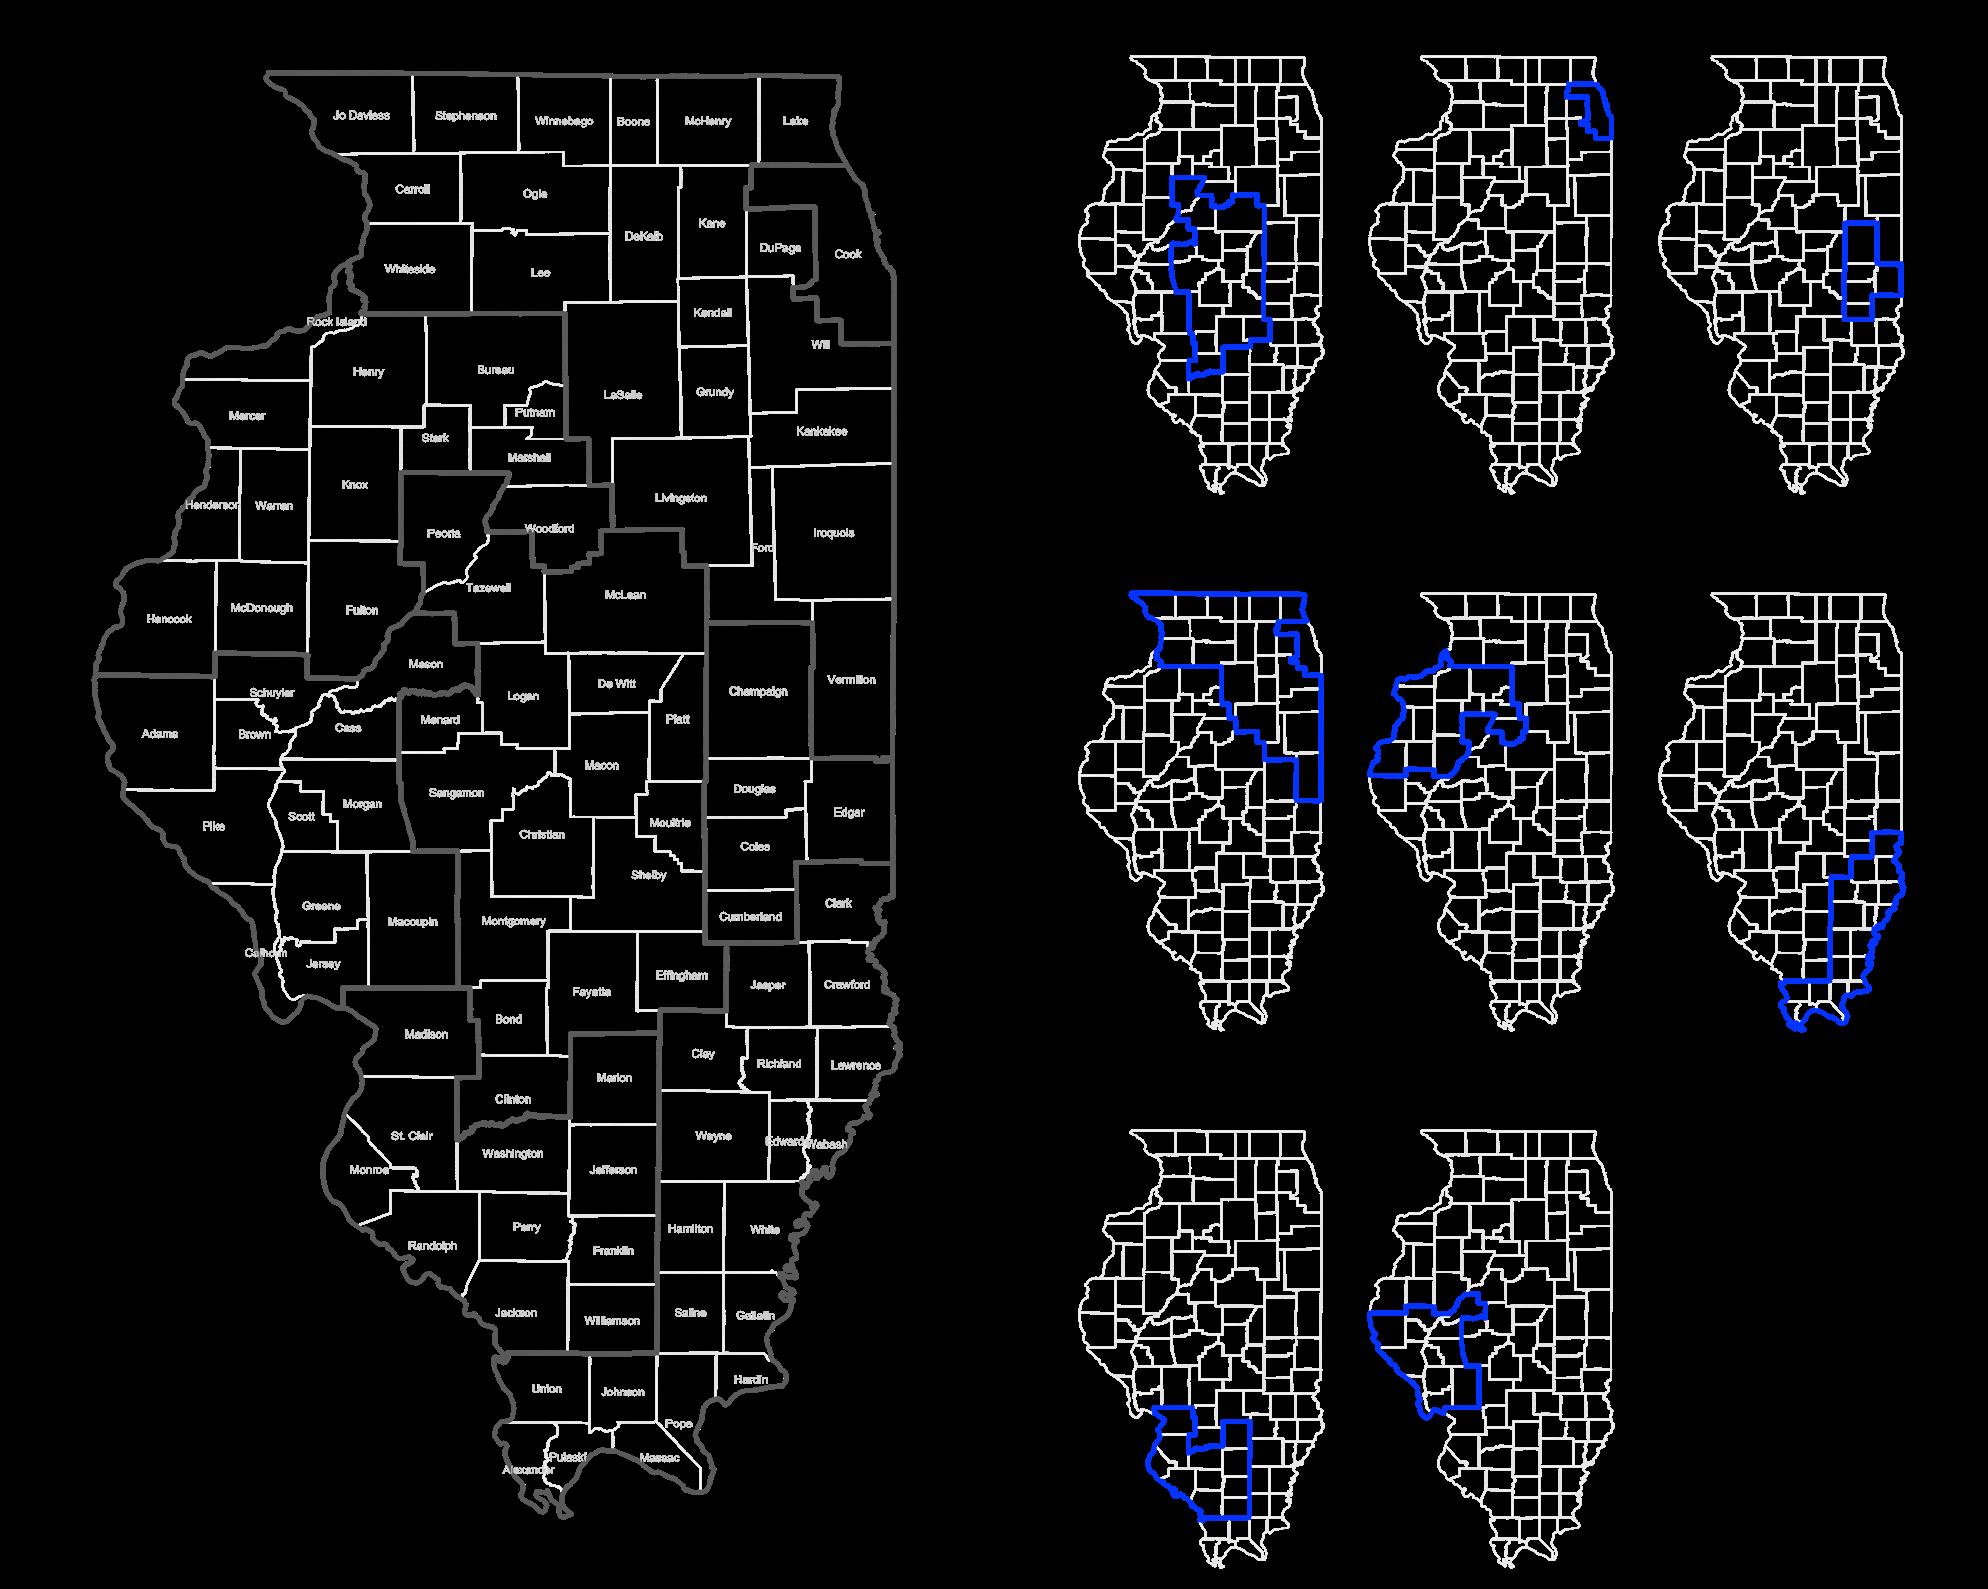
For the purposes of this analysis, we divide Illinois into eight subregions (Figure 2). These subregions are defined in part by the nature of Public Use Microdata Areas (PUMAs) which are a specialized administrative geography produced by the U.S. Census Bureau that contain approximately 100,000 residents each. Because the American Community Survey relies upon a sample of the population, PUMAs ensure that a sufficient number of surveys are present to produce estimates of the characteristics of the population within that area. We aggregate PUMAs into Illinois subregions and use these subregions to describe the varying characteristics of artists and creative workers and their housing.
Page 3 ISSUE BRIEF
Figure 2: Illinois Regions
Page 4 ISSUE BRIEF
The Nature of Work for Illinois Artists
In 2021, 99,552 Illinois workers were working in the arts and related creative industries - this represents approximately 1.5 percent of the Illinois workforce. 64,063 (64.3 percent) of these workers were working full time (more than 40 hours per week). The concentration of artists and creative workers tends to follow the broader concentration of the state’s workforce, with 85 percent of the state’s artists being located within the Chicago and Northeast regions (Table 1). As a share of the workforce, artists and creative workers are highest represented in the Chicago region - representing 2 percent of the overall workforce.
Table 1: Illinois Artists by Region (2019 and 2021)
Based upon the National Endowment for the Arts’ definitions of which occupations encompass arts and creative work, Designers, Artists, and Architects combined make up 66.3 percent of the Arts and Creative workforce in the state (Table 2). Between 2019 and 2021, the number of individuals working part-time or full-time in these fields has fluctuated substantially. Some of this variation is likely due to the continued impacts of the COVID-19 pandemic which displaced many individuals from their usual sources of work and income. This is acutely observed in looking at the change in the number of individuals working as dancers and choreographers, musicians, entertainers and performers, photographers, and actors. Conversely, those working as artists increased, likely in part due to displacement or disruption of work in other industries.
Page 5 ISSUE BRIEF
2019 2021 Region Artist Non-Artist Artist (%) Artist Non-Artist Artist (%) Central 6,642 524,999 1.2% 4,586 527,341 0.9% Chicago 54,608 2,745,296 2.0% 57,210 2,681,413 2.0% Eastern 2,019 171,193 1.2% 2,212 165,225 1.3% Northeast 26,667 2,401,664 1.1% 27,825 2,340,724 1.1% Northwest 1,390 233,655 0.6% 2,333 222,431 1.0% Southeast 276 111,691 0.2% 368 104,923 0.3% Southwest 4,600 443,579 1.0% 3,741 422,235 0.8% Western 1,015 124,265 0.8% 1,277 115,664 1.0% Total 97,217 6,756,342 99,552 6,579,956 Data Source: 2019 and 2021 1-Year ACS Public Use Microdata Samples
Table 2: Artists by Occupation (2019 and 2021)
Despite the volatility observed in some fields, the overall shares of artists and creative workers by occupation remains relatively constant, with a notable gain in shares for producers and directors, artists, and announcers (Figure 3).
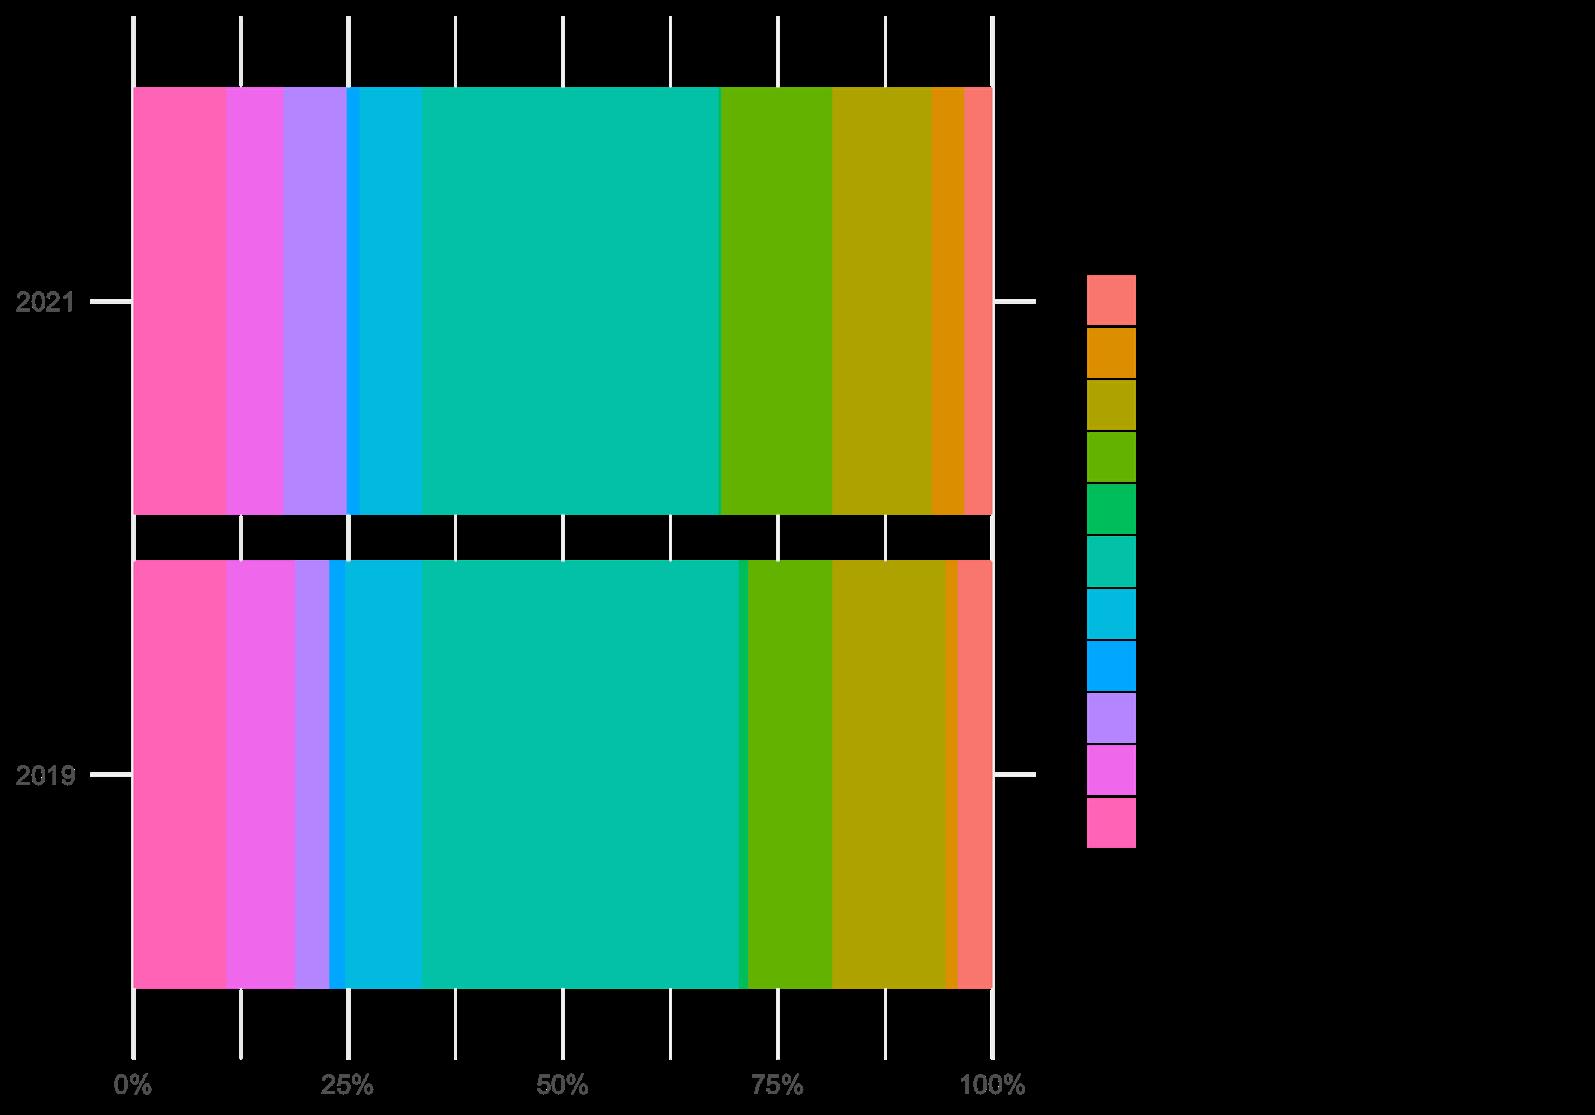
Figure 3: Shares of Artists and Creative Workers by Occupation (2019 and 2021)
Page 6 ISSUE BRIEF Occupation 2019 2021 Δ '19-'21 Δ ‘19-’21 (%) Actors 3,998 3,326 -672 -16.8% Announcers 1,332 3,734 2,402 180.3% Architects 12,786 11,540 -1,246 -9.7% Artists and Related Workers 9,583 12,832 3,249 33.9% Dancers and Choreographers 998 365 -633 -63.4% Designers 35,917 34,319 -1,598 -4.4% Musicians 8,626 7,232 -1,394 -16.2% Other Entertainers and Performers 1,808 1,558 -250 -13.8% Producers and Directors 3,859 7,293 3,434 89.0% Protographers 7,787 6,632 -1,155 -14.8% Writers and Authors 10,523 10,721 198 1.9% Non-Artists 6,756,342 6,579,956 -176,386 -2.6% Data Source: 2019 and 2021 1-Year ACS Public Use Microdata Samples
Wages for Artists and Creative Workers in Illinois
Looking at differences by sectors, artists and creative workers are overrepresented amongst the selfemployed (Table 3). In 2021, self-employed artists working full time made on average $31,275 - $19,087 per year less than self-employed non-artists. While substantial, this gap between artists and non-artists closed slightly when compared to 2019 when the income gap for self-employed workers was $24,149. Such income differences were less apparent in looking at workers in the private sector (where artists and creative workers make on average $134 less per year compared to non-artists), and in government (where artists and creative workers make on average $12,266 less than non-artists).
Table 3: Wages by Sector for Artists and Creative Workers (2019 and 2021)
Taken together, this wage information helps us to understand some of the potential issues which artists and creative workers may face with regards to housing consumption.
To summarize:
• Artists and creative workers are concentrated in higher costs regions of the state such as the Chicago and Northeastern region.
• Pandemic-era labor market instability has resulted in a rise in the number of individuals working as artists.
Amongst Illinois workers, artists are overrepresented amongst the self-employed, and those artists and creative workers who are self-employed tend on average to make substantially less than others who are self-employed.
These observations provide important context for thinking about housing consumption. Spatial concentration in higher cost regions, labor market uncertainty stemming from the COVID-pandemic, and an increased share of self-employed paint a picture of a population who are likely to face increased barriers to accessing housing, and who are likely to pay a greater share of their income for housing. The next section examines these issues in turn.
Page 7 ISSUE BRIEF
2019 2021 Sector Artists (%) Wage (Artists)1 Wage (NonArtists)1 Artists (%) Wage (Artists)1 Wage (NonArtists)1 Government 0.4% $61,046 $65,146 0.4% $55,000 $67,266 Private Sector 1.1% $62,899 $70,841 1.2% $73,826 $73,960 Self-Employed 4.0% $30,534 $54,683 4.6% $31,275 $50,362 Working Without Pay 3.7% $19,200 $50,804 1.7% $3,000 $36,559 1Wages in 2021 dollars. Data Source: 2019 and 2021 1-Year ACS Public Use Microdata Samples
Housing Consumption for Artists and Creative Workers in Illinois
The relationship between income and housing consumption is by its nature complex to parse out. Housing statistics focused on consumption of housing are produced for households as opposed to wage statistics, which focus on individual workers. In parsing out housing costs, we focus on those households which contain at least one artist or creative worker and compare these households to those which don’t contain any artists or creative workers.
Looking at overall housing costs, households with at least one working artist who either owned or rented paid on average $272 more per month in ownership costs and $353 more in rental costs when compared to households with no artists present (Table 4). Between 2019 and 2021, households with at least one working artist present, saw an average monthly rental cost increase of $93 when compared to $17 for households with no artists. Conversely, households with at least one working artist present who owned their house saw a decline in monthly ownership costs of $117 from 2019 to 2021, versus a decline of $64 for households with no working artists present.
Table 4: Average Housing Costs (2019 and 2021)
Data Source: 2019 and 2021 1-Year ACS Public Use Microdata Samples
Part of the observed cost differences are likely due to the concentration of artists and creative workers in higher-cost Illinois housing markets including the Chicago area and Northeastern regions of the state. Those areas had the highest average housing costs for households with artists and creative workers present, with rates also surpassing those of households without artists present (Table 5).
Page 8 ISSUE BRIEF Artists Non-Artists Tenure 2019 2021 Change Percent 2019 2021 Change Percent Government $2,051 $1,934 -$117 -5.7% $1,726 $1,662 -$64 -3.7% Private Sector $1,424 $1,516 $93 6.5% $1,146 $1,163 $17 1.5%
Table 5: Average Housing Cost by Region (2019 and 2021)
To get a fuller picture of whether these increased costs represent more of a hardship for households with artists, we look at the share of household income spent on housing costs. Based upon federal standards, households paying more than 30 percent of their income towards housing costs are considered cost burdened. In 2021, 22:3% of artists and creative workers were cost burdened, 4.7 percentage points more than the share of non-artists (Table 6). Between 2019 and 2021, the share of artists who are cost burdened increased by 1.5 percentage points compared to the 0.7 percentage points for non-artists.
Table 6: Share of Households Working Full Time Who Are CostBurdened (2019 and 2021)
Data Source: 2019 and 2021 1-Year ACS Public Use Microdata Samples
Looking at the shares of household income spend on rent, on average renters spend a greater share of their income on housing, and this share has gone up between 2019 and 2021 (Table 7). For owners, the average share of income spent is highest in Chicago, the Eastern, and Northeast regions of the state. For renters, this share is highest in the northwest and southwest portions of the state.
Page 9 ISSUE BRIEF
Artists Non-Artists Region 2019 2021 Change Percent 2019 2021 Change Percent Central $1,266 $1,129 -$137 -10.8% $1,124 $1,098 -$26 -2.3% Chicago $2,067 $2,046 -$21 -1.0% $1,923 $1,864 -$58 -3.0% Eastern $1,066 $1,114 $48 4.5% $1,077 $1,058 -$19 -1.8% Northeast $1,915 $1,816 -$99 -5.1% $1,752 $1,698 -$55 -3.1% Northwest $986 $1,067 $81 8.3% $980 $999 $18 1.9% Southeast $705 $901 $196 27.8% $910 $891 -$19 -2.1% Southwest $1,179 $1,339 $160 13.6% $1,125 $1,107 -$18 -1.6% Western $927 $984 $58 6.2% $940 $903 -$36 -3.9% Data Source: 2019 and 2021 1-Year ACS Public Use Microdata Samples
2019 2021 Occupation Cost Burdened Not Cost Burdened Cost Burdened (%) Cost Burdened Not Cost Burdened Cost Burdened (%) Artist 12,314 46,923 20.8% 14,100 49,028 22.3% Non-Artist 760,077 3,738,321 16.9% 795,534 3,728,255 17.6%
Table 7: Share of Household Income Spent on Rent for Households With A Full Time Artist of Creative Worker Present (2019 and 2021)
Table 8: Share of Household Income Spent on Housing for FullTime Workers by Region (2019 and 2021)
Taken together information on housing costs and cost burden indicate that when compared to other households, full-time artists experience higher rates of cost burden throughout the state, with renter households spending larger shares of their income on rent when compared to owners. While these data do not allow us to parse out whether these cost factors are shaping decisions to own or rent or residential preferences for housing within certain regions of the state, they conform to the previously observed patterns of wage disparity and overall precarity for artists and creative workers.
Page 10 ISSUE BRIEF Owned Rented Region Artist Non-Artist Difference Artist Non-Artist Difference Central 15.3% 15.2% 0.1% 14.9% 22.4% -7.5% Chicago 23.3% 19.1% 4.2% 24.7% 25.8% -1.1% Eastern 23.2% 15.4% 7.8% 35.0% 26.4% 8.6% Northeast 19.7% 17.9% 1.9% 31.9% 25.4% 6.5% Northwest 19.0% 14.6% 4.4% 61.0% 20.3% 40.7% Southeast 16.0% 15.4% 0.6% NA 20.7% NA Southwest 15.3% 15.3% 0.0% 42.2% 24.5% 17.6% Western 15.1% 15.1% 0.0% NA 21.6% NA Data Source: 2019 and 2021 1-Year ACS Public Use Microdata Samples Artists Non-Artists Tenure 2019 2021 Change Percent 2019 2021 Change Percent Owned 21.0% 19.8% -1.2% -5.8% 17.4% 17.4% 0.0% 0.1% Rented 26.6% 27.7% 1.0% 3.8% 25.0% 26.5% 1.5% 6.0% Data Source: 2019 and 2021 1-Year ACS Public Use Microdata Samples
Conclusion
Housing affordability remains a major concern for many households throughout the state of Illinois. The COVID-19 pandemic brought into stark relief the precarity faced by many households in the state, particularly in with regards to their housing. This brief provides evidence that when compared to other households, households with working artists and creative workers pay a higher cost for their housing and tend to also pay a higher share of their household income towards housing. Overall, households outside of Chicago and the Northeastern region of the state fare better with regards to cost burden, however, substantial disparities remain. Renter households overall face higher rates of cost burden, and the gaps between the average renter household with full-time artists or creative workers present and those without are substantial.
Cost burdens have eased slightly, likely in part due to the impact of emergency federal spending on pandemic-era relief as reflected in differences between 2019 and 2021. Although these reflect the most currently available PUMS data, housing market trends since 2021 suggest an increase in both owner and renter costs which are likely to disparately impacts artists and creative workers.
This brief focuses specifically on comparing differences in wages and the share of household income spent on housing to raise awareness of how housing affordability issues disparately impact artists and creative workers. While this brief only covers basic dimensions of these relationships, findings suggest the need for a deeper examination of how cost burden may be contributing to shifts in shares of the Illinois artist and creative population in certain fields and may also contribute to the rationale for prioritizing artists and creative workers for affordable housing throughout the state.
Acknowledgements
This brief was supported by the University of Illinois System’s Presidential Initiative: Expanding the Impact of the Arts and the Humanities. We wish to thank the following individuals for their contributions to this brief: professors Dr. Andrew Greenlee, Dr. Jennifer Novak-Leonard, and Dr. Magdalena Novoa and Arpita Banerjee, Research Assistant, in the College of Fine and Applied Arts’ Department of Urban and Regional Planning; Thank you to Natalie Fiol for her design work, and to Dr. Carolyn Randolph-Kato, Visiting Associate Director of the College of Fine and Applied Arts’ Arts Impact Initiative, for supporting this effort.
The Arts Impact Initiative (AII) fosters understanding of the roles of art and artists in community development and promoting social well-being to guide arts practice and policy. AII is a three-year pilot program supported by the Investment for Growth Program out of the Office of the Provost and the Office of the Vice Chancellor for Research and Innovation at the University of Illinois Urbana-Champaign.
Page 11 ISSUE BRIEF
Technical Appendix
Occupation Codes used to define the artist labor force
Page 12 ISSUE BRIEF
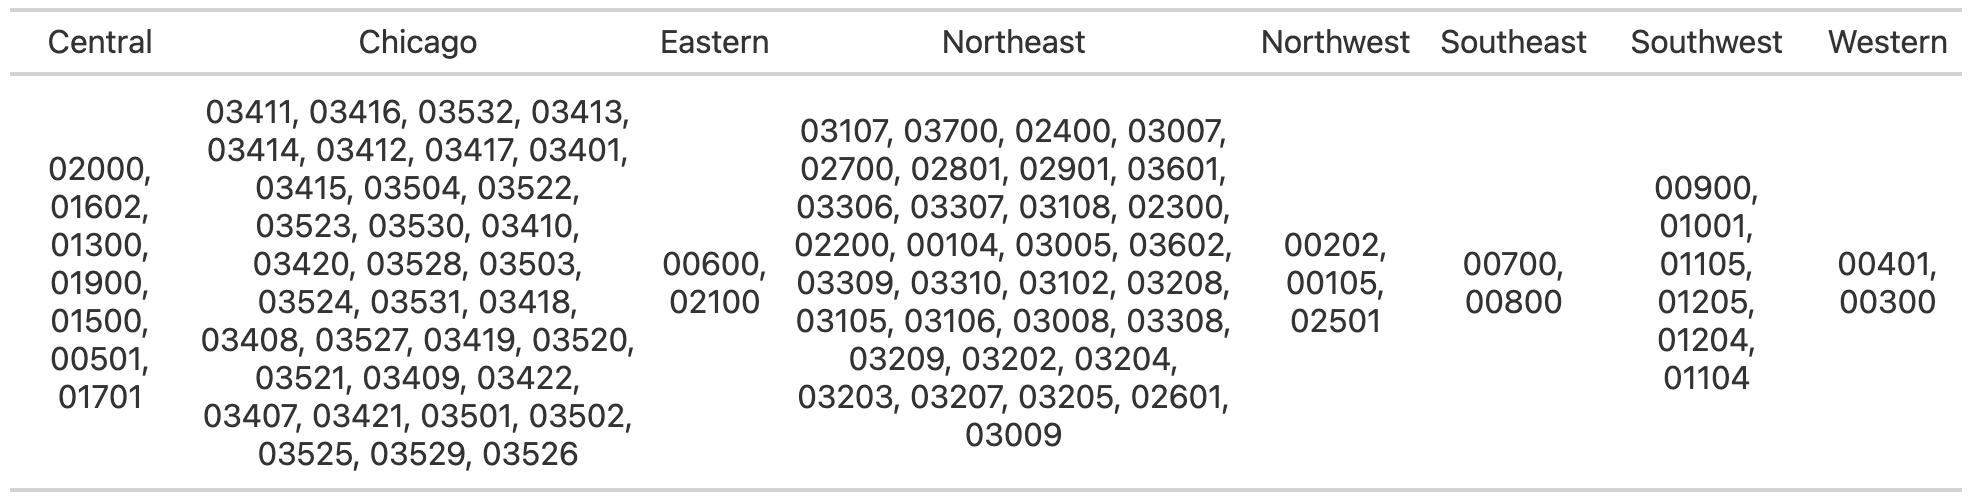
PUMAs used to define geographic regions within Illinois
ihttps://nlihc.org/oor
iihttps://www.bls.gov/cpi/research-series/r-cpi-u-rs-home.htm
Page 13 ISSUE BRIEF


